. 2017 Jun;66(6):1703-1712.
doi: 10.2337/db16-0962. Epub 2017 Feb 28.

A Whole-Genome RNA Interference Screen Reveals a Role for Spry2 in Insulin Transcription and the Unfolded Protein Response

Affiliations

A Whole-Genome RNA Interference Screen Reveals a Role for Spry2 in Insulin Transcription and the Unfolded Protein Response

Zachary Pappalardo et al. Diabetes. 2017 Jun.

Abstract

Insulin production by the pancreatic β-cell is required for normal glucose homeostasis. While key transcription factors that bind to the insulin promoter are known, relatively little is known about the upstream regulators of insulin transcription. Using a whole-genome RNA interference screen, we uncovered 26 novel regulators of insulin transcription that regulate diverse processes including oxidative phosphorylation, vesicle traffic, and the unfolded protein response (UPR). We focused on Spry2-a gene implicated in human type 2 diabetes by genome-wide association studies but without a clear connection to glucose homeostasis. We showed that Spry2 is a novel UPR target and its upregulation is dependent on PERK. Knockdown of Spry2 resulted in reduced expression of Serca2, reduced endoplasmic reticulum calcium levels, and induction of the UPR. Spry2 deletion in the adult mouse β-cell caused hyperglycemia and hypoinsulinemia. Our study greatly expands the compendium of insulin promoter regulators and demonstrates a novel β-cell link between Spry2 and human diabetes.


Figures

Figure 1
Figure 1
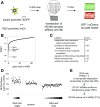
Whole-genome RNAi screen reveals novel regulators of the insulin promoter. A: Screen schematic: MIN6 cells expressing EGFP under control of the insulin promoter and mCherry (mCh) under control of the RSV promoter are transfected with siRNAs in 384-well plates, and GFP and mCherry are read out by a plate reader. B: −log(p) value for positive regulator genes screened as determined by RSA. C: Enriched GO term categories with enrichment scores [−log(p)]. D: GFP/mCherry fluorescence for siRNAs during secondary screening normalized (norm) to control anti-luciferase siRNA. Each point represents the GFP/mCherry fluorescence compared with control with SEM. siRNAs are ordered by RSA rank for positive regulators (right cluster), randomly selected from all siRNAs (center cluster), or ordered by RSA rank for negative regulators (left cluster). n ≥3. For FDR-corrected P values, see Supplementary Table 2. E: Criteria used for selection of siRNAs for secondary screening and overall confirmation rates. IPA, Ingenuity Pathway Analysis.
Figure 2
Figure 2
Hit confirmation. A: preIns1 mRNA by qRT-PCR with SEM from MIN6 cells transfected with the indicated siRNAs. Red indicates genes known to be involved in human diabetes. P values were adjusted for multiple testing using the Benjamini-Hochberg method. For P values, see Supplementary Table 2 (n = 3 for each siRNA). Genes are organized according to known functions. B: The indicated siRNAs targeting Spry2 were transfected into MIN6 cells, and preIns1 mRNA was measured by qRT-PCR (n = 9). *P < 0.05, ***P < 0.001. GPCR, G-protein–coupled receptor; neg, negative; phos, phosphatase.
Figure 3
Figure 3
Spry2 is a UPR target. A: MIN6 cells were treated with the indicated concentrations of thapsigargan for 12 h and analyzed for Spry2 or Wfs1 expression by qRT-PCR (n = 6). B: As in A, but analyzed for Spry2 protein normalized to GAPDH expression (n = 4). C: MEFs of the indicated genotype were stimulated with 500 nmol/L thapsigargan (Tg) or vehicle (DMSO) for 6 h and analyzed for Spry2 expression by qRT-PCR (n = 6). D: As in C, but with 2.5 ug/mL of tunicamycin (Tn). E: MIN6 cells were transfected with the indicated siRNA targeting Wfs1, and qRT-PCR was performed for Spry2 mRNA (n = 9). F: As in E, but Spry2 protein was quantitated by Western blot and normalized to GAPDH protein (n = 3). For a representative blot, see Fig. 4C. SEM is plotted. *P < 0.05, **P < 0.01, ***P < 0.001. AU, arbitrary units.
Figure 4
Figure 4
Knockdown of Spry2 triggers the UPR. A: MIN6 cells were transfected with the indicated siRNAs, and qRT-PCR was performed for CHOP (n = 9). B: As in A, but for spliced Xbp1 (n = 9). C: MIN6 cells were transfected with the indicated siRNAs, and Western blots were run for the indicated proteins. This is a representative blot of 3–6 experiments. D: Quantitation of phospho-PERK normalized to total PERK (n = 3–6). E: Quantitation of phospho-Eif2α normalized to total Eif2α (n = 3–6). F: MIN6 cells transfected with the indicated siRNAs and annexin V+ cells were measured by flow cytometry (n = 9). SEM is plotted. *P < 0.05, **P < 0.01, ***P < 0.001.
Figure 5
Figure 5
Spry2 knockdown affects ER calcium. A: D1ER-expressing MIN6 cells were transfected with the indicated siRNAs. A total of 10,000 live events were analyzed for FRET, and the percent change in the frequency of cells with low ER calcium relative to the luciferase control is plotted (n = 7–8). B: MIN6 cells were transfected with the indicated siRNAs, and the indicated proteins were measured by Western blot (n = 9). C: Quantitation of B. D: MIN6 cells were transfected with the indicated siRNAs, and Serca2b mRNA was measured by qRT-PCR (n = 3). E: MIN6 cells were transfected with the indicated siRNAs and treated with TUDCA (500 μmol/L) or vehicle for 24 h prior to harvest. qRT-PCR for preIns1 was performed (n = 3). F: As in E, but percent dead cells was quantified by flow cytometry (n = 6). SEM is plotted. *P < 0.05, **P < 0.01, ***P < 0.001.
Figure 6
Figure 6
β-Cell deletion of Spry2 knockdown causes hyperglycemia and hypoinsulinemia. A: Complete genotypes of mice used in this study. B: Intraperitoneal glucose tolerance testing in mice of the indicated genotypes at 12 weeks of age. P < 0.05 between Spry2 wt and Spry2 β-ko (n = 7 wt, 11 β-het, 13 β-ko). C: Area under the curve (AUC) above fasting glucose for B. D: Plasma insulin levels, either fasting or 15 min after intraperitoneal glucose challenge, at 14 weeks of age (n = 3 Spry2 wt, 3 Spry2 β-ko). E: qRT-PCR for Ins1/2 mRNA from islets of the indicated genotypes isolated at 17 weeks of age (n = 16 Spry2 wt, β-het; n = 12 Spry2 β-flox). F: Islets from mice of the indicated genotypes were analyzed for phospho-PERK, total PERK, phospho-Eif2α, or total Eif2α. G: Quantitation of phospho-PERK/total PERK (n = 4 Spry2 wt, 5 β-ko). H: Quantitation of phospho-Eif2α/total Eif2α (n = 4 Spry2 wt, 5 β-ko). SEM is plotted. *P < 0.05. exp, expression.

Comment in

Similar articles

Cited by

References

    1. International Diabetes Federation. IDF Diabetes Atlas, 7th edition [Internet], 2015. Available from http://diabetesatlas.org. Accessed 3 August 2016
    1. Maahs DM, West NA, Lawrence JM, Mayer-Davis EJ. Epidemiology of type 1 diabetes. Endocrinol Metab Clin North Am 2010;39:481–497 - PMC - PubMed
    1. Dabelea D, Mayer-Davis EJ, Saydah S, et al. .; SEARCH for Diabetes in Youth Study . Prevalence of type 1 and type 2 diabetes among children and adolescents from 2001 to 2009. JAMA 2014;311:1778–1786 - PMC - PubMed
    1. Morris AP. Fine mapping of type 2 diabetes susceptibility loci. Curr Diab Rep 2014;14:549. - PMC - PubMed
    1. Imamura M, Iwata M, Maegawa H, et al. . Genetic variants at CDC123/CAMK1D and SPRY2 are associated with susceptibility to type 2 diabetes in the Japanese population. Diabetologia 2011;54:3071–3077 - PubMed

MeSH terms