. 2017 Mar 14;114(11):E2243-E2252.
doi: 10.1073/pnas.1614412114. Epub 2017 Feb 28.

Rapid and efficient generation of oligodendrocytes from human induced pluripotent stem cells using transcription factors

Affiliations

Rapid and efficient generation of oligodendrocytes from human induced pluripotent stem cells using transcription factors

Marc Ehrlich et al. Proc Natl Acad Sci U S A. .

Abstract

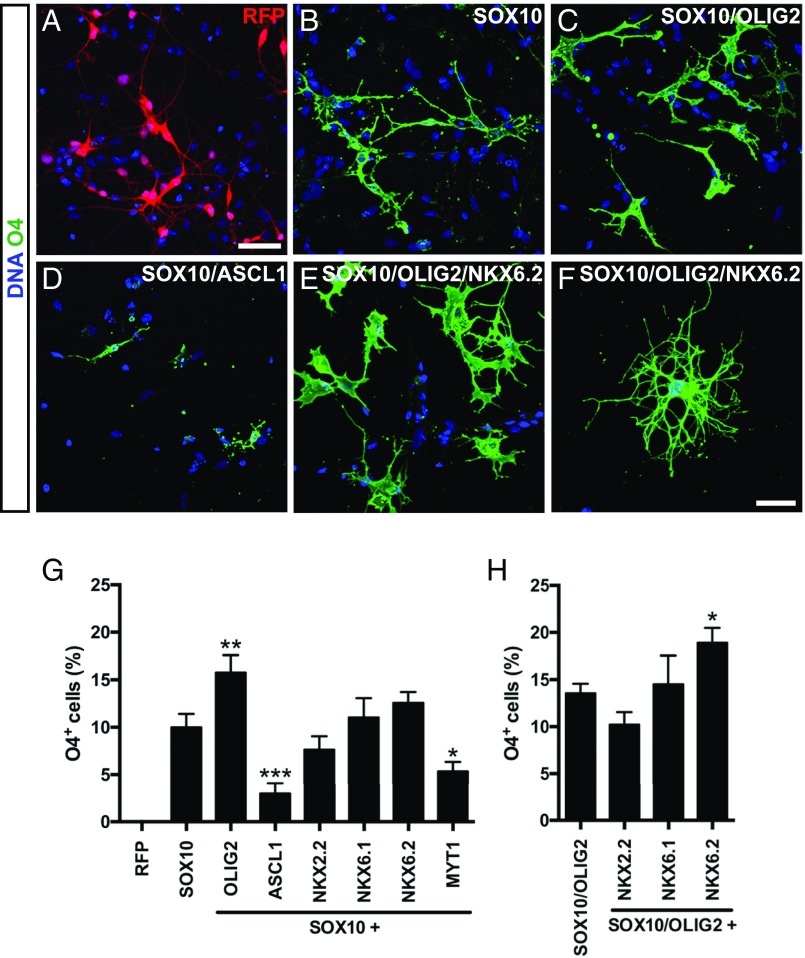
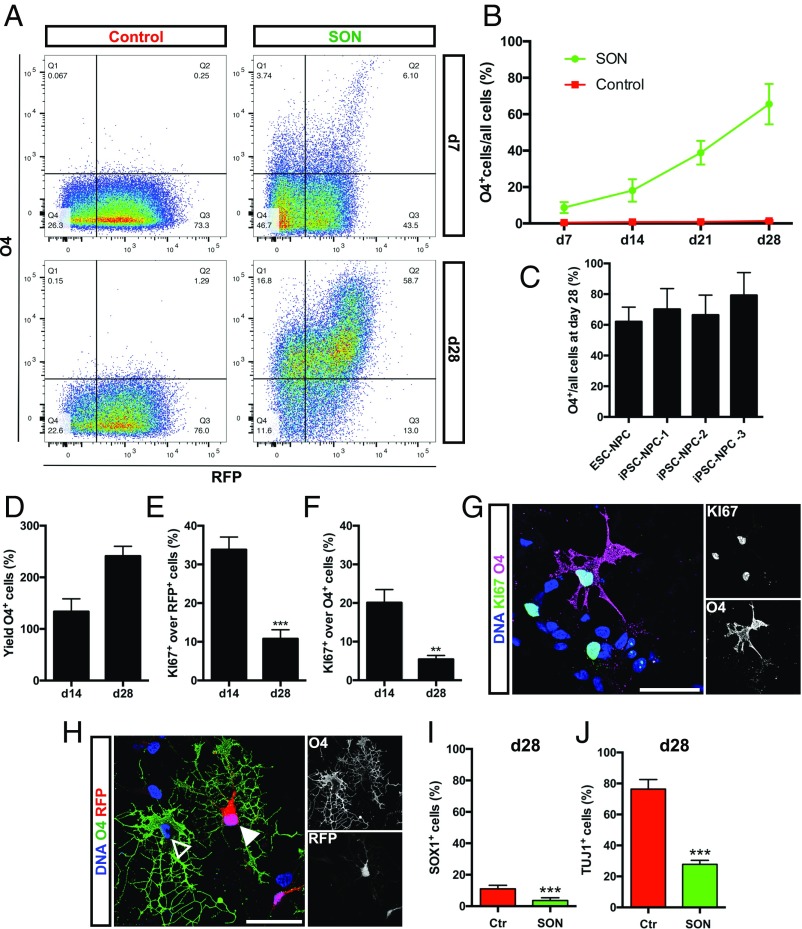
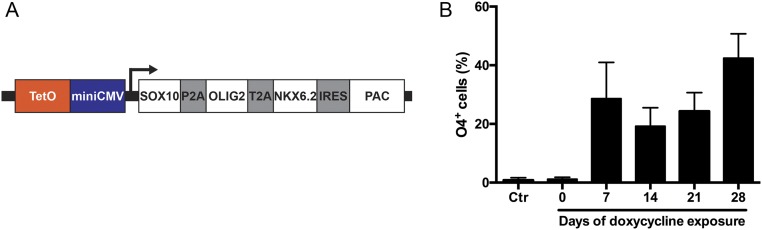
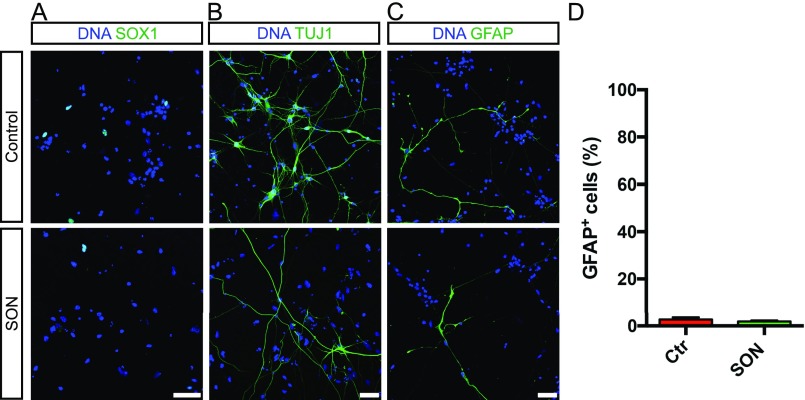
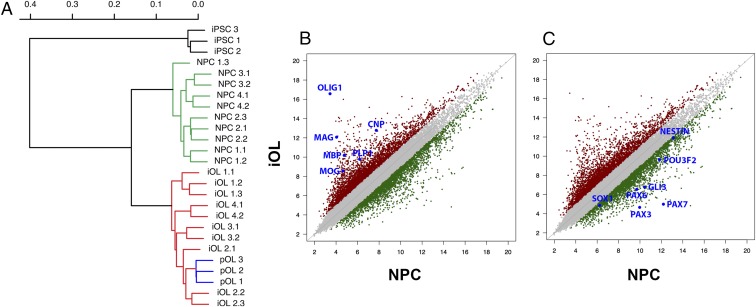
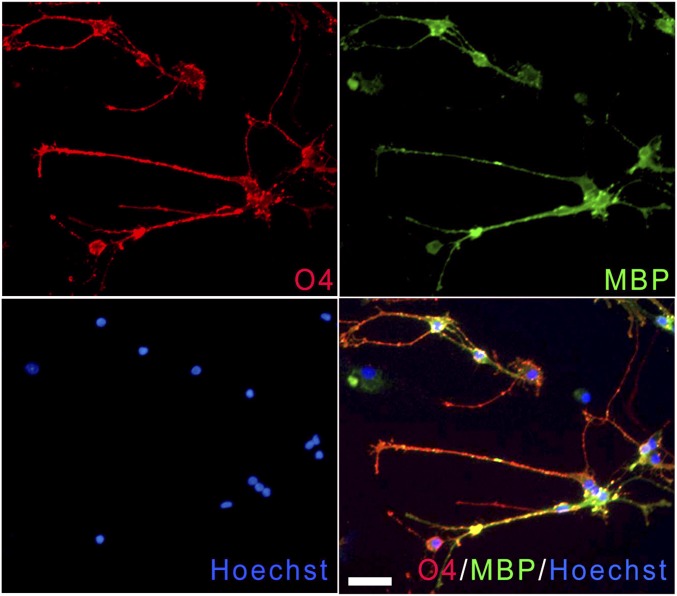
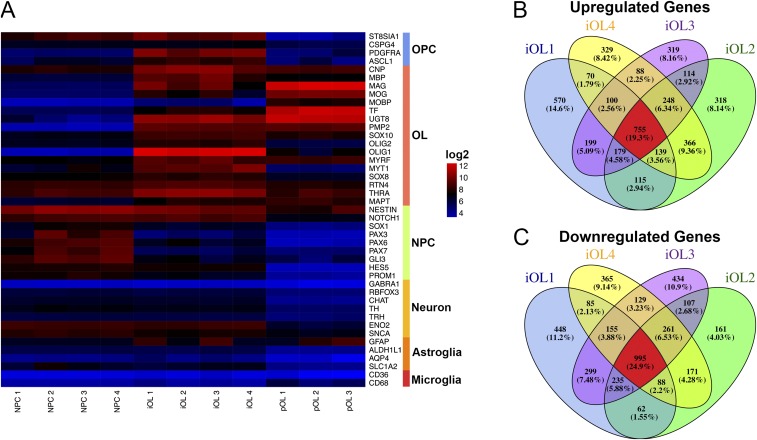
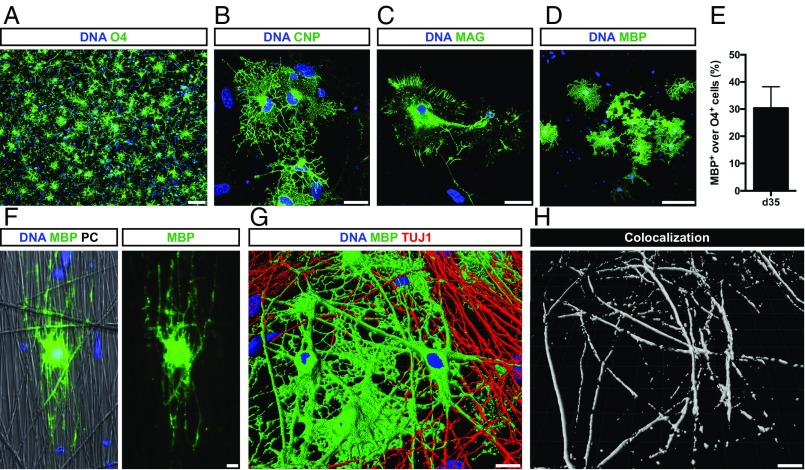
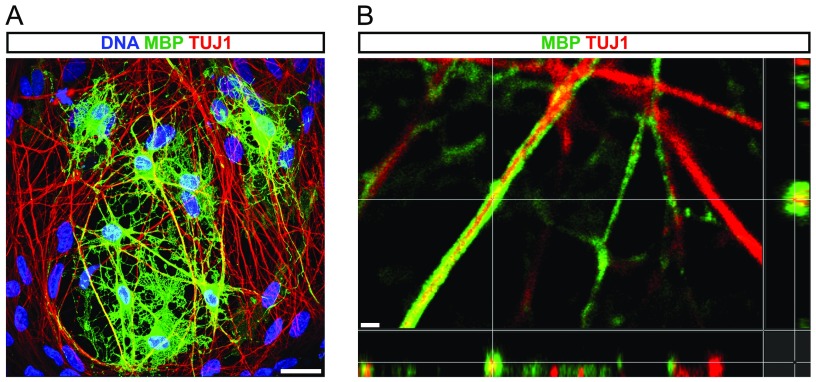
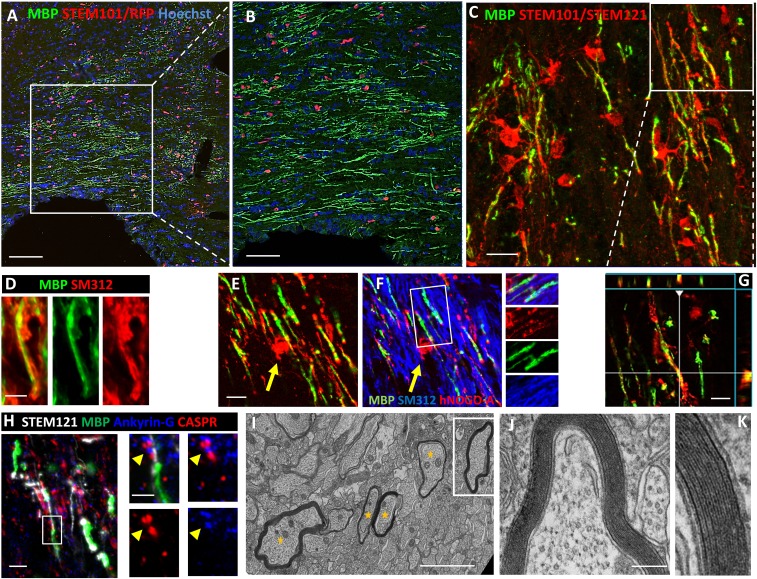
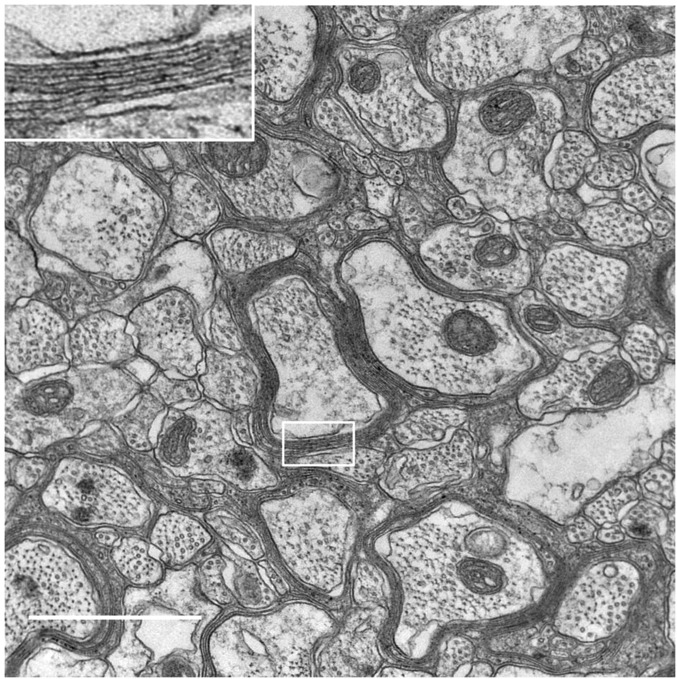
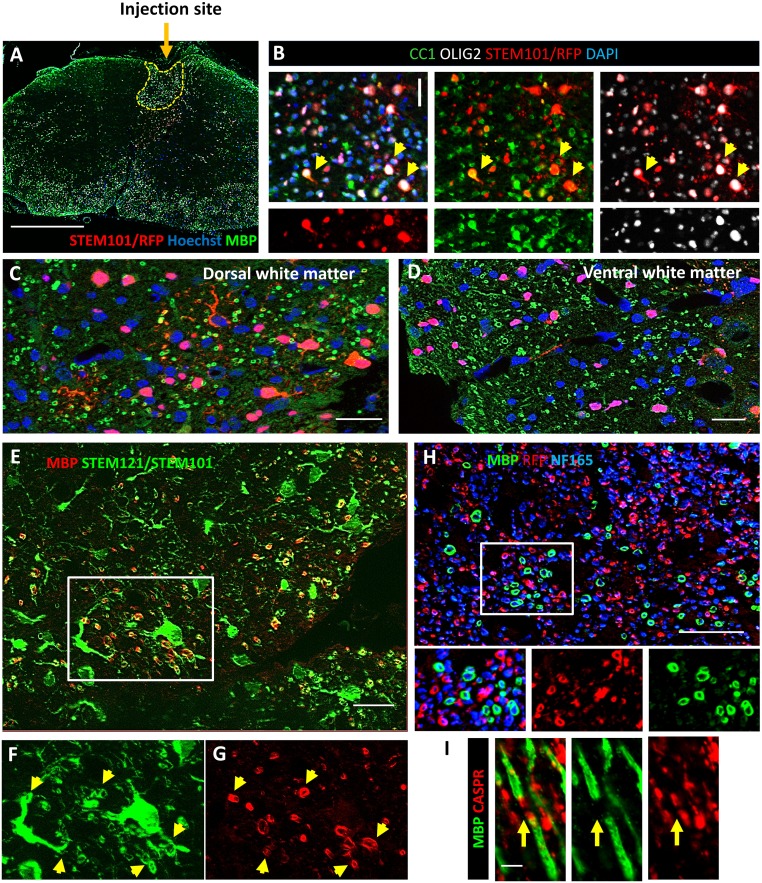
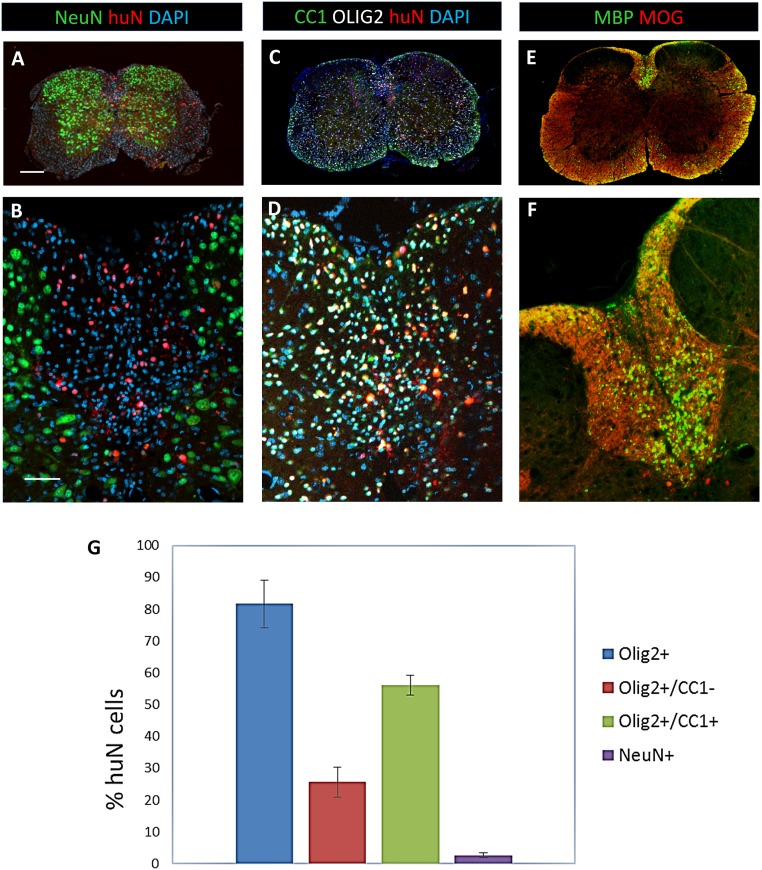
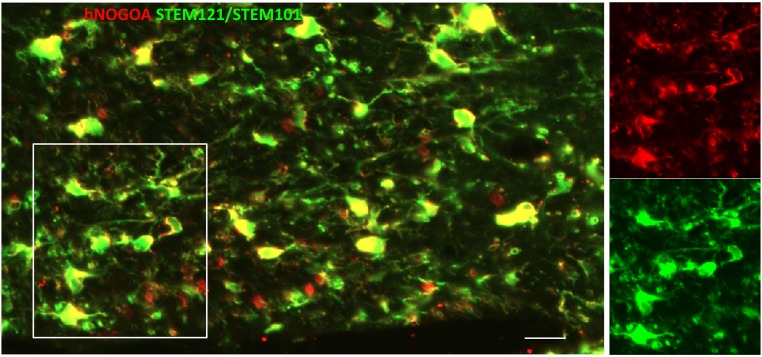
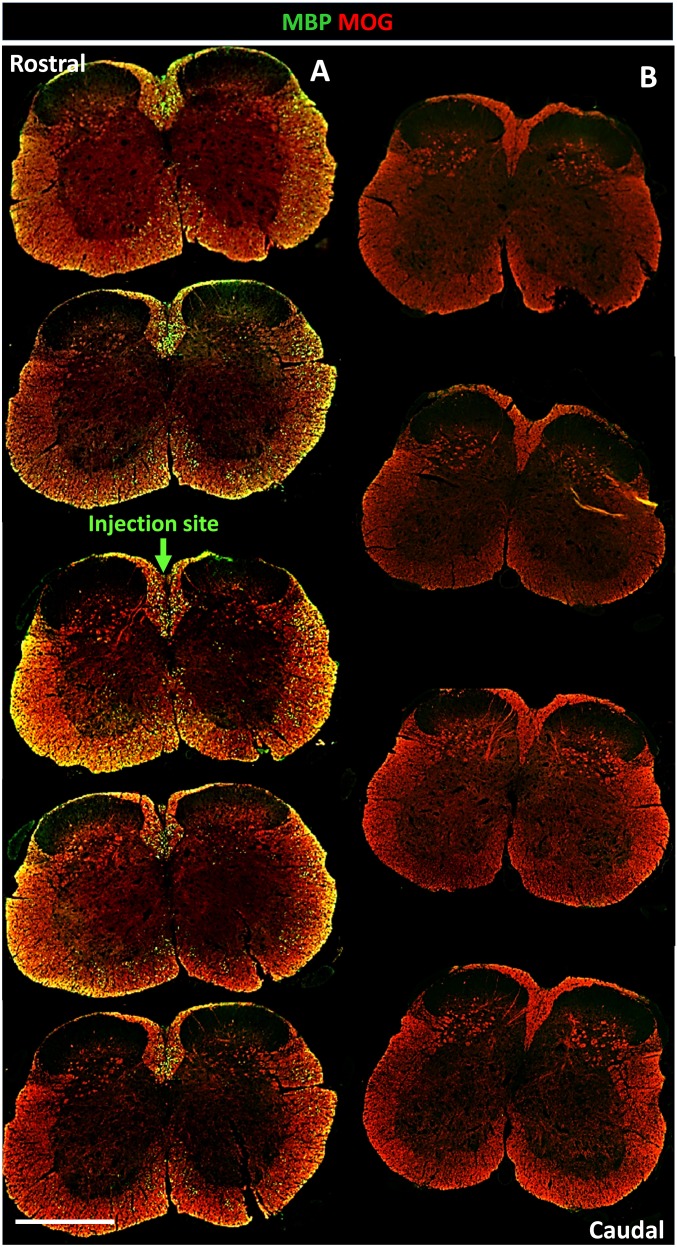
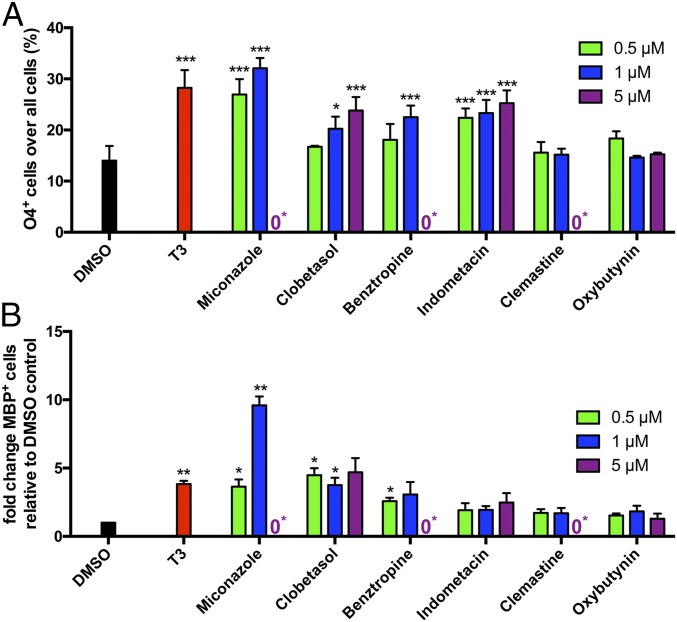
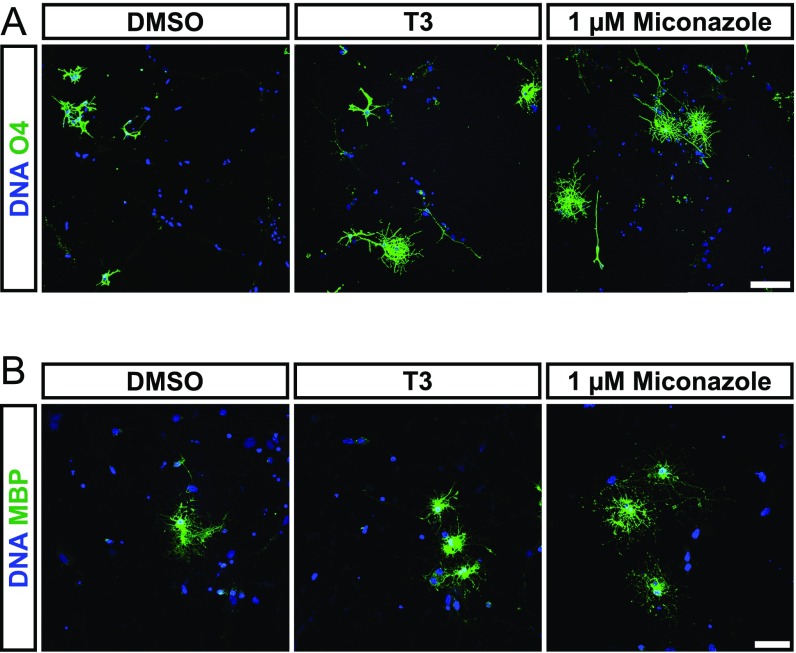
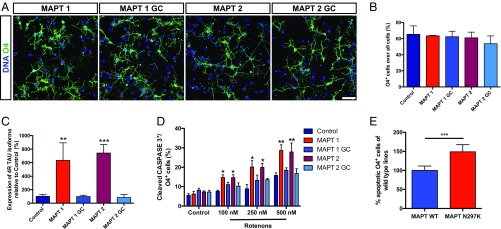
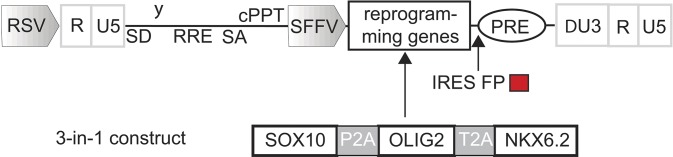
Rapid and efficient protocols to generate oligodendrocytes (OL) from human induced pluripotent stem cells (iPSC) are currently lacking, but may be a key technology to understand the biology of myelin diseases and to develop treatments for such disorders. Here, we demonstrate that the induction of three transcription factors (SOX10, OLIG2, NKX6.2) in iPSC-derived neural progenitor cells is sufficient to rapidly generate O4+ OL with an efficiency of up to 70% in 28 d and a global gene-expression profile comparable to primary human OL. We further demonstrate that iPSC-derived OL disperse and myelinate the CNS of Mbpshi/shiRag-/- mice during development and after demyelination, are suitable for in vitro myelination assays, disease modeling, and screening of pharmacological compounds potentially promoting oligodendroglial differentiation. Thus, the strategy presented here to generate OL from iPSC may facilitate the studying of human myelin diseases and the development of high-throughput screening platforms for drug discovery.

Keywords: disease modeling; forward patterning; human iPSC; myelination; oligodendrocytes.


Conflict of interest statement

Conflict of interest statement: M.E. and T.K. have a pending patent application for the oligodendroglial differentiation protocol.

Figures

Fig. 1.
Fig. 1.
Screening for oligodendroglial lineage inducing TF in human NPC. Human iPSC-derived NPC were infected with individual OL-specific TFs or RFP control virus. (A–F) OL-lineage commitment of infected iPSC-derived NPC was analyzed 14 d after transgene induction by immunostaining using the OL-specific antibody O4 (green). Nuclei were counterstained with Hoechst (blue). (A) Control cultures did not express the O4 epitope. (B) SOX10 was the only tested TF inducing O4+ OL. (C) Addition of OLIG2 enhanced the OL-lineage commitment, whereas (D) ASCL1 led to a decreased number of O4+ iOL. (E) Coexpression of SOX10, OLIG2, and NKX6.2 increased the number of O4+ cells, (F) accompanied by the appearance of iOL with a more mature oligodendroglial morphology. (Scale bars, 50 µm in A–E and 25 µm in F.) (G and H) Quantification of O4+ iOL over all cells with indicated TF combinations 2 wk after transgene induction. Data are presented as mean of replicates from three independent experiments + SD. One-way ANOVA with Bonferroni’s multiple comparisons test was used as statistical test (*P < 0.05, **P < 0.01, ***P < 0.001).
Fig. 2.
Fig. 2.
SON induce a rapid and efficient oligodendroglial lineage commitment. (A) Schematic presentation of the lentiviral expression vector used for the polycistronic expression of SON. (B) Schematic summary of the differentiation protocol using NPCM, GIM, and DM. (C–F) Representative immunofluorescence images of different NPC and OL markers during differentiation. Nuclei were counterstained with Hoechst (blue). (C) iPSC-derived NPC homogenously expressed the neural progenitor marker NESTIN (green) and SOX1 (red). (D) Seven days after transgene induction, NG2+ and O4+ oligodendroglial lineage cells were detected. (E) By day 28, iOL expressed the O4-epitope, the more mature OL marker GALC, and presented with a branched morphology. (F) Further maturation led to the emergence of MBP+ mature iOL forming myelin sheaths. (Scale bars, 50 µm.)
Fig. S1.
Fig. S1.
iOL develop increased numbers of primary and secondary processes during differentiation. To analyze morphological changes of O4+ iOL during differentiation, mean numbers of primary and secondary processes per cell body were quantified at day 7 and day 28 of differentiation. Mean numbers of primary and secondary processes significantly increased during differentiation, demonstrating a more complex morphology at day 28. Data are presented as mean of replicates from three independent differentiation experiments, each using an independent iPSC-derived NPC line + SD. Process numbers of at least 100 O4+ cells were quantified per differentiation. Student’s t test was performed for statistical analysis (**P < 0.01).
Fig. 3.
Fig. 3.
Quantification of oligodendroglial lineage cells after SON induction. (A) Representative flow cytometry analyses for the expression of O4 and RFP in control and SON cultures 7 and 28 d after transgene induction. (B) Quantification of O4+ cells in control and SON cultures 1 to 4r wk after transgene induction. Data are presented as mean of replicates from four independent experiments, each using NPC derived from an independent human PSC line + SD. (C) Quantification of O4+ iOL at day 28 derived from one human ESC and three independent iPSC lines. Data are presented as mean of replicates from three to five independent differentiation experiments per cell line + SD. (D) Quantification of O4+ iOL yields at days 14 and 28 after transduction. Data are presented as mean of replicates from three independent differentiation experiments, each using an independent iPSC-derived NPC line + SD. (E) Quantification of Ki-67+ transgene-expressing cells (RFP) and of (F) Ki-67+/O4+ iOL at days 14 and 28 after induction. Data are presented as mean of replicates from three independent differentiation experiments + SD (**P < 0.01, ***P < 0.001). (G) Immunostaining of iOL for O4 (purple) and the proliferation marker Ki-67 (green) at day 14 after transduction. (H) Representative immunofluorescence image of O4+ iOL (green) 28 d after transduction either expressing (filled arrowhead) or silencing (empty arrowhead) the transgenes. (Scale bars, 40 μm.) (I) Quantification of SOX1+ iPSC-derived NPC and (J) TUJ1+ neurons in control and SON cultures at day 28. Data are presented as mean of replicates from three independent differentiation experiments + SD. Student’s t test was performed for statistical analysis (***P < 0.001).
Fig. S2.
Fig. S2.
Impact of prolonged expansion of SON transduced NPC in GEM on oligodendroglial differentiation efficiencies and yields. SON-transduced NPC were expanded in GEM for either 4 (blue), 8 (green), or 12 d (red) and subsequently transferred to DM for an additional 28 d. FACS analyses at days 0, 14, and 28 of differentiation revealed a trend to decreased differentiation efficiency after 12 d of expansion (red curve) (A), whereas yields of O4+ cells (red columns) were significantly increased (B). Data are presented as mean of replicates from three independent experiments, each using an independent iPSC-derived NPC line + SD. Two-way ANOVA with Tukey’s multiple comparisons test was performed for statistical analysis (**P < 0.01, ***P < 0.001).
Fig. S3.
Fig. S3.
Analysis of iOL transgene dependency using a tet-inducible lentiviral expression construct. (A) Tet-inducible SON was generated by cloning a polycistronic SON cassette into pHAGE, a third-generation lentiviral expression vector. An IRES-PAC cassette was introduced following the SON expression cassette allowing optional puromycin selection. (B) NPC were cotransduced with lentiviruses expressing tet-inducible SON and lentiviruses expressing rtTA. Expression of SON was induced by doxycycline for different time periods including 0 d as a negative control and 28 d as a positive control. Oligodendroglial lineage commitment was assessed by FACS analyses at day 28. Transduced NPC populations without doxycycline exposure (0) demonstrated comparable differentiation efficiencies as nontransduced NPC populations (Ctr), confirming the tight control of SON expression. Constitutive expression of SON (28 d) resulted in an increased differentiation efficiency compared with transient SON expression (7, 14, 21 d), indicating that a subpopulation of O4+ iOL was dependent on the ectopic expression of SON.
Fig. S4.
Fig. S4.
ICC analysis of the lineage commitment of SON-transduced and control NPC at day 28. The neural lineage commitment of control and SON-transduced NPC was assessed by SOX1 (A), TUJ1 (B), and GFAP (C) immunostaining at differentiation day 28. (Scale bars, 50 µm.) (D) Quantification of GFAP+ cells revealed no differences in the differentiation efficiencies in control and SON-transduced NPC populations. Data are presented as mean of replicates from three independent differentiation experiments + SD. Student’s t test was performed for statistical analysis.
Fig. 4.
Fig. 4.
Global transcriptional profiling of iOL. (A) Hierarchical clustering of whole-genome expression profiles of iPSC (black), iPSC-derived NPC (green), iOL (28 d after transduction) (red), and human adult OL pOL (blue) revealed a strong correlation between iOL and pOL. (B and C) Pairwise scatterplot analysis of log2-adjusted global gene-expression values of iPSC-derived NPC and their corresponding iOL (n = 10). Genes presenting with a <twofold difference in gene expression are illustrated in gray. (B) Characteristic OL-enriched genes were up-regulated in iOL, whereas (C) characteristic NPC-enriched genes were down-regulated.
Fig. S5.
Fig. S5.
ICC analysis of pOL used for whole-genome expression analysis. Representative immunofluorescence image of pOL obtained from adults undergoing surgical resections as treatment for nontumor-related intractable epilepsy after 6 d in vitro. The vast majority of cells were O4+ (red) and MBP+ (green). Nuclei were counterstained with Hoechst (blue). (Scale bar, 50 µm.)
Fig. S6.
Fig. S6.
Global transcriptional profiling of iOL. (A) Heatmap illustrating gene expression for cell-type–enriched genes comparing iPSC-derived NPC, iOL and pOL. Each biological replicate of NPC and iOL presents the mean of two to three independent experiments. (B and C) Venn diagram showing the overlap of genes significantly up-regulated (B) or down-regulated (C) in four biological independent iOL cell lines compared with their corresponding iPSC-derived NPC population. Each iOL cell line presents the mean of replicates from two to three independent experiments.
Fig. 5.
Fig. 5.
iOL differentiate into mature OL and ensheath iPSC-derived neurons in vitro. (A) Thirty-five days after transgene induction, O4+ iOL presented a branched morphology typical for mature OL and (B–D) expressed the mature oligodendroglial markers CNP, MAG, and MBP. (E) Quantification of mature MBP+ iOL over all O4+ iOL. Data are presented as mean of replicates from four independent differentiation experiments + SD. (F) Immunostaining of iOL 14 d after replating on 3D nanofiber scaffolds illustrating the formation of myelin sheaths around nanofibers. Nuclei are counterstained with Hoechst. (G and H) Human in vitro myelination assay: coculture of O4+ iOL purified at day 21 by MACS with iPSC-derived neurons for 3 wk. (G) Three-dimensional reconstruction of confocal images for MBP (green) and the neuronal marker TUJ1 (red), suggesting wrapping of axons. Nuclei were counterstained with Hoechst (blue). (H) Three-dimensional illustration of MBP and TUJ1 colocalization (white) from the same detail. [Scale bars, 100 µm (A), 20 µm (B and C), 50 µm (D), and 10 µm (F and H).]
Fig. S7.
Fig. S7.
Confocal analysis of in vitro myelination assays. (A) Confocal immunofluorescence image of iOL cocultured with iPSC-derived neurons for 21 d. The image illustrates the colocalization of MBP (green) with neuronal processes visualized by TUJ1 (red). Nuclei were counterstained with Hoechst. No MBP expression was detectable in control cultures. (B) Orthogonal projection illustrates the formation of MBP+ (green) sheaths around TUJ1+ (red) neuronal processes. (Scale bars, 25 µm in A and 1 µm in B.)
Fig. 6.
Fig. 6.
iOL give rise to functional myelin following engraftment in brains of newborn mice. (A) Transplantation of iOL into the corpus callosum of newborn Shi/Shi Rag2−/− mice resulted in extensive generation of MBP+ myelin (green) by human cells expressing RFP and staining positive for the human nuclei marker STEM101 (red) 16 wpg. (B) Higher magnification of the boxed area in A. (C) Human OL revealed by combined human nuclei STEM101 and cytoplasmic STEM121 (red) markers send multiple processes connected with MBP+ myelin. Orthogonal view of the boxed area illustrating the colocaliziation of cytoplasmic STEM121 with MBP is depicted in G. (D) Colabeling of MBP (green) and axonal neurofilament (SM312, red), highlights wrapping of host axons by donor-derived myelin. (E and F) Mature human NOGO-A+ oligodendrocyte (red, yellow arrow) connected to MBP+ myelin (green) wrapped around host axons (blue). The small panels in F illustrate the merged and single fluorochromes images represented in the boxed area. Note that unlike MBP, NOGO-A is expressed in the cell cytoplasm (cell body, processes, and paranodal loops) but not in compact myelin. (H) Human-derived (STEM121+, white)/MBP+ myelin (green) integrate into axo-glial elements expressing Ankyrin-G nodal protein (blue, yellow arrow) and CASPR paranodal proteins (red). The boxed area is enlarged to illustrate a typical node defined by a STEM121+ grafted cell and its MBP+ myelin internode, with Ankyrin-G+ aggregate flanked by two CASPR+ domains. (I–K) EM images demonstrate that human-derived myelin undergoes final maturation via compaction and formation of the major dense line. Axons surrounded by compact myelin are indicated by yellow stars. J and K are higher magnifications of boxed axon in I. n = 4 for immunostaining, n = 3 for EM. [Scale bars, 100 µm (A), 50 µm (B), 20 µm (C), 5 µm (D), 10 µm (E and F), 5 µm (H), 2 µm (I), and 200 nm (J).]
Fig. S8.
Fig. S8.
EM analysis of the corpus callosum of nongrafted shiverer mice. In the corpus callosum of adult shiverer mice, 73% of myelin-competent axons (>1 µm diameter) are ensheathed by thin and noncompacted myelin. Inset shows a 3.5-fold higher magnification of noncompacted myelin. (Scale bar, 1 µm.)
Fig. S9.
Fig. S9.
Functional differentiation of iOL into bona fide mature re/myelinating OL following transplantation in adult demyelinated mice. (A) Coronal section illustrating widespread distribution of iOL (red) derived MBP+ myelin (green) after engraftment into the dorsal funiculus (highlighted by dotted line) of the adult demyelinated Shi/Shi Rag2−/− spinal cord 12 wpg. (C and D) Higher magnification illustrating that grafted RFP+/ STEM101+ (red) human cells not only remyelinated the lesion site (C) by producing high amounts of MPB+ myelin (green), but also myelinated axons throughout the spinal cord white and gray matters, including the ventral column (D). (B) The majority of RFP+/ STEM101+ (red) human cells found in the dorsal funiculus of adult mice were CC1+ (green)/OLIG2+ (white) mature OL (yellow arrowheads highlight some of them). (E–G) Colabeling for human cytoplasmic/human nuclei (STEM121/STEM101 in green) revealed that many human cells (E and G) were connected to multiple MBP+ donut-shaped myelin-like structures (red, E and F) indicated by yellow arrowheads in F and G. (H) MBP+ myelin sheaths (green) surrounding NF165+ host axons (blue) in the dorsal funiculus. It also shows that in demyelinated spinal cord many axons are wrapped by human cells (RFP+) not yet expressing MBP, indicating a prospective larger remyelination potential of the grafted iOL. The boxed area is illustrated at higher magnification in the small panels below. (I) Longitudinal view of functional human-derived MBP+ myelin (green) integrated into nodes of Ranvier revealed by paranodal marker CASPR (red) in adult spinal cord. n = 4 mice for all staining. (Scale bars, 200 µm in A, 20 µm in B–H, and 5 µm in I.)
Fig. S10.
Fig. S10.
The majority of human cells grafted in dorsal funiculus were mature OL. (A and B) Illustration that most of huNuclei+ grafted cells (red) were negative for the neuronal marker NeuN. (C and D) The majority of the huNuclei+ grafted cells differentiated into CC1+/Olig2+ mature OL. Nuclei are stained by Dapi in A–D. (E and F) Donor-derived MOG+/MBP+ myelin (green) integrated among MOG+/MBP endogenous myelin (red) in the demyelinated dorsal funiculus. (G) Percentage of the different cell types generated by the huNuclei+ grafted cells. n = 3 mice. (Scale bars, 200 µm in A, C, and E and 50 µm in B, D, and F.) B, D, and F are higher magnifications of dorsal funiculus of A, C, and E.
Fig. S11.
Fig. S11.
Human iOL grafted in dorsal funiculus expressed human-specific mature oligodendrocyte marker NOGO-A. Triple-labeling of the human cells with human antinuclei STEM101, anticytoplasmic STEM 121, and anti-human NOGO-A revealed that most of the grafted cells expressed mature oligodendroglial marker NOGO-A (red). Note that unlike MBP, NOGO-A is expressed in the cell cytoplasm (cell body, processes, and paranodal loops) but not in compact myelin. Merged image in boxed area is detailed in small panels as NOGO-A (Upper) and STEM121/STEM101 (Lower). n = 3 mice. (Scale bar, 20 µm.)
Fig. S12.
Fig. S12.
Human myelin disperses widely and integrates very well among endogenous myelin in adult mice. (A) Serial coronal sections of the grafted adult Shi/Shi Rag2−/− mouse spinal cord stained for MOG (red) and MBP (green) reveal MOG+/MBP endogenous and MOG+/MBP+ exogenous myelin, respectively, and illustrates the widespread distribution of human-derived MBP+ myelin along the rostro-caudal axis (between 10 and 22 mm in length) 12 wpg. (B) Illustration of more caudal sections expressing MOG only (internal negative controls). n = 3 mice. (Scale bar, 1,000 µm.)
Fig. 7.
Fig. 7.
iOL are suitable to test the differentiation promoting effects of selected compounds. Quantification of (A) O4+ and (B) MBP+ iOL after treatment with either vehicle, T3, or the drug candidate dissolved in DMSO at three different concentrations (0.5, 1, 5 µM) for 21 d in minimum DM. Data are presented as mean of replicates from three independent experiments + SD. One-way ANOVA with Dunnett’s multiple-comparisons test was performed for statistical analysis comparing the mean of each sample with DMSO control (*P < 0.05, **P < 0.01, ***P < 0.001). 0* = Toxic culture condition.
Fig. S13.
Fig. S13.
ICC analysis of iOL in DM containing selected compounds. (A and B) Representative immunofluorescence images of iOL cultures treated with either vehicle [0.01% (vol/vol) DMSO], T3 as a positive control, or 1 µM of the drug candidate miconazole for 21 d in minimum DM. Oligodendroglial lineage commitment was assessed by (A) O4 (green) and (B) MBP (green) immunostaining; nuclei were counterstained with Hoechst (blue). (Scale bars, 50 µm.)
Fig. 8.
Fig. 8.
MAPT-OL exhibit mutation related phenotypes. (A) Immunostaining for O4 (green) demonstrating differentiation of iPSC carrying the N279K MAPT mutation (MAPT1, MAPT2) and genetic corrected controls (MAPT1 GC, MAPT2 GC) into iOL. Nuclei were counterstained with Hoechst (blue). (Scale bar, 25 µm.) (B) Flow cytometry-based quantification of O4+ iOL after 28 d of differentiation in MAPT mutation cultures, genetic corrected cultures, and an independent healthy control culture. Data are presented as mean of replicates from three independent experiments + SD. (C) Quantitative RT-PCR analysis on control, MAPT gene-corrected, and MAPT mutated iOL cultures for 4R tau isoforms containing exon 10. Expression levels were normalized to total tau expression and control lines. Data are presented as mean of replicates from three independent experiments + SD. One-way ANOVA with post hoc Tukey test was performed for statistical analyses (**P < 0.01, ***P < 0.001). (D) Quantification of cleaved CASPASE 3+ iOL in control and MAPT cultures after 48 h of either vehicle [0.01% (vol/vol) DMSO] or rotenone treatment. Data are presented as mean of replicates from three independent experiments + SD. One-way ANOVA with post hoc Tukey test was performed for statistical analysis (*P < 0.05, **P < 0.01). (E) All results combined after normalization by setting all control cultures to 100%, show that MAPT N279K causes a higher sensitivity to oxidative stress. Error bars present SD. Student’s t test was performed for statistical analysis (***P < 0.001).
Fig. S14.
Fig. S14.
Schematic presentation of the polycistronic all-in-one SON lentiviral vector. The human cDNAs encoding SOX10, OLIG2, and NKX6.2 were linked by 2A self-cleavage sites and were inserted into a third-generation lentiviral expression vector equipped with the retroviral SFFV U3 promoter. For the visualization of transgene expression, an IRES-dTomato cassette was introduced following the SON expression cassette.

References

    1. Najm FJ, et al. Drug-based modulation of endogenous stem cells promotes functional remyelination in vivo. Nature. 2015;522(7555):216–220. - PMC - PubMed
    1. Yang N, et al. Generation of oligodendroglial cells by direct lineage conversion. Nat Biotechnol. 2013;31(5):434–439. - PMC - PubMed
    1. Goldman SA, Nedergaard M, Windrem MS. Glial progenitor cell-based treatment and modeling of neurological disease. Science. 2012;338(6106):491–495. - PMC - PubMed
    1. Franklin RJ, ffrench-Constant C, Edgar JM, Smith KJ. Neuroprotection and repair in multiple sclerosis. Nat Rev Neurol. 2012;8(11):624–634. - PubMed
    1. Sreedharan J, Brown RH., Jr Amyotrophic lateral sclerosis: Problems and prospects. Ann Neurol. 2013;74(3):309–316. - PubMed

Publication types

MeSH terms