. 2017 Mar 14;114(11):2934-2939.
doi: 10.1073/pnas.1700600114. Epub 2017 Feb 28.

Metabolic origins of spatial organization in the tumor microenvironment

Affiliations

Metabolic origins of spatial organization in the tumor microenvironment

Carlos Carmona-Fontaine et al. Proc Natl Acad Sci U S A. .

Abstract

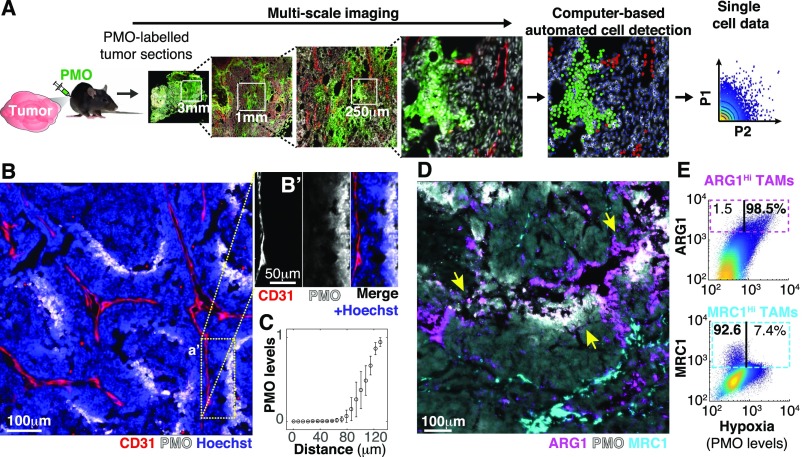
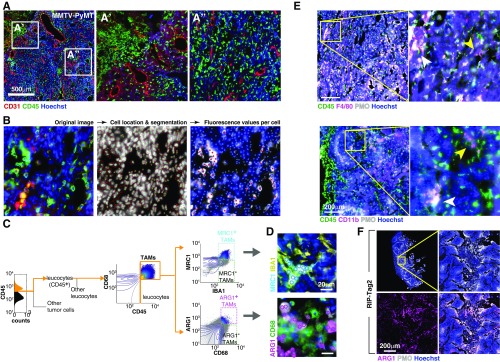
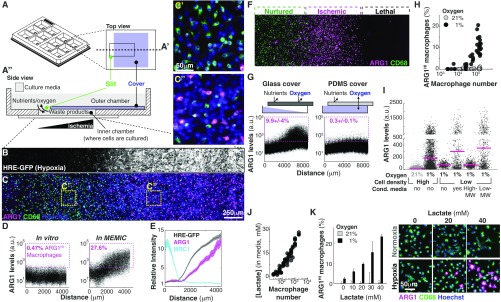
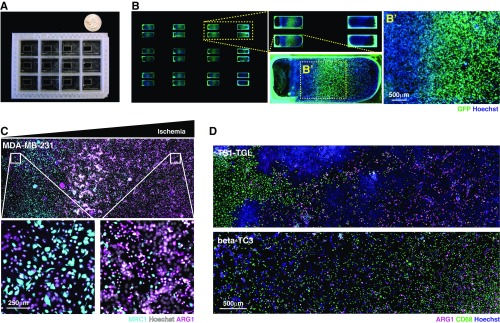
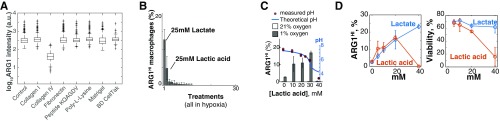
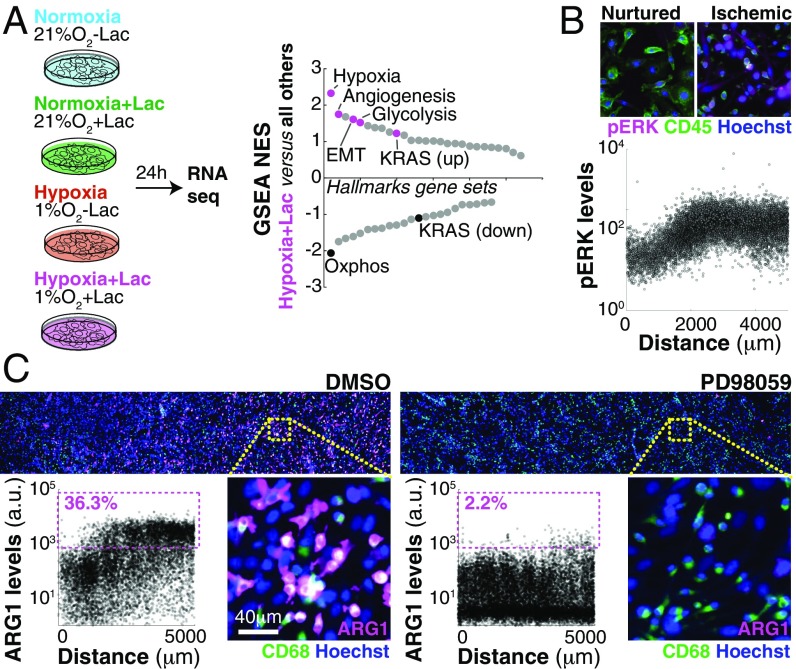
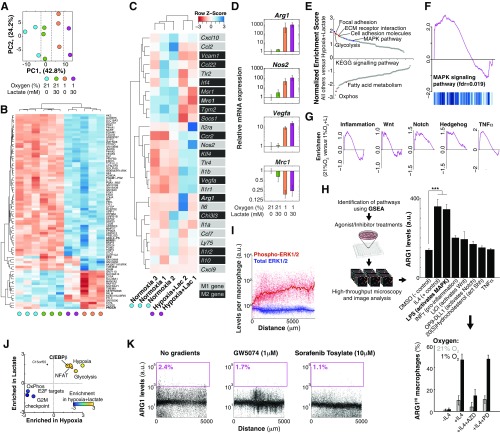
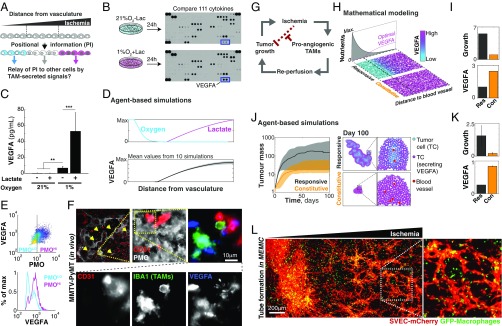
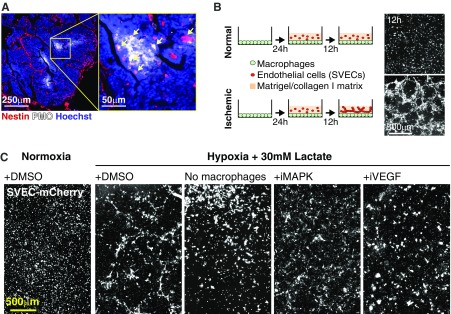
The genetic and phenotypic diversity of cells within tumors is a major obstacle for cancer treatment. Because of the stochastic nature of genetic alterations, this intratumoral heterogeneity is often viewed as chaotic. Here we show that the altered metabolism of cancer cells creates predictable gradients of extracellular metabolites that orchestrate the phenotypic diversity of cells in the tumor microenvironment. Combining experiments and mathematical modeling, we show that metabolites consumed and secreted within the tumor microenvironment induce tumor-associated macrophages (TAMs) to differentiate into distinct subpopulations according to local levels of ischemia and their position relative to the vasculature. TAMs integrate levels of hypoxia and lactate into progressive activation of MAPK signaling that induce predictable spatial patterns of gene expression, such as stripes of macrophages expressing arginase 1 (ARG1) and mannose receptor, C type 1 (MRC1). These phenotypic changes are functionally relevant as ischemic macrophages triggered tube-like morphogenesis in neighboring endothelial cells that could restore blood perfusion in nutrient-deprived regions where angiogenic resources are most needed. We propose that gradients of extracellular metabolites act as tumor morphogens that impose order within the microenvironment, much like signaling molecules convey positional information to organize embryonic tissues. Unearthing embryology-like processes in tumors may allow us to control organ-like tumor features such as tissue repair and revascularization and treat intratumoral heterogeneity.

Keywords: cancer metabolism; morphogens; positional information; tumor microenvironment; tumor-associated macrophages.


Conflict of interest statement

Conflict of interest statement: C.B.T. is a founder of Agios Pharmaceuticals and a member of its scientific advisory board. He also serves on the board of directors of Merck and Charles River Laboratories.

Figures

Fig. 1.
Fig. 1.
Spatial diversity in TAM phenotypes correlates with metabolic gradients within tumors. (A) Experimental approach to study metabolic and cellular intratumoral heterogeneity. PMO (a hypoxia marker) was injected into tumor-bearing mice to label hypoxic tumor regions. Tumor cryosections were then imaged at high magnification (typically at 200×), achieving multiscale images. This enabled image processing to obtain single-cell features for hundreds of thousands of cells per section while maintaining their spatial information. (B and C) The spatial distribution of hypoxia mirrored the structure of the tumor vasculature from a distance. (B) Cryosections of MMTV-PyMT tumors were stained with antibodies against endothelial vascular cells (CD31) and hypoxic regions (PMO). (B′) Image channels were split in a selected field of interest to reveal the correlation between hypoxia and distance from the vessel. This was quantified in C (bars indicate SD, n = 6). (D and E) Phenotypic diversity of TAMs correlates with the topology of the vascular system. (D) Similar tissue sections were stained with antibodies against TAM markers (MRC1 and ARG1) and PMO (colocalization of ARG1 and PMO indicated by yellow arrows). (E) Image quantification of >105 individual cells within tumor sections showed that ARG1 levels in TAMs were correlated with hypoxic regions (r = 0.6, P<106) whereas MRC1-expressing TAMs were inversely correlated with local hypoxic levels (r = -0.2, P<106). Three sections of three tumors extracted from different animals were analyzed for each marker.
Fig. S1.
Fig. S1.
Image-based analysis of cellular diversity in the tumor microenvironment. (A) Tumor cryosection (MMTV-PyMT, breast) showing the diversity in the distribution of white blood cells with respect to different tumor regions. (B) By imaging an array of adjacent fields at high magnification (200×) we achieved multiscale images where we could measure individual cell features for hundreds of thousands of cells per section. Here we show an example of the image analysis procedure. More details are in SI Materials and Methods. (C) Image analysis-based gating algorithm used to digitally isolate MRC1HI and ARG1HI TAM subpopulations. (D) Representative images showing MRC1HI (Upper) and ARG1HI (Lower) TAMs. Cyan and magenta circles are located where the computer detected MRC1HI and ARG1HI TAMs, respectively. (E) TAM markers such as CD11b F4/80 were widely distributed and could be found in hypoxic (white arrowhead) and nonhypoxic (yellow arrowhead) tumor regions. (F) Spatial patterns of ARG1 expression correlated with local hypoxia in a pancreatic tumor model (RIP-Tag2). Images in A, B, and D–F are composites of multiple adjacent pictures.
Fig. 2.
Fig. 2.
Extracellular metabolic gradients are necessary and sufficient to produce striped expression domains and spatial patterning of macrophages. (A) Schematic representation of the MEMIC chamber fabricated with 3D printing. This 12-well format contains an independent MEMIC replicate in each well. (A′) Top view of one of those wells. (A′′) Detailed side view of a MEMIC where cells are cultured in a small chamber that connects to a large volume of fresh media through a slit. Cell activities such as nutrient consumption and waste product secretion change the local nutrient composition within the small chamber and generate spatial gradients; diffusion via the slit allows a constant exchange with the fresh media reservoir. Thus, cells proximal to this slit remain well nurtured, whereas distal cells become progressively more ischemic. (B and C) Coculture of macrophages and a cancer cell line engineered to express GFP under hypoxia (C6-HRE-GFP). (B) GFP hypoxia at 24 h reveals a spatial gradient. (C) In the same culture, spatial patterns of ARG1 in macrophages mirrored hypoxia gradients (compare Insets C′ and C′′). (D) Image analysis at the single-cell level of macrophages cocultured with C6-HRE-GFP glioma cells in a conventional in vitro system (without metabolite gradients, Left) or in the MEMIC (Right). ARG1HI macrophages are defined as expressing levels fivefold higher than the median. (E) ARG1 levels increased with hypoxia whereas MRC1 levels decreased with hypoxia. (F–H) Hypoxia was necessary but not sufficient to trigger ARG1 expression. (F) Cancer cells were not required for the emergence of phenotypic patterns as macrophages cultured in the MEMIC alone displayed stripes of ARG1 expression in sublethal levels of ischemia. (G) Spatial patterns of ARG1 expression in macrophage monocultures (Left). This effect required hypoxia as it disappeared when O2 concentration was restored to environmental levels using a polydimethylsiloxane (PDMS) membrane (Right) that is permeable to gases. (H) Hypoxia can induce the expression of ARG1 but only in high-density cultures, showing that it is necessary but not sufficient. (I) Low molecular weight fraction of conditioned media collected from macrophages cultured under hypoxia can trigger ARG1 expression in sparse macrophage cultures. Conditioned media were fractioned according to molecular weight (MW) with a 3-kDa cutoff. Note change of scale in y axis. (J) Lactate, which accumulated in the cell culture media of hypoxic macrophages, increases with macrophage density (24 h culture at 1% O2). (K) Lactate showed a dose-dependent synergy in inducing ARG1 levels with low O2. Lactate doses were chosen to cover the range between no lactate and high lactate doses typically used to study cellular response to this molecule (21, 22, 48). Bars indicate SD from three biological replicates. Images are representative of selected lactate doses.
Fig. S2.
Fig. S2.
Design of the MEMIC and effect of metabolites in the patterning of macrophages. (A) Photograph of the MEMIC. A quarter of a US dollar was placed as a scale bar. (B) Multiscale imaging of the entire MEMIC, zooming into one of the chambers. (C) Reverse spatial patterns of ARG1 and MRC1 expression in macrophages cocultured with human breast tumor cells (MDA-MB-231). (D) Spatial patterns of ARG1 expression emerged in macrophages, regardless of which cancer line they were cocultured with, including cells derived from our murine tumor models, TS1-TGL (from MMTV-PyMT) and β-TC3 (from RIP-Tag2). Images in B–D are composites of multiple adjacent pictures.
Fig. S3.
Fig. S3.
A combination of oxygen and lactate was necessary and sufficient to trigger striped patterns of ARG1 expression. (A) Cell culture plates were coated with the molecules shown in the x axis and then macrophages were seeded and cultured in hypoxia for 24 h. The combination of hypoxia and stimulation of cell adhesion molecules that could mediate the sensing of cell density did not increase ARG1 levels in sparse macrophage cultures relative to control. (B) Macrophages were cultured in hypoxia for 24 h in DMEM, supplemented with (or lacking) nutrients according to Table S1. Lactate and lactic acid produced a significant increase in ARG1 levels in sparse macrophage cultures. (C) Lactic acid had the same effect on hypoxic macrophages as lactate. However, at high concentrations (>30 mM) the effect of lactic acid disappeared. This coincided with the point at which the buffering capacity of the media is predicted to be broken. (D) We have published that at high lactic acid concentrations (low pH; ref. 21), macrophages lose their viability. Consistently, high concentrations of lactic acid did not trigger ARG1 expression but lead to macrophage death. In B–D, error bars correspond to SD from three biological replicates.
Fig. 3.
Fig. 3.
Macrophages respond to gradients of extracellular metabolites, using MAPK signaling. (A) RNA-seq revealed transcriptional changes of macrophages cultured under different levels of metabolites. GSEA suggested a strong enrichment of the KRAS/MAPK pathway. (B) KRAS signals via the MAPK pathway and macrophages cultured in the MEMIC showed spatial patterns of MAPK activation (ERK1/2 phosphorylation) correlated with ischemia. (C) Representative images and single-cell–level quantification showing that MAPK inhibition abrogates macrophage spatial patterns in the MEMIC.
Fig. S4.
Fig. S4.
Oxygen and lactate trigger a genome-wide response driven by MAPK. (A–C) Transcriptional response of macrophages treated with different levels of lactate and/or oxygen. (A) Principal component analysis (PCA) of RNA-seq data showed that different treatments are the main source of variability in gene expression. (B) Supervised hierarchical clustering of significantly changed genes. (C) Levels of genes typically used to distinguish M1 from M2 macrophages. Note that M1/M2 genes did not cluster well with the metabolic treatments. (D) Validation of RNA-seq data for selected markers from C, using qPCR. (E) Normalized enrichment scores of GSEA analysis. (F) GSEA plot showing enrichment for MAPK. (G) GSEA plots showing enrichment for other pathways significantly enriched by lactate and hypoxia treatment. (H) Pharmacological screening. Hypoxic macrophages were treated with chemical agonists for the pathways shown in G. IL4 treatment was used as a positive control. LPS treatment significantly increased ARG1 levels in hypoxic macrophages (P < 0.001) and this effect was inhibited by the MEK inhibitor PD98059, showing that its effect is via MAPK. IL4 signals via the Jak/Stat pathway as its effect was inhibited by AZD1480 (AZD) but not by PD98059 (PD). Error bars correspond to SD from three biological replicates. (I) Image analysis showing constant levels of total ERK1/2 but increasing levels of phospho-ERK1/2 in the MEMIC. (J) Quantification of hypoxia and lactate synergy. x axis, effect of hypoxia; y axis, effect of lactate; z axis (color), effect of both. (K) c-Raf antagonists GW5074 and the FDA-approved Sorafenib Tosylate inhibited the patterned expression of ARG1, showing that lactate and oxygen are integrated upstream of c-Raf.
Fig. 4.
Fig. 4.
Macrophages relay their positional information to endothelial cells and orchestrate efficient tube morphogenesis. (A) Our data suggest that, in a process resembling embryological organization, gradients of extracellular metabolites convey positional information that modifies TAM phenotypes. We asked whether additional signaling molecules, secreted by patterned macrophages, could relay positional information to other tumor cells. (B) Screening of 111 secreted chemokines revealed that ischemic macrophages express VEGFA. (C) Quantification of secreted chemokines confirmed this finding and the synergy between lactate and hypoxia (bars indicate SD from six biological replicates; **P < 0.01, ***P < 0.001). (D) Mathematical modeling predicted spatial patterns of VEGFA levels. (E) Quantification in a representative PyMT-MMTV tumor section showing that ischemic TAMs express higher VEGFA levels. (F) Images showing small groups of endothelial cells in hypoxic regions (yellow arrows). One of these regions was magnified to show that these endothelial cells are adjacent to VEGFA-expressing TAMs. For clarity, F, Lower shows isolated channels. (G) Our data suggest that whereas tumor growth leads to ischemic regions, the response of the stroma is to revascularize these regions, thus allowing tumor growth to resume. (H and I) Analytical solution of our theoretical model showed that a proangiogenic strategy that responds to ischemia (Res, responsive) led to faster-growing and larger tumors than homogeneous (Con, constitutive) angiogenesis. (H) Spatial patterns of predicted levels of VEGFA secretion for responsive and constitutive strategies. (I) Growth rates and cost of secreting VEGFA for the two strategies. (J and K) Simulation results from an agent-based model. (J) Growth curves of tumors using different proangiogenic strategies confirmed that the responsive strategy leads to enhanced tumor growth compared with the constitutive strategy. J, Right shows representative images of model outcomes. The responsive strategy not only allowed for faster tumor growth, but also required less total VEGFA. (K) Bars indicate SD from 10 simulations. (L) Localized tube morphogenesis emerges within the MEMIC from a triple coculture of macrophages, endothelial cells (SVECs), and tumor cells (TS1, unlabeled). L, Inset shows a representative magnified region.
Fig. S5.
Fig. S5.
Spatial vascular morphogenesis induced by ischemic macrophages leads to an optimal angiogenic strategy. (A) Endothelial cells within ischemic regions in tumors express the nascent vessel marker Nestin. (B) Tube formation in vitro. Macrophages were cultured in vitro under normal (Upper) or ischemic (Lower) (1% oxygen and 30 mM lactate) conditions for 24 h. Then, endothelial cells (SVECs) embedded in a protein matrix (collagen/matrigel) were added. After 12 h, SVEC cells formed tube-like structures but only under low-oxygen/high-lactate conditions. (C) This tube morphogenesis did not occur in normoxia or in the absence of macrophages and was inhibited by PD98059 (iMAPK) or +Linifanib (iVEGF). Images in A and C are composites of multiple adjacent pictures.
Fig. S6.
Fig. S6.
Spatial vascular morphogenesis induced by ischemic macrophages leads to an optimal angiogenic strategy. (A) Analytic solution to our theoretical model. The effects of nutrients in cell growth have diminishing returns. We assumed that increasing the access to these nutrients (the process of angiogenesis) has a linear cost that creates a trade-off between benefit and cost. We showed that growth is optimized when cells try to get more nutrients only if they are exposed to low levels of nutrients (n* or less). n* is defined by the slope of the cost. More details are in Mathematical Modeling. (B–D) Numerical simulations implemented in an agent-based modeling framework (59, 60). (B) Schematic representation of the model. Resources allow for tumor growth but also inhibited secretion of proangiogenic molecules. The strength of this inhibition is dictated by k/(k+[nutrients]). (C) Secretion of proangiogenic molecules (e.g., VEGFA) according to different nutrient levels for different values of k. At high k values cells secrete VEGFA constitutively. (D) Growth curves of tumors with different k. Each line represents the temporal trajectory of an individual tumor and is colored according its k value. We did 10 simulations with different random seeds for each k value. (E) Bars in Upper plot show that there is an optimal level of response to nutrients that leads to greater tumor growth. If k is too high, tumors secrete VEGFA in a constitutive manner that leads to an increase in total VEGFA levels (E, Lower) but a decrease in growth rate. On the other extreme, if k values are too low, there is not enough VEGFA to sustain rapid tumor growth. The two strategies shown in main text Fig. 4 correspond to k of 0.1 (for the responsive strategy) and 100 (for the constitutive strategy). Error bars correspond to SD from 10 simulations. More details are in Mathematical Modeling. (F) Optimal investment under growth with diminishing returns. The growth rate is a function of the resource density and exhibits diminishing returns. Profit is maximized when r=ropt. (G) Responsive investment is a better strategy than constitutive investment. In G, Left we consider a linear resource decay from the left side, as described in the text. G, Right displays similar results from an exponential distribution of resources. In both cases, the model is implemented the same way. (Upper Left) The constitutive strategy consists of investing everywhere the same amount Δr=ropt (blue line). The responsive strategy localizes investment only where resources are limited (red line). (Upper Right) Level of resources after investment. The dashed black line represents the spatial distribution of resources without investment. (Lower Left) Growth rate given by the saturation kinetics. Because the constitutive strategy invests everywhere, its growth rate is greater as well. (Lower Right) When cost of investment is included in the effective growth rate, then the responsive strategy appears to be better than the constitutive strategy. In the two cases, k=0.3 and c=0.9. (H) Logistic growth using the three strategies described above.

References

    1. Lengauer C, Kinzler KW, Vogelstein B. Genetic instabilities in human cancers. Nature. 1998;396(6712):643–649. - PubMed
    1. Marusyk A, Polyak K. Tumor heterogeneity: Causes and consequences. Biochim Biophys Acta Rev Canc. 2010;1805(1):105–117. - PMC - PubMed
    1. Stephens PJ, et al. Massive genomic rearrangement acquired in a single catastrophic event during cancer development. Cell. 2011;144(1):27–40. - PMC - PubMed
    1. Gerlinger M, et al. Intratumor heterogeneity and branched evolution revealed by multiregion sequencing. N Engl J Med. 2012;366(10):883–892. - PMC - PubMed
    1. Burrell RA, McGranahan N, Bartek J, Swanton C. The causes and consequences of genetic heterogeneity in cancer evolution. Nature. 2013;501(7467):338–345. - PubMed

Publication types

MeSH terms