. 2017 Mar 3;7(1):60.
doi: 10.1038/s41598-017-00127-6.

Vigour in active avoidance

Affiliations

Vigour in active avoidance

Camilla L Nord et al. Sci Rep. .

Abstract

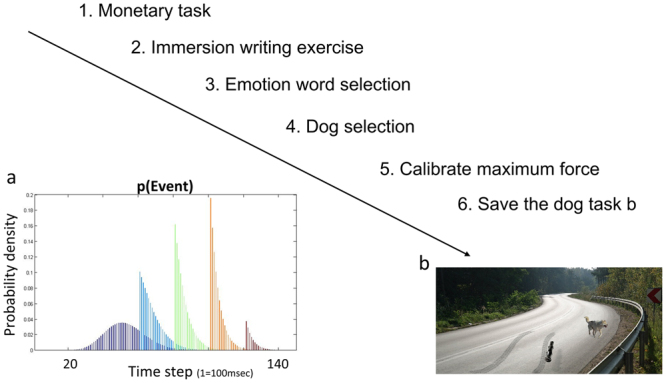
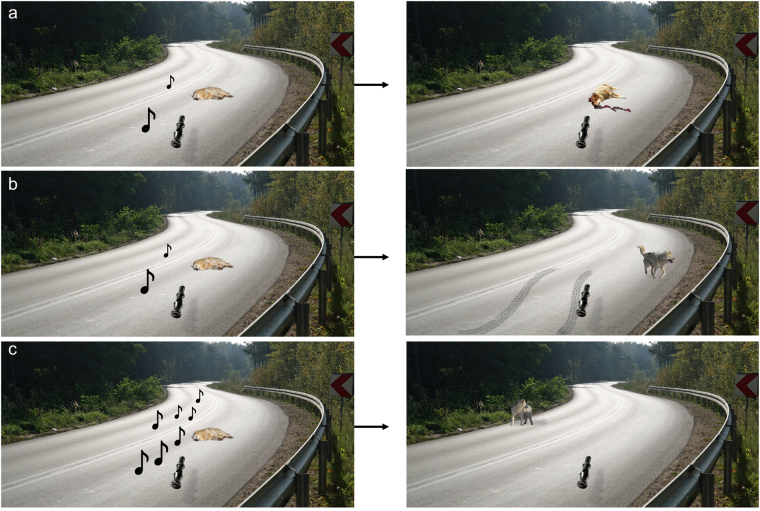
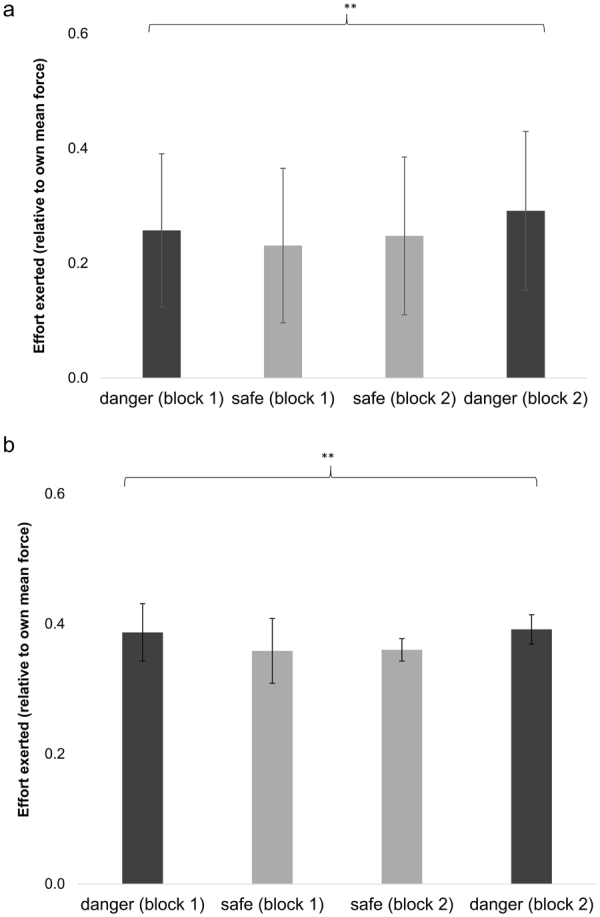
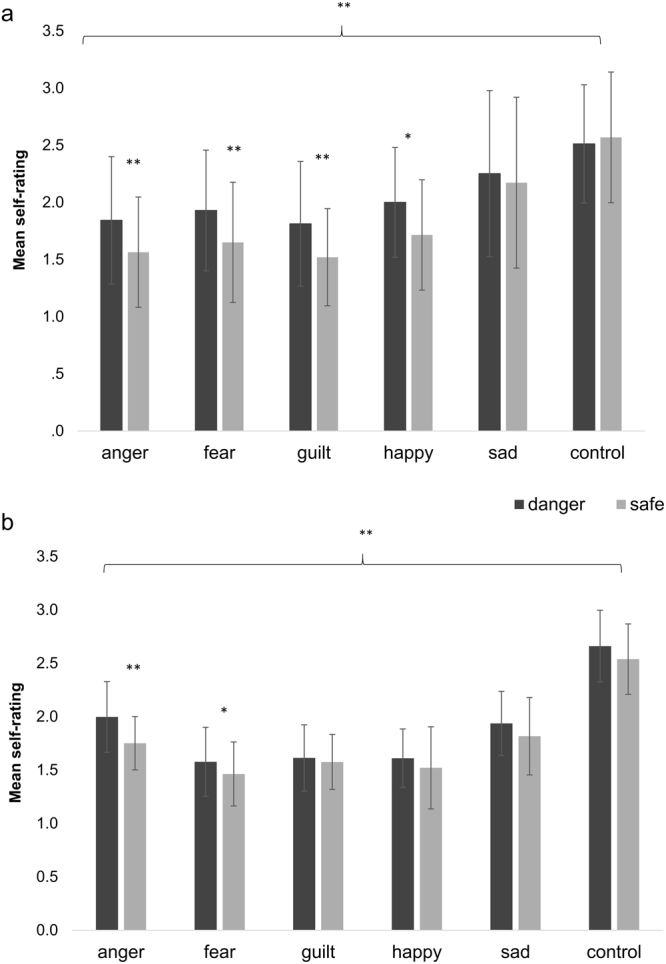
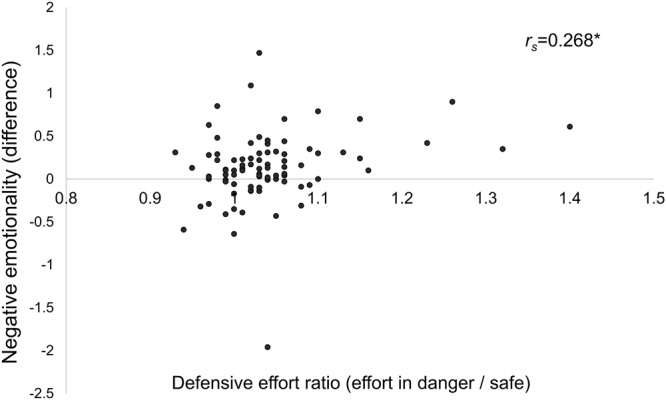
It would be maladaptive to learn about catastrophes by trial and error alone. Investment in planning and effort are necessary. Devoting too many resources to averting disaster, however, can impair quality of life, as in anxiety and paranoia. Here, we developed a novel task to explore how people adjust effort expenditure (vigor) so as to avoid negative consequences. Our novel paradigm is immersive, enabling us to measure vigor in the context of (simulated) disaster. We found that participants (N = 118) exerted effort to avoid disaster-associated states, adjusting their effort expenditure according to the baseline probability of catastrophe, in agreement with theoretical predictions. Furthermore, negative subjective emotional states were associated both with threat level and with increasing vigor in the face of disaster. We describe for the first time effort expenditure in the context of irreversible losses, with important implications for disorders marked by excessive avoidance.


Conflict of interest statement

The authors declare no competing financial interests.

Figures

Figure 1
Figure 1
Task stages. Participants first completed a practice monetary task, then an immersion exercise writing about a pet (real or hypothetical) who died, then briefly selected preferred emotional words (for use in the in-task questions), then selected a preferred dog, and finally exerted their maximum force before beginning the task (1b). How the conditional distribution of the car arriving changed with time within a trial is shown in 1a. Each trial was structured in 100 msec time steps. The distribution at 0 sec is shown in purple; this gradually changes, given that no car arrives, to the brown at t = 12 sec. (based on previous work). For most trials, the more time had passed, the more likely it was that the car was about to arrive (blue to orange). Towards the very end of the trial, however, it became more likely that no car would appear at all. The following image used in Fig. 1b is reproduced under the terms of a Creative Commons 2.0 generic license (https://creativecommons.org/licenses/by/2.0/legalcode) and has been adapted from its original form (Original Author: Drew Avery; title: Annual Dog Sled Race). The link to the original image is: https://www.flickr.com/photos/33590535@N06/5391571785/in/photostream/ The following image used in Fig. 1b is reproduced under the terms of a Creative Commons Attribution-Share Alike 3.0 Unported license (https://creativecommons.org/licenses/by-sa/3.0/legalcode) and has been adapted from its original form (Original Author: Sebastian Hartlaub; title: Dog ultrasound whistle). The link to the original image is: https://commons.wikimedia.org/wiki/File:Hundepfeife05.JPG. The following image was reproduced under the terms of a Freeimages Content License (Author: http://www.freeimages.com/photographer/jakubson-56068). The link to the original image is: http://www.freeimages.com/photo/double-curves-1448529.
Figure 2
Figure 2
Example trials of main task. Each trial started with a view of the selected dog sleeping in the road; participants could squeeze a grip, producing a number of musical notes on the screen proportional to the strength of the squeeze grip (representing the strength of a dog whistle to wake the dog). (a) If insufficient force was exerted, the dog was killed by an oncoming car in 80% of high danger trials and 20% of low danger trials. (b) If insufficient force was exerted, the car swerved and the dog survived in 20% of high danger trials and 80% of low danger trials. (c) If the participant exerted a sustained force (calibrated to their individual grip strength), the trial resulted in the dog being saved. Less effort resulted in proportionally smaller probability of saving the dog. The car was assumed to come from behind the dog on the same side of the road (i.e., originating from beyond the bend in the lower left hand corner of Fig. 2a–c). All participants were UK residents, and were therefore familiar with cars driving on the left side of the road. The following images are reproduced under the terms of a Creative Commons 2.0 generic license (https://creativecommons.org/licenses/by/2.0/legalcode) and have been adapted from its original form (Original Author: Drew Avery; title: Annual Dog Sled Race). The links to the original images are: https://www.flickr.com/photos/33590535@N06/5391571793/in/photostream/ https://www.flickr.com/photos/33590535@N06/5391571785/in/photostream/ https://www.flickr.com/photos/33590535@N06/5392045246/in/photostream/. The following image is reproduced under the terms of a Creative Commons Attribution-Share Alike 3.0 Unported license (https://creativecommons.org/licenses/by-sa/3.0/legalcode) and has been adapted from its original form (Original Author Kim Hansen; title: Recently shot Greenland dog upernavik). The link to the original image is: https://commons.wikimedia.org/wiki/File:Recently_shot_Greenland_dog_upernavik_2007-07-02_edited.jpg. The following image is reproduced under the terms of a Creative Commons Attribution-Share Alike 3.0 Unported license (https://creativecommons.org/licenses/by-sa/3.0/legalcode) and has been adapted from its original form (Original Author: Sebastian Hartlaub; title: Dog ultrasound whistle). The link to the original image is: https://commons.wikimedia.org/wiki/File:Hundepfeife05.JPG. The following image was reproduced under the terms of a Freeimages Content License (Author: http://www.freeimages.com/photographer/jakubson-56068). The link to the original image is: http://www.freeimages.com/photo/double-curves-1448529. The musical note is a Unicode Character, ‘Eighth Note’ (U + 266 A) (The Unicode Standard, Version 1.1.0, (Mountain View, CA: The Unicode Consortium, 1993).
Figure 3
Figure 3
Effect of danger condition on force (expressed as proportion of subject’s maximum force). (a) In Experiment 1, there was a significant main effect of danger condition on force exerted. Participants exerted significantly more force during both high-danger blocks. (b) In Experiment 2, there was a similar main effect of danger, with participants exerting significantly more force during both high-danger blocks. *p = 0.003; **p < 0.001. Error bars represent 95% confidence intervals.
Figure 4
Figure 4
Effect of danger condition on emotion self-rating. (a) In Experiment 1, there was a main effect of emotion, block number, and danger condition, with danger condition increasing subjective emotion rating for both negative (p < 0.001) and positive (p = 0.04) emotions (b) In Experiment 2, there was a main effect of emotion and danger condition, with danger condition generally increasing subjective emotion rating for both negative (p = 0.003) and positive emotions (p = 0.039). *p < 0.05 (does not survive Bonferroni correction for multiple comparisons); **p < 0.001 (survives Bonferroni correction for multiple comparisons). Error bars represent 95% confidence intervals.
Figure 5
Figure 5
Relationship between defense-related changes in vigor and negative emotionality. A non-parametric correlation test (Spearman’s Rank Order correlation coefficient) revealed a significant relationship between each participant’s defensive effort ratio and the degree to which danger condition increased self-reports of negative emotionality. That is, participants whose negative emotions were most increased in high-danger blocks were also those who modified their behavior most according to probability of disaster. *p = 0.011. Of note, one clear outlier is visible (negative emotionality = −1.8, reporting more negative emotions in the safe blocks than danger blocks), but excluding this participant strengthened the correlation (p = 0.002).

Similar articles

Cited by

References

    1. O’Dwyer A-M, Marks I. Obsessive-compulsive disorder and delusions revisited. Br. J. Psychiatry. 2000;176:281–284. doi: 10.1192/bjp.176.3.281. - DOI - PubMed
    1. Heyman I, Mataix-Cols D, Fineberg N. Obsessive-compulsive disorder. Bmj. 2006;333:424–429. doi: 10.1136/bmj.333.7565.424. - DOI - PMC - PubMed
    1. Rachman S. Obsessional ruminations. Behav. Res. Ther. 1971;9:229–235. doi: 10.1016/0005-7967(71)90008-8. - DOI - PubMed
    1. Rothschild, A. J. Clinical manual for diagnosis and treatment of psychotic depression. American Psychiatric Pub, doi:10.1176/ps.2009.60.8.1144a (2009).
    1. Østergaard SD, et al. Measuring psychotic depression. Acta Psychiatr. Scand. 2014;129:211–220. doi: 10.1111/acps.12165. - DOI - PMC - PubMed

Publication types