

Differentiation of the Infarct Core from Ischemic Penumbra within the First 4.5 Hours, Using Diffusion Tensor Imaging-Derived Metrics: A Rat Model
- PMID: 28246507
- PMCID: PMC5313515
- DOI: 10.3348/kjr.2017.18.2.269
Differentiation of the Infarct Core from Ischemic Penumbra within the First 4.5 Hours, Using Diffusion Tensor Imaging-Derived Metrics: A Rat Model
Abstract
Objective: To investigate whether the diffusion tensor imaging-derived metrics are capable of differentiating the ischemic penumbra (IP) from the infarct core (IC), and determining stroke onset within the first 4.5 hours.
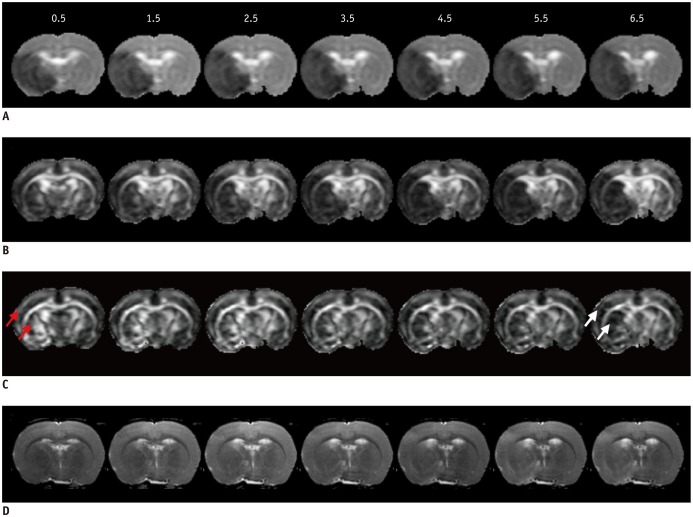
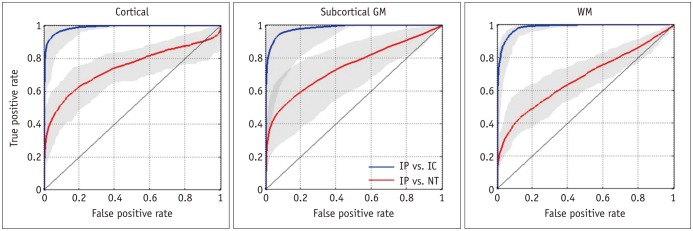
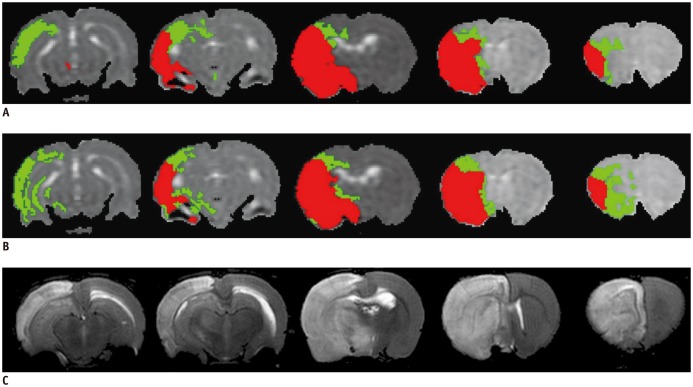
Materials and methods: All procedures were approved by the local animal care committee. Eight of the eleven rats having permanent middle cerebral artery occlusion were included for analyses. Using a 7 tesla magnetic resonance system, the relative cerebral blood flow and apparent diffusion coefficient maps were generated to define IP and IC, half hour after surgery and then every hour, up to 6.5 hours. Relative fractional anisotropy, pure anisotropy (rq) and diffusion magnitude (rL) maps were obtained. One-way analysis of variance, receiver operating characteristic curve and nonlinear regression analyses were performed.
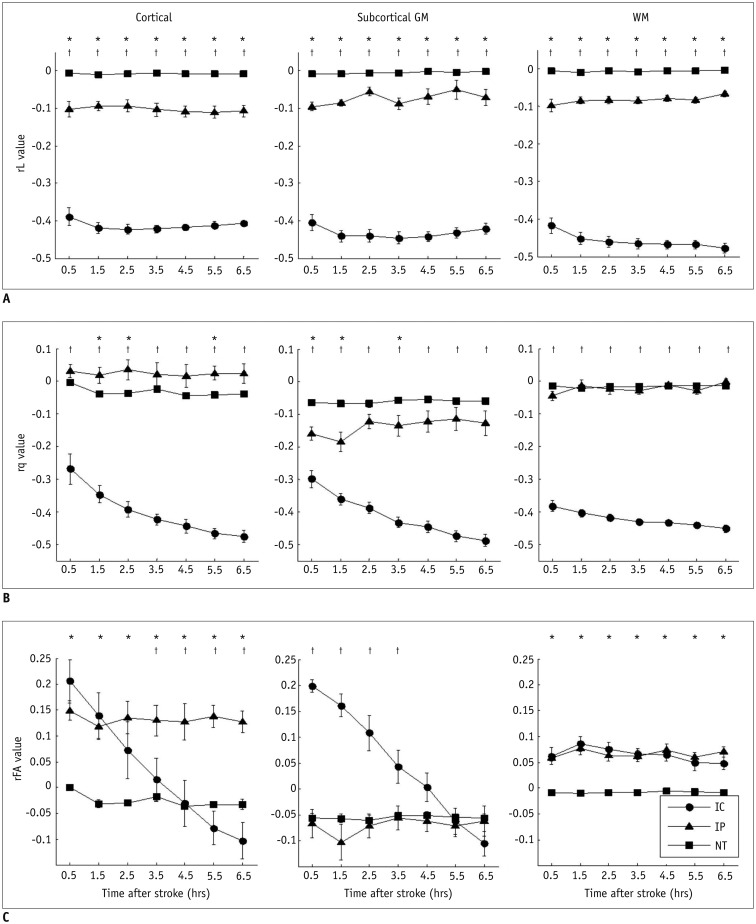
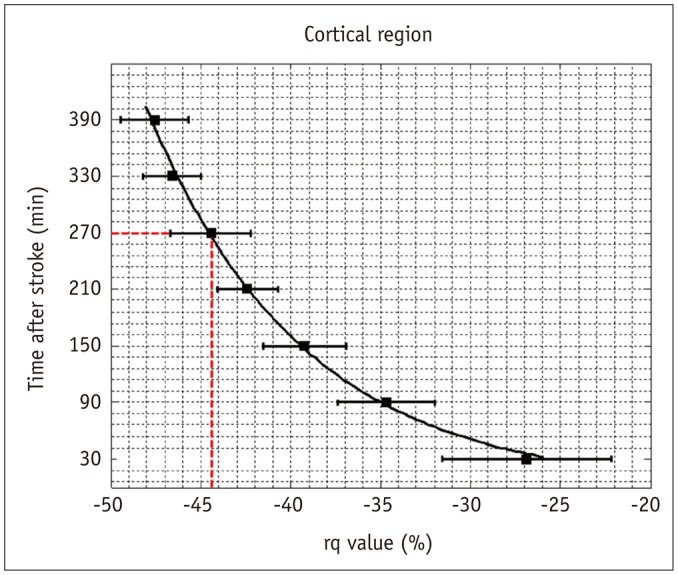
Results: The evolutions of tensor metrics were different in ischemic regions (IC and IP) and topographic subtypes (cortical, subcortical gray matter, and white matter). The rL had a significant drop of 40% at 0.5 hour, and remained stagnant up to 6.5 hours. Significant differences (p < 0.05) in rL values were found between IP, IC, and normal tissue for all topographic subtypes. Optimal rL threshold in discriminating IP from IC was about -29%. The evolution of rq showed an exponential decrease in cortical IC, from -26.9% to -47.6%; an rq reduction smaller than 44.6% can be used to predict an acute stroke onset in less than 4.5 hours.
Conclusion: Diffusion tensor metrics may potentially help discriminate IP from IC and determine the acute stroke age within the therapeutic time window.
Keywords: Diffusion magnitude; Diffusion tensor imaging; Infarct core; Ischemic penumbra; Pure anisotropy.
Figures
References
-
- Hacke W, Kaste M, Bluhmki E, Brozman M, Dávalos A, Guidetti D, et al. Thrombolysis with alteplase 3 to 4.5 hours after acute ischemic stroke. N Engl J Med. 2008;359:1317–1329. - PubMed
-
- Kang DW, Kwon JY, Kwon SU, Kim JS. Wake-up or unclear-onset strokes: are they waking up to the world of thrombolysis therapy? Int J Stroke. 2012;7:311–320. - PubMed
-
- Bhagat YA, Hussain MS, Stobbe RW, Butcher KS, Emery DJ, Shuaib A, et al. Elevations of diffusion anisotropy are associated with hyper-acute stroke: a serial imaging study. Magn Reson Imaging. 2008;26:683–693. - PubMed
-
- Sakai K, Yamada K, Nagakane Y, Mori S, Nakagawa M, Nishimura T. Diffusion tensor imaging may help the determination of time at onset in cerebral ischaemia. J Neurol Neurosurg Psychiatry. 2009;80:986–990. - PubMed
-
- Puig J, Blasco G, Daunis-I-Estadella J, Thomalla G, Castellanos M, Soria G, et al. Increased corticospinal tract fractional anisotropy can discriminate stroke onset within the first 4.5 hours. Stroke. 2013;44:1162–1165. - PubMed
MeSH terms
LinkOut - more resources
Full Text Sources
Other Literature Sources
