. 2017:2017:8498510.
doi: 10.1155/2017/8498510. Epub 2017 Jan 26.

Decreased Tissue COX5B Expression and Mitochondrial Dysfunction during Sepsis-Induced Kidney Injury in Rats

Affiliations

Decreased Tissue COX5B Expression and Mitochondrial Dysfunction during Sepsis-Induced Kidney Injury in Rats

Jochen Hinkelbein et al. Oxid Med Cell Longev. 2017.

Abstract

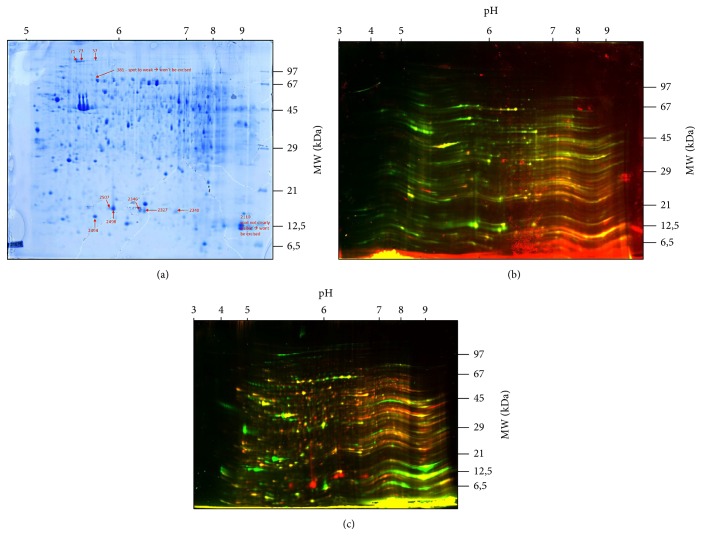
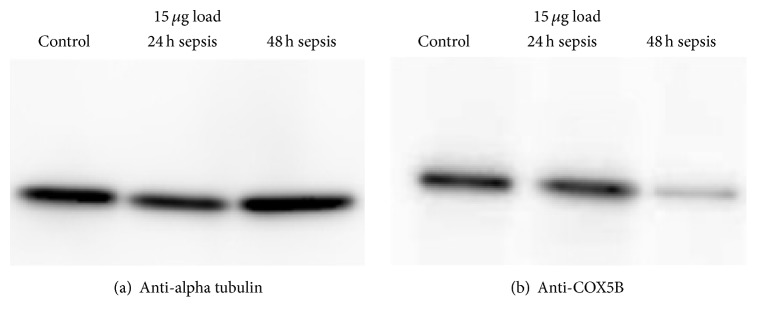
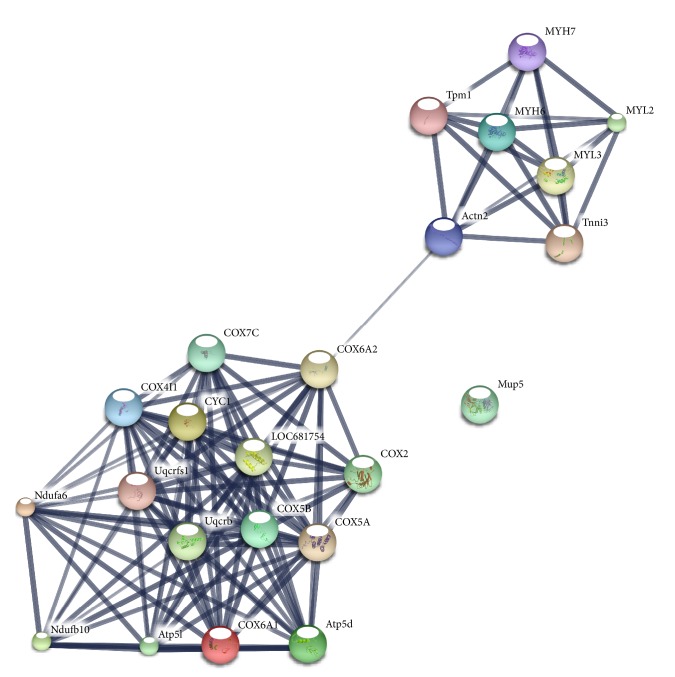
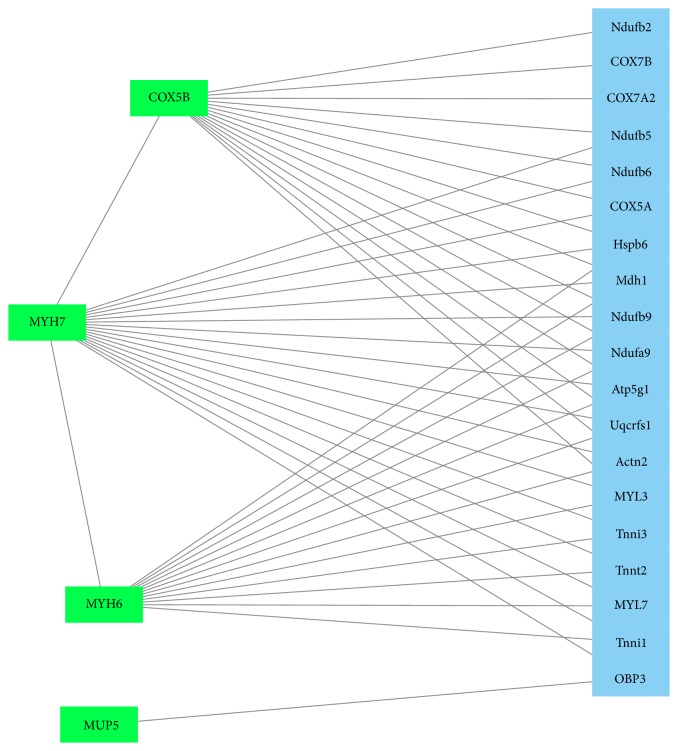
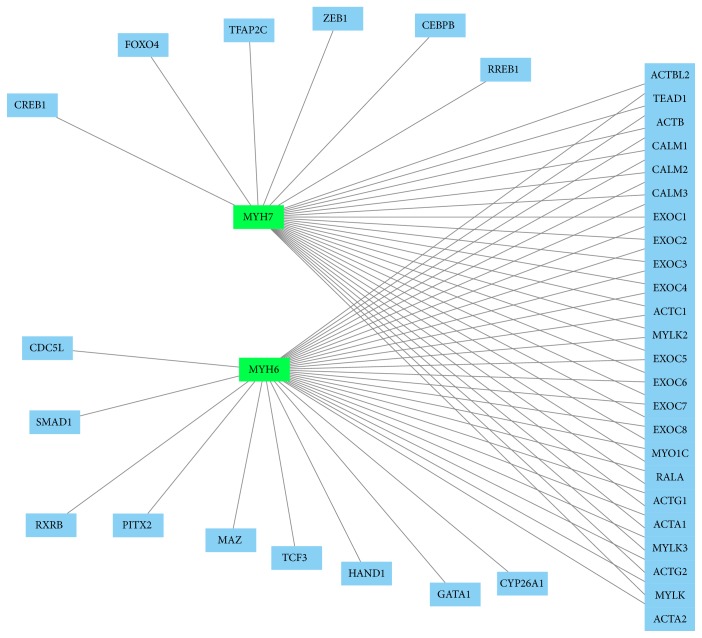
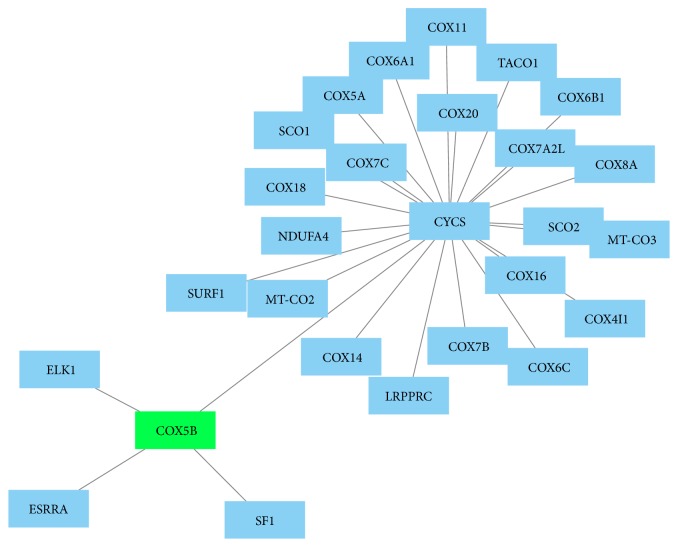
Background. Sepsis is defined as a life-threatening organ dysfunction due to a dysregulated host response to infection. Sepsis is the dominant cause of acute kidney injury (AKI), accounting for nearly 50% of episodes of acute renal failure. Signaling cascades and pathways within the kidney are largely unknown and analysis of these molecular mechanisms may enhance knowledge on pathophysiology and possible therapeutic options. Material and Methods. 26 male Wistar rats were assigned to either a sham group (control, N = 6) or sepsis group (N = 20; cecal ligature and puncture model, 24 and 48 hours after CLP). Surviving rats (n = 12) were decapitated at 24 hours (early phase; n = 6) or 48 hours (late phase; n = 6) after CLP and kidneys removed for proteomic analysis. 2D-DIGE and DeCyder 2D software (t-test, P < 0.01) were used for analysis of significantly regulated protein spots. MALDI-TOF in combination with peptide mass fingerprinting (PMF) as well as Western Blot analysis was used for protein identification. Bioinformatic network analyses (STRING, GeneMania, and PCViz) were used to describe protein-protein interactions. Results. 12 spots were identified with significantly altered proteins (P < 0.01) in the three analyzed groups. Two spots could not be identified. Four different proteins were found significantly changed among the groups: major urinary protein (MUP5), cytochrome c oxidase subunit B (COX5b), myosin-6 (MYH6), and myosin-7 (MYH7). A significant correlation with the proteins was found for mitochondrial energy production and electron transport. Conclusions. COX5B could be a promising biomarker candidate since a significant association was found during experimental sepsis in the present study. For future research, COX5B should be evaluated as a biomarker in both human urine and serum to identify sepsis.


Conflict of interest statement

The authors declare no conflict of interests.

Figures

Figure 1
Figure 1
(a) Preparative 2D-Gel (Coomassie blue) of control and sepsis samples. Threshold of regulation is 2 SD (standard deviation) and t-test value P < 0.01. Spots #381 and #2110 have not been analyzed (Table 2) since they were too weak or not visible for excision. Other spots are marked with arrows and numbers. Alteration of the spots is presented in Table 3. The gel is a sample gel with proteins of the 24 hours' group. (b) Cy3 and Cy5 images of the gels. Cy5: red color = sepsis 24 h group. Cy3: green color = control group. The gel shows proteins of the control group and 24 hours group. (c) Cy3 and Cy5 images of the gels. Cy5: red color = control group. Cy3: green color = 48 h sepsis group. The gel shows proteins of the control group and 48 hours' group.
Figure 2
Figure 2
Enhanced chemiluminescence (ECL) signal of Western Blot analysis of anti-alpha tubulin (a) which was used as control and of anti-COX5B (b). The anti-tubulin band is located at 55 kDa and the anti-COX5B band is located at 11 kDa. For analysis, 15 μg load each was used.
Figure 3
Figure 3
Protein network identified by STRING software (http://www.string-db.org/; confidence view, for MUP5, COX5b, MYH6, and MYH7). Thickness of the lines is directly proportional to the strong of connections among the nodes. Medium level of confidence (score 0.400, with the maximum level of confidence at 0.900 and the lowest at 0.150) and no more than 20 nodes used. For other proteins in the network, see Table 5. To generate the network, all significantly altered proteins were used for analysis, that is, pooled data from the 24 and 48 hours' group.
Figure 4
Figure 4
GeneMANIA network (http://www.genemania.org/; visualization using Cytoscape, http://www.cytoscape.org/) found by search of significantly regulated proteins of the present study (i.e., MYH6, MYH7, COX5B, and MUP5). Proteins were entered to gather interactions. Green squares represent searched proteins and blue squares represent connections found by GeneMANIA. The identified proteins MUP5, COX5B, MYH6, and MYH7 are linked together within this network mainly by Atp5g1, COX5a, and OBP3. The lines show interactions between the nodes/proteins. To generate the network, all significantly altered proteins were used for analysis, that is, pooled data from the 24 and 48 hours' group.
Figure 5
Figure 5
Protein network created by PCViz (Pathway Commons; http://www.pathwaycommons.org/; visualization using Cytoscape, http://www.cytoscape.org/). MYH6 and MYH7 are marked in green. All related proteins (blue nodes) are linked by lines to generate the network. COX5B and MUP5 proteins were not found to be present in this specific network. To generate the network, all significantly altered proteins were used for analysis, that is, pooled data from the 24 and 48 hours' group.
Figure 6
Figure 6
Protein network created by PCViz (Pathway Commons; http://www.pathwaycommons.org/; visualization using Cytoscape, http://www.cytoscape.org/). COX5B, in green, is centered and linked to other proteins via CYCS (human cytochrome c). MYH6 and MYH7 proteins were not found to be present in this specific network. To generate the network, all significantly altered proteins were used for analysis, that is, pooled data from the 24 and 48 hours' group.
Figure 7
Figure 7
COX5B localizations within a cell (from: subcellular locations, UniProtKB/Swiss-Prot for COX5B Gene). The location of COX5B within the cell is presented with statistic confidence: the darker the green color, the higher the probability for COX5B to be present in this location.
Figure 8
Figure 8
Spot ratios for the proteins identified. A positive value represents lower protein expression during sepsis. A negative value represents higher protein expression during sepsis. Values are shown against control group.

Similar articles

Cited by

References

    1. Singer M., Detschman C., Seymour C. The third international consesnus definitions for sepsis and septic shock (Sepsis-3) The Journal of the American Medical Association. 2016;315(8):801–810. doi: 10.1001/jama.2016.0287. - DOI - PMC - PubMed
    1. Doi K., Leelahavanichkul A., Yuen P. S. T., Star R. A. Animal models of sepsis and sepsis-induced kidney injury. The Journal of Clinical Investigation. 2009;119(10):2868–2878. doi: 10.1172/jci39421. - DOI - PMC - PubMed
    1. De Mendonça A., Vincent J.-L., Suter P. M., et al. Acute renal failure in the ICU: risk factors and outcome evaluated by the SOFA score. Intensive Care Medicine. 2000;26(7):915–921. doi: 10.1007/s001340051281. - DOI - PubMed
    1. Angus D. C., Linde-Zwirble W. T., Lidicker J., Clermont G., Carcillo J., Pinsky M. R. Epidemiology of severe sepsis in the United States: analysis of incidence, outcome, and associated costs of care. Critical Care Medicine. 2001;29(7):1303–1310. doi: 10.1097/00003246-200107000-00002. - DOI - PubMed
    1. Brealey D., Brand M., Hargreaves I., et al. Association between mitochondrial dysfunction and severity and outcome of septic shock. Lancet. 2002;360(9328):219–223. doi: 10.1016/S0140-6736(02)09459-X. - DOI - PubMed

MeSH terms

Substances

LinkOut - more resources