. 2017:2017:4360357.
doi: 10.1155/2017/4360357. Epub 2017 Jan 26.

Urinary Excretion of Kidney Aquaporins as Possible Diagnostic Biomarker of Diabetic Nephropathy

Affiliations

Urinary Excretion of Kidney Aquaporins as Possible Diagnostic Biomarker of Diabetic Nephropathy

Luigi Rossi et al. J Diabetes Res. 2017.

Abstract

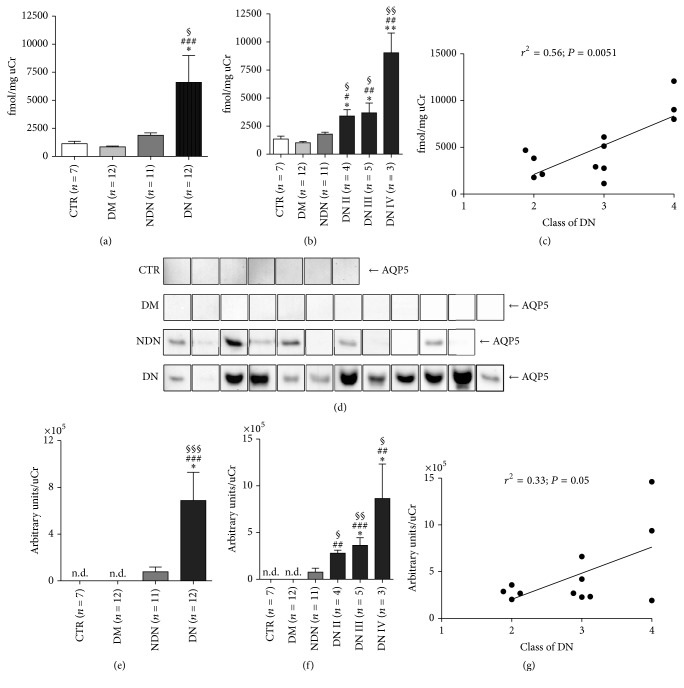
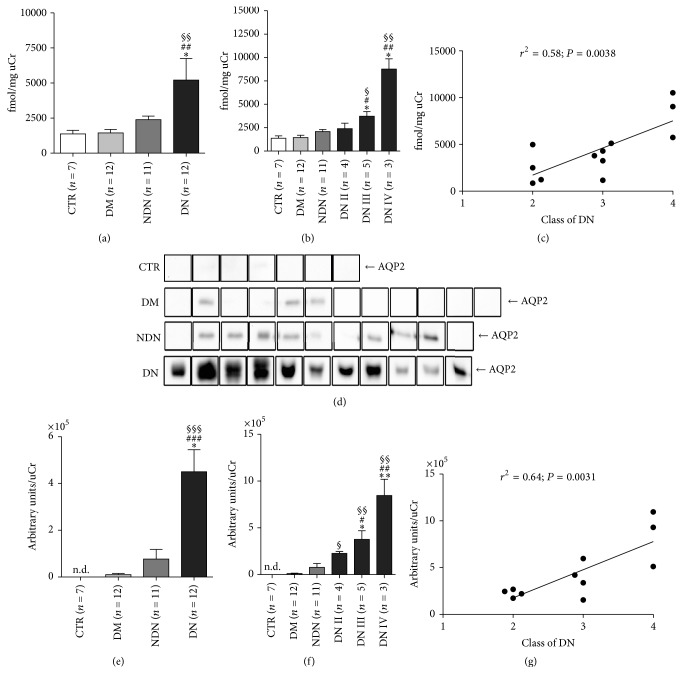
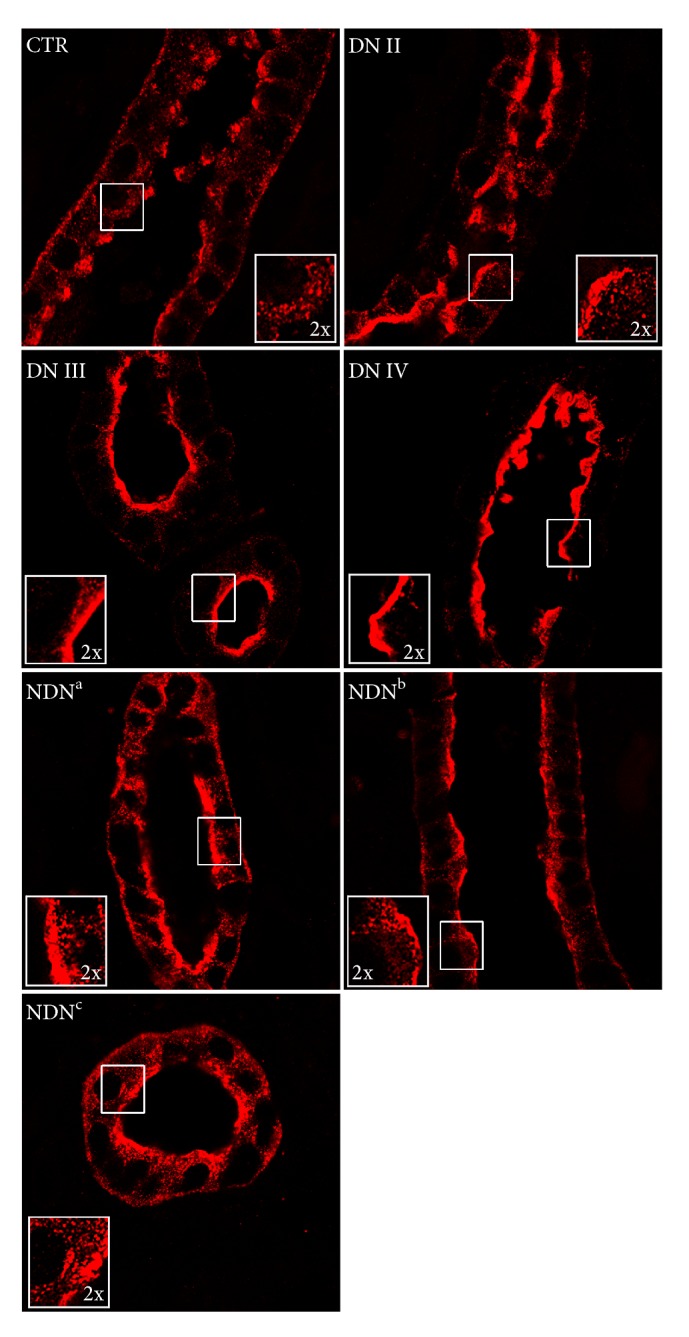
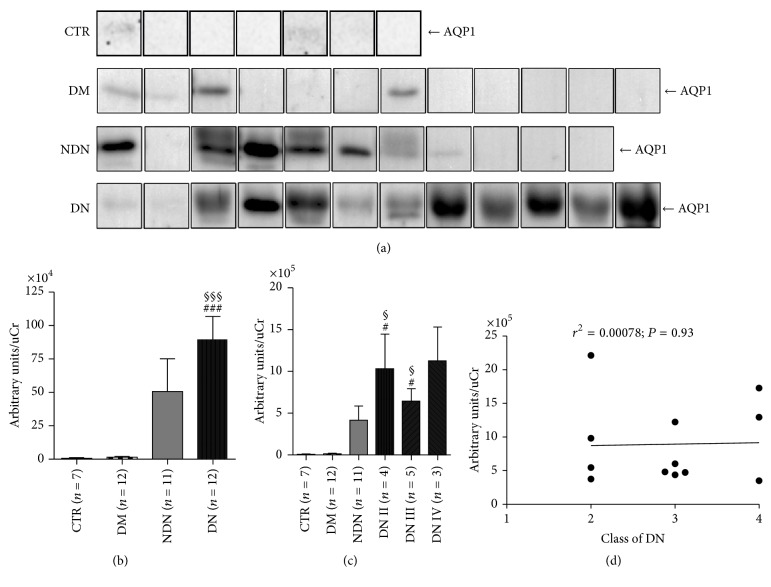
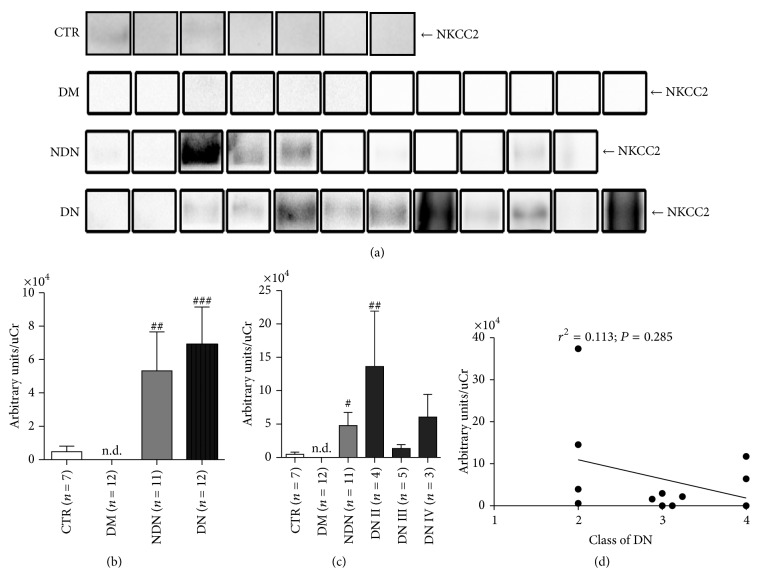
Diabetic nephropathy (DN) is a microangiopathic complication of diabetes mellitus (DM) affecting one-third of diabetic patients. The large variability in the clinical presentation of renal involvement in patients with DM makes kidney biopsy a prerequisite for a correct diagnosis. However, renal biopsy is an invasive procedure associated with risk of major complications. Numerous studies aimed to identify a noninvasive biomarker of DN but, so far, none of these is considered to be sufficiently specific and sensitive. Water channel aquaporins (AQPs), expressed at the plasma membrane of epithelial tubular cells, are often dysregulated during DN. In this work, we analyzed the urine excretion of AQP5 and AQP2 (uAQP5 and uAQP2), via exosomes, in 35 diabetic patients: 12 normoalbuminuric with normal renal function (DM), 11 with proteinuric nondiabetic nephropathy (NDN), and 12 with histological diagnosis and classification of DN. ELISA and WB analysis independently showed that uAQP5 was significantly increased in DN patients. Interestingly, linear regression analysis showed a positive correlation between uAQP5 and the histological class of DN. The same analysis, focusing on uAQP2, showed comparable results. Taken together, these data suggest a possible use of AQP5 and AQP2 as novel noninvasive biomarkers to help in classifying the clinical stage of DN.


Conflict of interest statement

The authors declare that they have no competing interests.

Figures

Figure 1
Figure 1
The urinary excretion of AQP5 dramatically increases in DN patients and positively correlates with the clinical severity of DN. (a) Urinary AQP5 excretion was measured by ELISA in urine samples of healthy subjects (CTR, n = 7), patients with DM (n = 12), patients with NDN (n = 11), and patients with DN (n = 12) and expressed as fmol/mg urine creatinine. All data are reported as mean ± SEM. §P < 0.05 versus CTR, ###P < 0.001 versus DM, and P < 0.05 versus NDN, obtained by Kruskal-Wallis one-way ANOVA test. (b) DN patients were grouped according to the histological changes evaluated by kidney biopsy: DN stage II (n = 4), DN stage III (n = 5), and DN stage IV (n = 3) and uAQP5 at each stage compared to uAQP5 in CTR and DM and NDN patients. All data are reported as mean ± SEM. §§P < 0.01 and §P < 0.05 versus CTR, ##P < 0.01 and #P < 0.05 versus DM, and ∗∗P < 0.01 and P < 0.05 versus NDN, obtained by Kruskal-Wallis one-way ANOVA test. (c) Linear regression analysis of uAQP5 abundance, as measured by ELISA, with the class of DN (r2 = 0.56; P = 0.0051). (d) Exosomes were isolated from urine of healthy subjects (CTR, n = 7), patients with DM (n = 12), patients with NDN (n = 11), and patients with DN (n = 12) using the two-step differential centrifugation method. Total exosome proteins were resolved on 12% SDS-PAGE and analyzed by Western blotting for AQP5 abundance. (e) Densitometry analysis of the uAQP5 band intensities was normalized for uCr and reported as means ± SEM. §§§P < 0.001 versus CTR, ###P < 0.001 versus DM, and P < 0.05 versus NDN, obtained by Kruskal-Wallis one-way ANOVA test. n.d.: nondetectable. (f) DN patients were grouped according to the histological changes evaluated by kidney biopsy: DN stage II (n = 4), DN stage III (n = 5), and DN stage IV (n = 3) and densitometry analysis of uAQP5 at each stage compared to uAQP5 in CTR and DM and NDN patients. All data are reported as mean ± SEM. §§P < 0.01 and §P < 0.05 versus CTR, ##P < 0.01 and ###P < 0.001 versus DM, and P < 0.05 versus NDN, obtained by Kruskal-Wallis one-way ANOVA test. (g) Linear regression analysis of uAQP5 abundance, as semiquantified by Western blotting, with the class of DN (r2 = 0.33; P = 0.05).
Figure 2
Figure 2
The urinary excretion of AQP2 dramatically increases in DN patients and positively correlates with the clinical severity of DN. (a) Urinary AQP2 excretion was measured by ELISA in urine samples of healthy subjects (CTR, n = 7), patients with DM (n = 12), patients with NDN (n = 11), and patients with DN (n = 12) and expressed as fmol/mg urine creatinine. All data are reported as mean ± SEM. §§P < 0.01 versus CTR, ##P < 0.01 versus DM, and P < 0.05 versus NDN, obtained by Kruskal-Wallis one-way ANOVA test. (b) DN patients were grouped according to the histological changes evaluated by kidney biopsy: DN stage II (n = 4), DN stage III (n = 5), and DN stage IV (n = 3) and uAQP2 at each stage compared to uAQP2 in DM and NDN patients. All data are reported as mean ± SEM. §§P < 0.01 and §P < 0.05 versus CTR, ##P < 0.01 and #P < 0.05 versus DM, and P < 0.05 versus NDN, obtained by Kruskal-Wallis one-way ANOVA test. (c) Linear regression analysis of uAQP2 abundance, as measured by ELISA, with the class of DN (r2 = 0.58; P = 0.0038). (d) Exosomes were isolated from urine of healthy subjects (CTR, n = 7), patients with DM (n = 12), patients with NDN (n = 11), and patients with DN (n = 11) using the two-step differential centrifugation method. Total exosome proteins were resolved on 12% SDS-PAGE and analyzed by Western blotting for AQP2 abundance. (e) Densitometry analysis of the uAQP2 band intensities was normalized for uCr and reported as means ± SEM. §§§P < 0.001 versus CTR, ###P < 0.001 versus DM, and P < 0.05 versus NDN, obtained by Kruskal-Wallis one-way ANOVA test. (f) DN patients were grouped according to the histological changes evaluated by kidney biopsy: DN stage II (n = 4), DN stage III (n = 4), and DN stage IV (n = 3) and densitometry analysis of uAQP2 at each stage compared to uAQP2 in CTR and DM and NDN patients. All data are reported as mean ± SEM. §§P < 0.01 and §P < 0.05 versus CTR, ##P < 001 and #P < 0.05 versus DM, and ∗∗P < 0.01 and P < 0.05 versus NDN, obtained by Kruskal-Wallis one-way ANOVA test. (g) Linear regression analysis of uAQP2 abundance, as semiquantified by Western blotting, with the class of DN (r2 = 0.64; P = 0.0031).
Figure 3
Figure 3
AQP2 plasma membrane localization increases in DN patients and with the clinical severity of DN. Human kidney biopsies from control kidney (CTR), DN, and NDN patients were subjected to immunofluorescence analysis of AQP2 subcellular localization. AQP2 immunostaining, shown in red, was visualized in the xy apical confocal plan. Confocal pictures are representative of AQP2 staining in the cortical collecting duct of normal kidney (CTR), kidneys of patients with class II (DN II), class III (DN III), and class IV (DN IV) DN, and kidneys of NDN patients. NDNa is a patient with membranous nephropathy and angiosclerosis, NDNb is a patient with chronic interstitial nephritis, and NDNc is a patient with endocapillary/extracapillary glomerulonephritis. Similar results were obtained in three patients per each group.
Figure 4
Figure 4
The urinary excretion of AQP1 increases in both DN and NDN patients and does not correlate with the clinical severity of DN. (a) Exosomes were isolated from urine of healthy subjects (CTR, n = 7), patients with DM (n = 12), patients with NDN (n = 11), and patients with DN (n = 12) using the two-step differential centrifugation method. Total exosome proteins were resolved on 12% SDS-PAGE and analyzed by Western blotting for AQP1 abundance. (b) Densitometry analysis of the uAQP1 band intensities was normalized for uCr and reported as means ± SEM. §§§P < 0.001 versus CTR and ###P < 0.001 versus DM, obtained by Kruskal-Wallis one-way ANOVA test. (c) DN patients were grouped according to the histological changes evaluated by kidney biopsy: DN stage II (n = 4), DN stage III (n = 5), and DN stage IV (n = 3) and densitometry analysis of uAQP1 at each stage compared to uAQP1 in CTR and DM and NDN patients. All data are reported as mean ± SEM. §P < 0.05 versus CTR and #P < 0.05 versus DM, obtained by Kruskal-Wallis one-way ANOVA test. (d) Linear regression analysis of uAQP1 abundance, as semiquantified by Western blotting, with the class of DN (r2 = 0.00078; P = 0.93).
Figure 5
Figure 5
The urinary excretion of NKCC2 increases in both DN and NDN patients and does not correlate with the clinical severity of DN. (a) Exosomes were isolated from urine of healthy subjects (CTR, n = 7), patients with DM (n = 12), patients with NDN (n = 11), and patients with DN (n = 12) using the two-step differential centrifugation method. Total exosome proteins were resolved on 10% SDS-PAGE and analyzed by Western blotting for NKCC2 abundance. (b) Densitometry analysis of the uNKCC2 band intensities was normalized for uCr and reported as means ± SEM. ###P < 0.001 and ##P < 0.01 versus DM, obtained by Kruskal-Wallis one-way ANOVA test. n.d.: nondetectable. (c) DN patients were grouped according to the histological changes evaluated by kidney biopsy: DN stage II (n = 4), DN stage III (n = 5), and DN stage IV (n = 3) and densitometry analysis of uNKCC2 at each stage compared to uNKCC2 in CTR and DM and NDN patients. All data are reported as mean ± SEM. ##P < 0.01 and #P < 0.05 versus DM, obtained by Kruskal-Wallis one-way ANOVA test. (d) Linear regression analysis of uNKCC2 abundance, as semiquantified by Western blotting, with the class of DN (r2 = 0.113; P = 0.285).

References

    1. Danaei G., Finucane M. M., Lu Y., et al. National, regional, and global trends in fasting plasma glucose and diabetes prevalence since 1980: systematic analysis of health examination surveys and epidemiological studies with 370 country-years and 2∙7 million participants. The Lancet. 2011;378(9785):31–40. doi: 10.1016/s0140-6736(11)60679-x. - DOI - PubMed
    1. Morrish N. J., Wang S.-L., Stevens L. K., et al. Mortality and causes of death in the WHO multinational study of vascular disease in diabetes. Diabetologia. 2001;44(2):S14–S21. doi: 10.1007/PL00002934. - DOI - PubMed
    1. Bonora E., Kiechl S., Willeit J., et al. Population-based incidence rates and risk factors for type 2 diabetes in white individuals: the Bruneck study. Diabetes. 2004;53(7):1782–1789. doi: 10.2337/diabetes.53.7.1782. - DOI - PubMed
    1. Collins A. J., Foley R. N., Chavers B., et al. United States Renal Data System 2011 annual data report: atlas of chronic kidney disease & end-stage renal disease in the United States. American Journal of Kidney Diseases. 2012;59(1, supplement 1, article A7):e1–e420. doi: 10.1053/j.ajkd.2011.11.015. - DOI - PubMed
    1. Mazzucco G., Bertani T., Fortunato M., et al. Different patterns of renal damage in type 2 diabetes mellitus: a multicentric study on 393 biopsies. American Journal of Kidney Diseases. 2002;39(4):713–720. doi: 10.1053/ajkd.2002.31988. - DOI - PubMed