. 2017 Feb 15;3(2):e1601966.
doi: 10.1126/sciadv.1601966. eCollection 2017 Feb.

Ultraflexible nanoelectronic probes form reliable, glial scar-free neural integration

Affiliations

Ultraflexible nanoelectronic probes form reliable, glial scar-free neural integration

Lan Luan et al. Sci Adv. .

Abstract

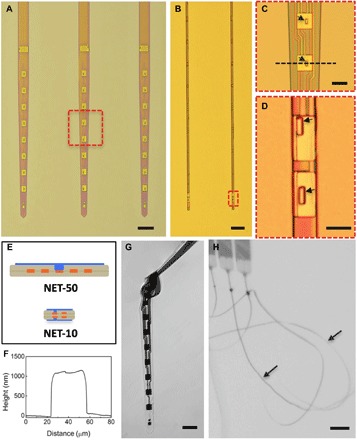
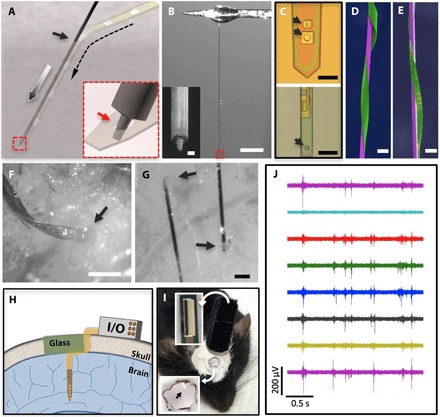
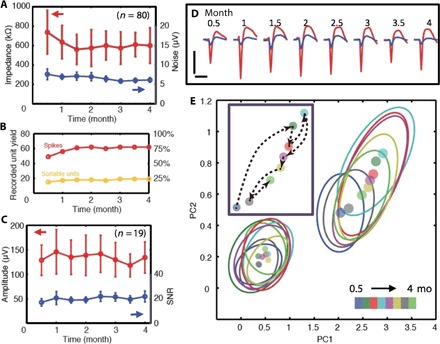
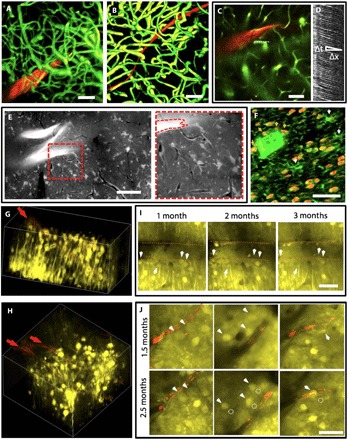
Implanted brain electrodes construct the only means to electrically interface with individual neurons in vivo, but their recording efficacy and biocompatibility pose limitations on scientific and clinical applications. We showed that nanoelectronic thread (NET) electrodes with subcellular dimensions, ultraflexibility, and cellular surgical footprints form reliable, glial scar-free neural integration. We demonstrated that NET electrodes reliably detected and tracked individual units for months; their impedance, noise level, single-unit recording yield, and the signal amplitude remained stable during long-term implantation. In vivo two-photon imaging and postmortem histological analysis revealed seamless, subcellular integration of NET probes with the local cellular and vasculature networks, featuring fully recovered capillaries with an intact blood-brain barrier and complete absence of chronic neuronal degradation and glial scar.

Keywords: biocompatible implant; in vivo imaging; intracortical recording; nanoelectronics; neural electrode; ultra-flexible electronics.


Figures

Fig. 1
Fig. 1. Structures of NET neural probes.
(A and B) As-fabricated NET-50 and NET-10 probes on substrates. (C and D) Zoom-in views of two electrodes as marked by the dashed boxes in (A) and (B), respectively. Arrows denote “vias.” (E) Schematics of the probe cross section in (A, top) and (B, bottom), highlighting the multilayer layout. Color code: gray, insulation; orange, interconnects; and blue, electrodes. Not drawn to scale. (F) Height profile of the NET-50 probe along the dashed line in (C) measured by an atomic force microscope. (G) A NET-50 probe suspended in water. A knot is made with a curvature of less than 50 μm to illustrate its flexibility and robustness. (H) Multiple NET-10 probes suspended in water. Arrows denote the probes. Scale bars, 100 μm (A), 50 μm (B, G, and H), and 10 μm (C and D).
Fig. 2
Fig. 2. Implantation procedure for the NET probes.
(A) Schematic showing the temporary engaging mechanism. Arrows denote the entry site of the implantation (solid), the delivery path of the shuttle device (gray), and the path of the engaged NET probe (dashed). Inset: Zoom-in view of the dashed square highlighting that the micropost engages in the microhole on the NET probe at the end of the shuttle device. (B) Photograph of a typical carbon fiber shuttle device, with a diameter of 7 μm and a length of 3 mm, mounted at the end of a micromanipulator. Scale bar, 500 μm. Inset: Scanning electron microscopy (SEM) image of the micromilled post with a diameter of 2 μm and a height of 5 μm at the shuttle device tip. Scale bar, 2 μm. (C) Optical micrographs showing engaging holes in NET-50 (top) and NET-10 (bottom) probes with a slightly larger diameter than the post, as denoted by the arrows. (D and E) False-colored SEM images of NET-50 and NET-10 probes (green) attached on shuttle devices with a 20-μm tungsten microwire (D, purple) and a 10-μm carbon fiber (E, purple) showing their ultrasmall dimensions. Scale bars, 50 μm (D) and 20 μm (E). (F and G) Micrographs showing that both NET-50 and NET-10 probes were successfully delivered into the living mouse brain with minimal acute tissue damage. Arrows denote the delivery entry sites. Scale bars, 100 μm (F) and 50 μm (G). (H) Schematic of skull fixation that accommodates both connectors for the neural probes and a glass window allowing optical access. Not drawn to scale. (I) Photograph of a typical postsurgery mouse with implanted NET probes and a glass window mounted on top. Insets: top, image of a cable connector mounted on the skull; bottom, zoom-in view of the glass window in which the arrow denotes an implanted probe. (J) Typical unit activities recorded by eight electrodes on an implanted NET-50 probe. A high-pass filter (300 Hz) was applied.
Fig. 3
Fig. 3. Chronic recording and electrical characterization of implanted NET electrodes.
(A) Impedance (red) and noise level (blue) of 80 implanted electrodes as a function of time. Error bars mark the SD. (B) The number (left) and percentage (right) of electrodes that recorded unit activities (red) and sortable single-unit APs (orange) as a function of time. (C) Average peak-valley amplitude (red) and SNR (blue) of single-unit APs recorded by n = 19 electrodes as a function of time. Error bars indicate the SD. (D) Twice-a-month measurements for 4 months from one electrode that recorded both nonsortable spikes (blue) and sortable AP waveforms (red). The waveforms are isolated and averaged from 3- to 9-min recording segments. Vertical bar, 200 μV; horizontal bar, 1 ms. (E) Principal component (PC) analysis of all the waveforms in (D). Dots: center of the PC. Ovals: 2σ contour of PC distribution. Colors code the time stamps. Inset: The evolution over time of the centers of the PC for the single-unit waveform.
Fig. 4
Fig. 4. Imaging and tracking of the cellular and vascular structures at the chronic probe-tissue interface.
(A and B) Three-dimensional (3D) reconstruction of vasculatures by in vivo 2P microscopy around NET-50 (A) and NET-10 (B) probes (red) 2 months after implantation, highlighting fully recovered capillary networks (green). Image stack: 0 to 400 μm (A) and 100 to 320 μm (B) below the brain surface. See movie S2 for a full view of (B). (C) 2P image at 200 μm deep marking the position of a capillary (dashed line) for the line scans in (D). (D) Matrix of line scans showing movement of RBCs as dark stripes, the slope of which gives the blood flow speed. (E) Projection of in vivo 2P images at 210 to 250 μm below the brain surface at 3.5 months after implantation showing normal astrocytes and capillaries. The bright “z”-shaped object is a folded NET-50 probe. The capillaries are visible as dark lines. Right: Zoom-in view of the dashed area. See movie S3 for the full image stack 125 to 360 μm below the brain surface. (F) Projection of confocal micrographs of an immunochemically labeled cross-sectional slice (30 μm thick, 5 months after implantation). False-color code: orange, NeuN, labeling neuron nuclei; green, lba-1 labeling microglia. White arrows denote microglia soma. Orange arrows denote neurons in contact with the NET probe. (G and H) 3D reconstruction of in vivo 2P images of neurons (yellow) in Thy1-YFP mice surrounding a NET-50 probe (G) and two NET-10 probes (H) 2 and 2.5 months after implantation, respectively. The probes are in red and denoted by arrows. Imaging depth: (G) 130 to 330 μm below the brain surface, (H) 110 to 260 μm below the brain surface. (I and J) Representative 2P images from the same regions in (G) and (H), respectively, showing that neurons are repeatedly identified at different times after implantation. Red dashed lines mark the edge of the probes. Arrows and dashed circles highlight the current and previous locations of neurons, respectively. See movies S4 and S5 for the full image stack. All scale bars, 50 μm.

References

    1. Gray C. M., Maldonado P. E., Wilson M., McNaughton B., Tetrodes markedly improve the reliability and yield of multiple single-unit isolation from multi-unit recordings in cat striate cortex. J. Neurosci. Methods 63, 43–54 (1995). - PubMed
    1. Nicolelis M. A., Dimitrov D., Carmena J. M., Crist R., Lehew G., Kralik J. D., Wise S. P., Chronic, multisite, multielectrode recordings in macaque monkeys. Proc. Natl. Acad. Sci. U.S.A. 100, 11041–11046 (2003). - PMC - PubMed
    1. Kipke D. R., Vetter R. J., Williams J. C., Hetke J. F., Silicon-substrate intracortical microelectrode arrays for long-term recording of neuronal spike activity in cerebral cortex. IEEE Trans. Neural Syst. Rehabil. Eng. 11, 151–155 (2003). - PubMed
    1. Rousche P. J., Normann R. A., Chronic recording capability of the utah intracortical electrode array in cat sensory cortex. J. Neurosci. Methods 82, 1–15 (1998). - PubMed
    1. Alivisatos A. P., Chun M., Church G. M., Greenspan R. J., Roukes M. L., Yuste R., The brain activity map project and the challenge of functional connectomics. Neuron 74, 970–974 (2012). - PMC - PubMed