

Deep reefs are not universal refuges: Reseeding potential varies among coral species
- PMID: 28246645
- PMCID: PMC5310828
- DOI: 10.1126/sciadv.1602373
Deep reefs are not universal refuges: Reseeding potential varies among coral species
Abstract
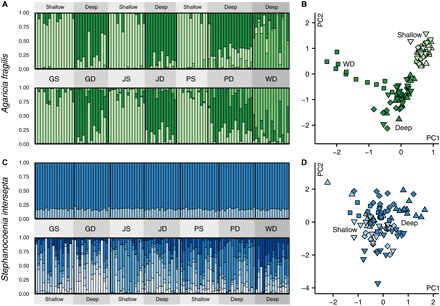
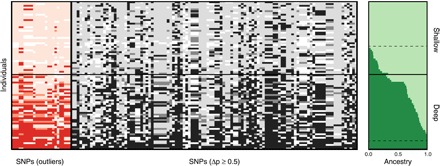
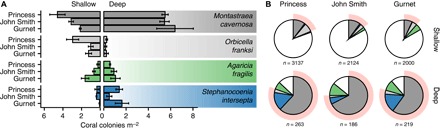
Deep coral reefs (that is, mesophotic coral ecosystems) can act as refuges against major disturbances affecting shallow reefs. It has been proposed that, through the provision of coral propagules, such deep refuges may aid in shallow reef recovery; however, this "reseeding" hypothesis remains largely untested. We conducted a genome-wide assessment of two scleractinian coral species with contrasting reproductive modes, to assess the potential for connectivity between mesophotic (40 m) and shallow (12 m) depths on an isolated reef system in the Western Atlantic (Bermuda). To overcome the pervasive issue of endosymbiont contamination associated with de novo sequencing of corals, we used a novel subtraction reference approach. We have demonstrated that strong depth-associated selection has led to genome-wide divergence in the brooding species Agaricia fragilis (with divergence by depth exceeding divergence by location). Despite introgression from shallow into deep populations, a lack of first-generation migrants indicates that effective connectivity over ecological time scales is extremely limited for this species and thus precludes reseeding of shallow reefs from deep refuges. In contrast, no genetic structuring between depths (or locations) was observed for the broadcasting species Stephanocoenia intersepta, indicating substantial potential for vertical connectivity. Our findings demonstrate that vertical connectivity within the same reef system can differ greatly between species and that the reseeding potential of deep reefs in Bermuda may apply to only a small number of scleractinian species. Overall, we argue that the "deep reef refuge hypothesis" holds for individual coral species during episodic disturbances but should not be assumed as a broader ecosystem-wide phenomenon.
Keywords: Coral reefs; RADseq; deep reef refuge hypothesis; divergent selection; endosymbiont contamination; mesophotic coral ecosystems; vertical connectivity.
Figures


Similar articles
-
Can mesophotic reefs replenish shallow reefs? Reduced coral reproductive performance casts a doubt.Ecology. 2018 Feb;99(2):421-437. doi: 10.1002/ecy.2098. Epub 2018 Jan 16. Ecology. 2018. PMID: 29205289
-
The role of deep reefs in shallow reef recovery: an assessment of vertical connectivity in a brooding coral from west and east Australia.Mol Ecol. 2011 Apr;20(8):1647-60. doi: 10.1111/j.1365-294X.2011.05050.x. Epub 2011 Mar 16. Mol Ecol. 2011. PMID: 21410573
-
Experimental evidence for reduced mortality of Agaricia lamarcki on a mesophotic reef.Mar Environ Res. 2018 Mar;134:37-43. doi: 10.1016/j.marenvres.2017.12.013. Epub 2017 Dec 18. Mar Environ Res. 2018. PMID: 29290384
-
Function and stability of mesophotic coral reefs.Trends Ecol Evol. 2024 Jun;39(6):585-598. doi: 10.1016/j.tree.2024.01.011. Epub 2024 Feb 26. Trends Ecol Evol. 2024. PMID: 38413283 Review.
-
A geological perspective on the degradation and conservation of western Atlantic coral reefs.Conserv Biol. 2016 Aug;30(4):706-15. doi: 10.1111/cobi.12725. Epub 2016 Apr 29. Conserv Biol. 2016. PMID: 27029403 Review.
Cited by
-
The relative influence of sea surface temperature anomalies on the benthic composition of an Indo-Pacific and Caribbean coral reef over the last decade.Ecol Evol. 2022 Sep 6;12(9):10.1002/ece3.9263. doi: 10.1002/ece3.9263. eCollection 2022 Sep. Ecol Evol. 2022. PMID: 36091340 Free PMC article.
-
The Rarity of Depth Refugia from Coral Bleaching Heat Stress in the Western and Central Pacific Islands.Sci Rep. 2019 Dec 23;9(1):19710. doi: 10.1038/s41598-019-56232-1. Sci Rep. 2019. PMID: 31873188 Free PMC article.
-
Photoacclimation and induction of light-enhanced calcification in the mesophotic coral Euphyllia paradivisa.R Soc Open Sci. 2019 Feb 6;6(2):180527. doi: 10.1098/rsos.180527. eCollection 2019 Feb. R Soc Open Sci. 2019. PMID: 30891251 Free PMC article.
-
Recovery of coral assemblages despite acute and recurrent disturbances on a South Central Pacific reef.Sci Rep. 2018 Jun 26;8(1):9680. doi: 10.1038/s41598-018-27891-3. Sci Rep. 2018. PMID: 29946062 Free PMC article.
-
Depth-structured lineages in the coral Stylophora pistillata of the Northern Red Sea.NPJ Biodivers. 2025 Apr 5;4(1):13. doi: 10.1038/s44185-025-00083-9. NPJ Biodivers. 2025. PMID: 40188306 Free PMC article.
References
-
- Pandolfi J. M., Bradbury R. H., Sala E., Hughes T. P., Bjorndal K. A., Cooke R. G., McArdle D., McClenachan L., Newman M. J. H., Paredes G., Warner R. R., Jackson J. B. C., Global trajectories of the long-term decline of coral reef ecosystems. Science 301, 955–958 (2003). - PubMed
-
- Hoegh-Guldberg O., Mumby P. J., Hooten A. J., Steneck R. S., Greenfield P., Gomez E., Harvell C. D., Sale P. F., Edwards A. J., Caldeira K., Knowlton N., Eakin C. M., Iglesias-Prieto R., Muthiga N., Bradbury R. H., Dubi A., Hatziolos M. E., Coral reefs under rapid climate change and ocean acidification. Science 318, 1737–1742 (2007). - PubMed
-
- Glynn P. W., Coral reef bleaching: Facts, hypotheses and implications. Global Change Biol. 2, 495–509 (1996).
-
- McCook L. J., Almany G. R., Berumen M. L., Day J. C., Green A. L., Jones G. P., Leis J. M., Planes S., Russ G. R., Sale P. F., Management under uncertainty: Guide-lines for incorporating connectivity into the protection of coral reefs. Coral Reefs 28, 353–366 (2009).
MeSH terms
LinkOut - more resources
Full Text Sources
Other Literature Sources
Molecular Biology Databases
