Review
. 2017 Apr;31(4):289-305.
doi: 10.1007/s40263-017-0415-2.

Effect of Fingolimod on Brain Volume Loss in Patients with Multiple Sclerosis

Affiliations
Review

Effect of Fingolimod on Brain Volume Loss in Patients with Multiple Sclerosis

Nicola De Stefano et al. CNS Drugs. 2017 Apr.

Abstract

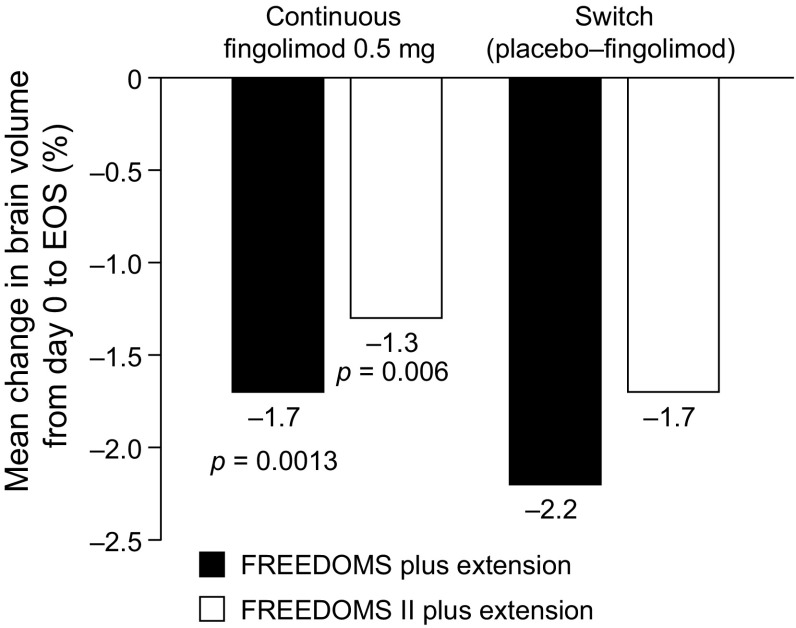
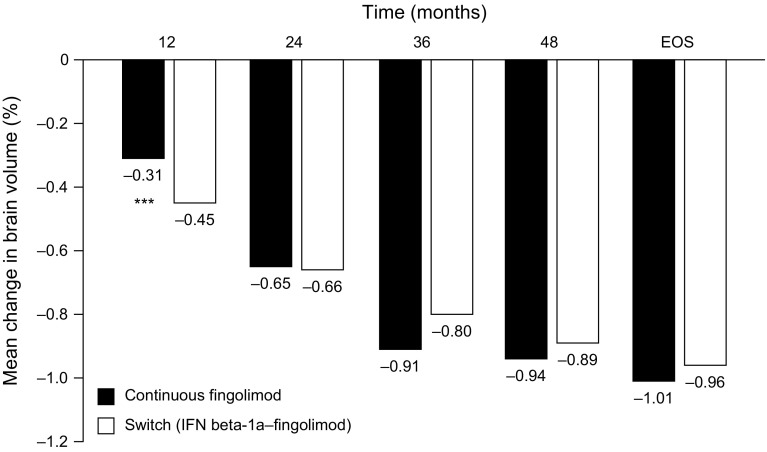
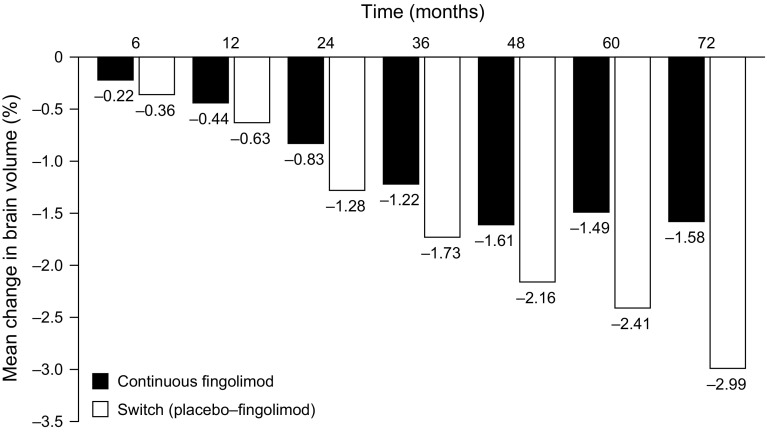
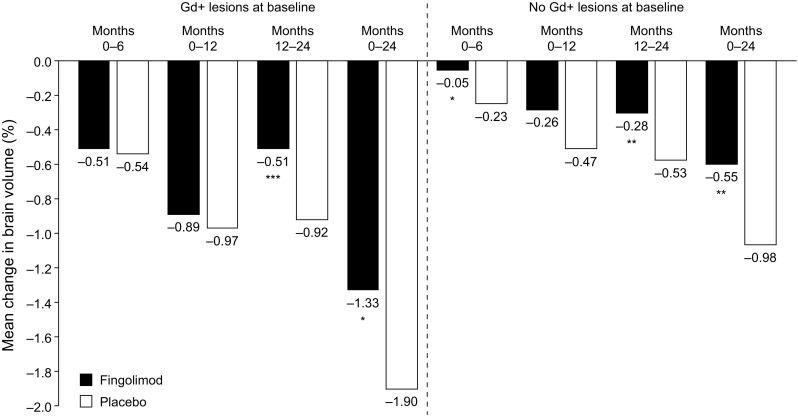
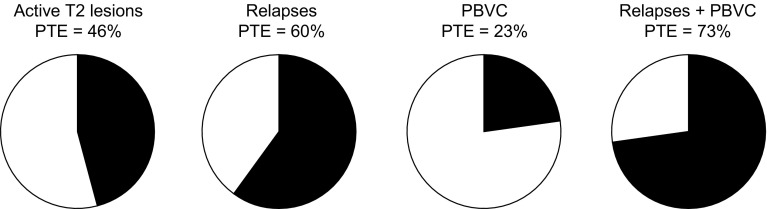
Brain atrophy occurs at a faster rate in patients with multiple sclerosis (MS) than in healthy individuals. In three randomized, controlled, phase III trials, fingolimod reduced the annual rate of brain volume loss (BVL) in patients with relapsing MS (RMS) by approximately one-third relative to that in individuals receiving placebo or intramuscular interferon beta-1a. Analysis of brain volume changes during study extensions has shown that this reduced rate of BVL is sustained in patients with RMS receiving fingolimod continuously. Subgroup analyses of the core phase III and extension studies have shown that reductions in the rate of BVL are observed irrespective of levels of inflammatory lesion activity seen by magnetic resonance imaging at baseline and on study; levels of disability at baseline; and treatment history. The rate of BVL in these studies was predicted independently by T2 lesion and gadolinium-enhancing lesion burdens at baseline, and correlations observed between BVL and increasing levels of disability strengthened over time. In another phase III trial in patients with primary progressive MS (PPMS), fingolimod did not reduce BVL overall relative to placebo; however, consistent with findings in RMS, there was a treatment effect on BVL in patients with PPMS with gadolinium-enhancing lesion activity at baseline. The association between treatment effects on BVL and future accumulation of disability argues in favor of measuring BVL on a more routine basis and with a more structured approach than is generally the case in clinical practice. Despite several practical obstacles, progress is being made in achieving this goal.


Conflict of interest statement

Funding

Editorial and medical writing support for the development of this manuscript was funded by Novartis Pharma AG. Journal open-access costs were also met by Novartis Pharma AG.

Conflicts of Interest

NDS has received honoraria from Biogen-Idec, Genzyme, Merck Serono, Novartis, Roche, and Teva for consulting services, speaking, and travel support. He serves on advisory boards for Merck Serono, Novartis, Biogen-Idec, Roche, and Genzyme, and he has received research grant support from the Italian MS Society. DS is an employee of Novartis Pharma AG. MHB has received institutional support from Biogen, Genzyme, Merck, Novartis, and Teva, and is a research consultant for Medical Safety Systems.

Figures

Fig. 1
Fig. 1
Mean percentage change in BV (measured with SIENA) from day 0 to EOS in FREEDOMS, FREEDOMS II and their extensions [27, 29]. All p values are versus the respective extension study switch group. BV brain volume, EOS end of study, SIENA Structural Image Evaluation, using Normalization, of Atrophy
Fig. 2
Fig. 2
Mean percentage change in BV (measured with SIENA) from core study baseline in the continuous and switched groups of patients participating in TRANSFORMS and its extension. In the switched group, patients were switched from IFN beta-1a IM to fingolimod at month 12. Adapted with permission from Cohen et al. [33]. BV brain volume, EOS end of study, IFN beta-1a interferon beta-1a, IM intramuscular, SIENA Structural Image Evaluation, using Normalization, of Atrophy; ***p < 0.001 versus switch group
Fig. 3
Fig. 3
Mean percentage change in BV (measured with SIENA) from baseline (core FREEDOMS and FREEDOMS II) in the continuous and switched groups of patients participating in the LONGTERMS extension study [34]. In the switched groups, patients were switched from placebo to fingolimod at month 24. BV brain volume, SIENA Structural Image Evaluation, using Normalization, of Atrophy
Fig. 4
Fig. 4
Mean percentage change in BV (measured with SIENA) from baseline in the 2-year FREEDOMS trial, in subgroups of patients with and without gadolinium-enhancing lesions at baseline [35]. BV brain volume, Gd+ gadolinium-enhancing, SIENA Structural Image Evaluation, using Normalization, of Atrophy; *p < 0.05, **p < 0.01, ***p < 0.001 versus placebo
Fig. 5
Fig. 5
Relationships between individual outcomes and disability progression in the FREEDOMS trial. Reproduced from Sormani et al. [50]. Pies show the PTE of fingolimod on disability progression at 2 years accounted for by its effect on active T2 lesions at 1 year, on relapses at 1 year, on PBVC at 2 years, and on relapses and PBVC combined, both of which were determined to be independent predictors of disability progression. PBVC percentage brain volume change, PTE proportion of treatment effect

Similar articles

Cited by

References

    1. Bermel RA, Bakshi R. The measurement and clinical relevance of brain atrophy in multiple sclerosis. Lancet Neurol. 2006;5:158–170. doi: 10.1016/S1474-4422(06)70349-0. - DOI - PubMed
    1. De Stefano N, Giorgio A, Battaglini M, et al. Assessing brain atrophy rates in a large population of untreated multiple sclerosis subtypes. Neurology. 2010;74:1868–1876. doi: 10.1212/WNL.0b013e3181e24136. - DOI - PubMed
    1. Rudick RA, Fisher E, Lee JC, Simon J, Jacobs L. Use of the brain parenchymal fraction to measure whole brain atrophy in relapsing–remitting MS. Multiple Sclerosis Collaborative Research Group. Neurology. 1999;53:1698–1704. doi: 10.1212/WNL.53.8.1698. - DOI - PubMed
    1. Anderson VM, Fox NC, Miller DH. Magnetic resonance imaging measures of brain atrophy in multiple sclerosis. J Magn Reson Imaging. 2006;23:605–618. doi: 10.1002/jmri.20550. - DOI - PubMed
    1. Barkhof F, Calabresi PA, Miller DH, Reingold SC. Imaging outcomes for neuroprotection and repair in multiple sclerosis trials. Nat Rev Neurol. 2009;5:256–266. doi: 10.1038/nrneurol.2009.41. - DOI - PubMed

MeSH terms