. 2017 Sep;118(9):2587-2598.
doi: 10.1002/jcb.25957. Epub 2017 May 3.

NSUN2-Mediated m5C Methylation and METTL3/METTL14-Mediated m6A Methylation Cooperatively Enhance p21 Translation

Affiliations

NSUN2-Mediated m5C Methylation and METTL3/METTL14-Mediated m6A Methylation Cooperatively Enhance p21 Translation

Qiu Li et al. J Cell Biochem. 2017 Sep.

Abstract

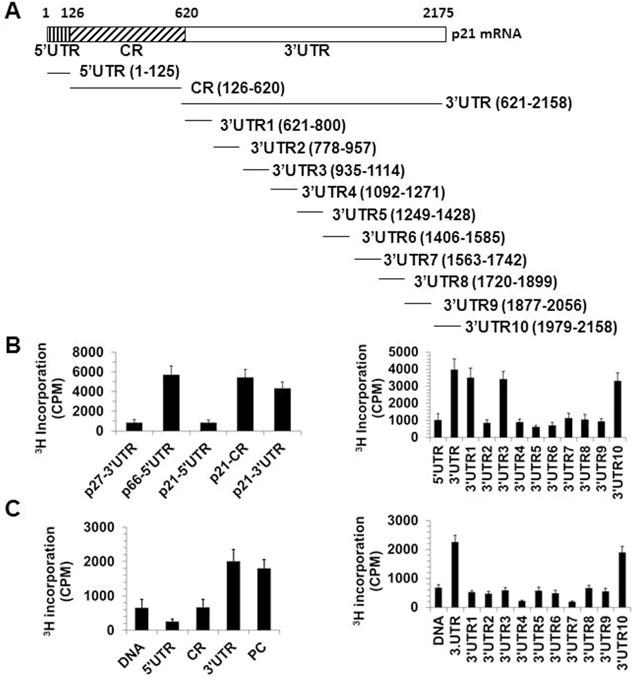
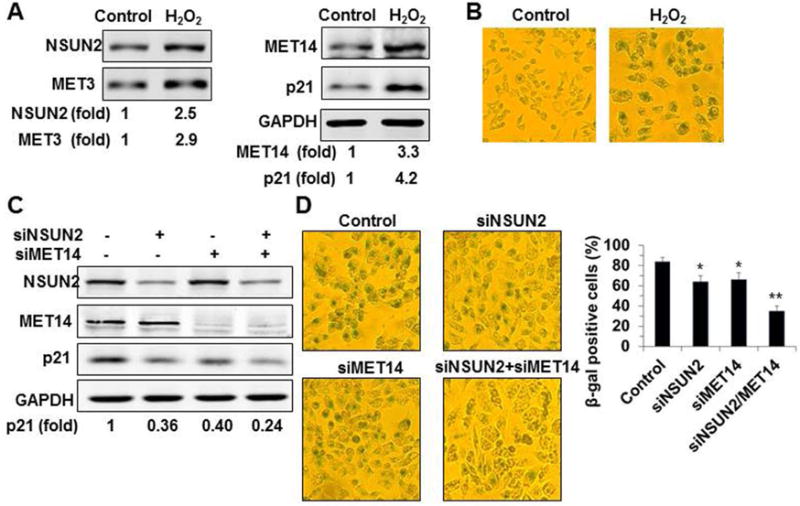
N6-methyladenosine (m6A) and m5C methylation are two major types of RNA methylation, but the impact of joint modifications on the same mRNA is unknown. Here, we show that in p21 3'UTR, NSUN2 catalyzes m5C modification and METTL3/METTL14 catalyzes m6A modification. Interestingly, methylation at m6A by METTL3/METTL14 facilitates the methylation of m5C by NSUN2, and vice versa. NSUN2-mediated m5C and METTL3/METTL14-mediated m6A methylation synergistically enhance p21 expression at the translational level, leading to elevated expression of p21 in oxidative stress-induced cellular senescence. Our findings on p21 mRNA methylation and expression reveal that joint m6A and m5C modification of the same RNA may influence each other, coordinately affecting protein expression patterns. J. Cell. Biochem. 118: 2587-2598, 2017. © 2017 Wiley Periodicals, Inc.

Keywords: METTL14; METTL3; NSUN2; TRANSLATIONAL REGULATION; p21 mRNA METHYLATION.


Conflict of interest statement

Conflicts of Interest

We declare no conflict of interest

Figures

Figure 1
Figure 1. NSUN2, METTL3, and METTL14 regulate p21 expression
(A) HeLa cells were transfected with siRNAs targeting NSUN2 (siNSUN2), METTL3 (siMET3), or METTL14 (siMET14) (left), or with a vector expressing flag-tagged NSUN2 (pNSUN2), METTL3 (pMET3), or METTL14 (pMET14) (right). Forty-eight hours later, cell lysates were prepared and subjected to Western blot analysis to assess the levels of proteins NSUN2, METTL3, METTL14, p21, and GAPDH. Data are representative from three independent experiments. (B) HCT116 p53−/− cells were transfected with siRNAs targeting NSUN2, METTL3 (siMET3), or METTL14 (siMET14). Forty-eight hours later, cell lysates were prepared and subjected to Western blot analysis to assess the levels of proteins NSUN2, METTL3, METTL14, p21, and GAPDH. Data are representative from three independent experiments. (C) RNA was prepared from cells described in Fig. 1B and subjected to real-time qPCR to assess p21 mRNA levels. Data represent the mean ±SD from 3 independent experiments. (D) Cell lysates were prepared from cells silenced with METTL3 (siMET3), as described in Fig. 1A. CDK1, p27, p53, and SHC protein levels were determined by Western blot analysis.
Figure 2
Figure 2. NSUN2 and METTL3 or METTL14 synergistically enhance p21 expression
(A) Upper, HCT116 p53−/− cells were transfected with NSUN2 siRNA, METTL3 siRNA (siMET3), or with both (siNSUN2 + siMET3). Forty-eight h later, cell lysates were prepared and subjected to Western blot analysis to assess the levels of NSUN2, METTL3, p21, and GAPDH. Bottom, data are means±SD from 3 independent experiments; significance is analyzed by Student’s t test (**,p<0.01; *, p<0.05). Data are representatives of 3 independent experiments. (B) Upper, HCT116 p53−/− cells were transfected with NSUN2 siRNA, METTL14 siRNA (siMET14), or with both (siNSUN2+siMET14). Forty-eight h later, cell lysates were prepared and subjected to Western blot analysis to assess the levels of NSUN2, METTL14, p21, and GAPDH. Bottom, data are means±SD from 3 independent experiments; significance is analyzed by Student’s t test (*, p<0.05). (C, D) Real-time qPCR analysis was used for analyzing p21 mRNA levels in cells described in Fig. 2A and Fig. 2B, respectively. Data are means±SD from 3 independent experiments.
Figure 3
Figure 3. NSUN2 and METTL3 or METTL14 synergistically enhance the activity of pGL3-derived reporter bearing p21 3′UTR
(A) Schematic representation depicting the pGL3-derived reporters used for reporter gene assays. (B, C, D) HCT116 p53−/− cells were transfected with each of the reporters depicted in Fig. 3A together with a pRL-CMV control reporter. Twenty-four h later, cells were further transfected with a siRNA targeting NSUN2 (B), METTL3 (C), or METTL14 (D), or with a control siRNA (Control) and cultured for an additional 48 h. Firefly luciferase activity against Renilla luciferase activity was analyzed. Data represent the means ± SD from 3 independent experiments; significance was analyzed by Student’s t tes (**, p<0.01)t. (E) HCT116 p53−/− cells were co-transfected with a pGL3-3′UTR reporter or a pGL3 vector and a pRL-CMV control reporter. Twenty-four h later, cells were further transfected with NSUN2 siRNA (siNSUN2), METTL3 siRNA (siMET3), or NSUN2 siRNA plus METTL3 siRNA (siNSUN2 + siMET14) and cultured for an additional 48h. Firefly luciferase activity against Renilla luciferase activity was analyzed. Data represent the means ± SD from 3 independent experiments; significance was analyzed by Student’s t test (**, p<0.01). (F) HCT116 p53−/− cells were co-transfected with a pGL3-3′UTR reporter or a pGL3 vector and a pRL-CMV control reporter. Twenty-four h later, cells were further transfected with NSUN2 siRNA (siNSUN2), METTL14 siRNA (siMET14), or NSUN2 siRNA plus METTL14 siRNA (siNSUN2+siMET14) and cultured for an additional 48 h. Firefly luciferase activity against Renilla luciferase activity was analyzed. Data represent the means ± SD from 3 independent experiments; significance was analyzed by Student’s t test (**, p<0.01).
Figure 4
Figure 4. NSUN2 and METTL3/METTL14 methylate p21 mRNA in vitro
(A) Schematic depiction of the p21 mRNA fragments used for in vitro methylation assays. (B) In vitro methylation assays by using purified his-NSUN2 and the fragments shown in Fig. 4A. Incorporation of 3H-labeled SAM into p21 5′UTR, CR, and 3′UTR fragments (left) as well as 5′UTR, 3′UTR, 3′UTR1, 3′UTR2, 3′UTR3, 3′UTR4, 3′UTR5, 3′UTR6, 3′UTR7, 3′UTR8, 3′UTR9, and 3′UTR10 fragments (right). The incorporation of 3H-labeled SAM into p27 3′UTR and SHC 5′UTR (p66-5′UTR) served as negative control or positive control, respectively. (C) In vitro methylation assays by using immunoprecipitated flag-METTL3 and flag-METTL14 as well as the fragments depicted in Fig. 4A. Incorporation of 3H-labeled SAM into p21 cDNA (DNA), 5′UTR, CR, and 3′UTR fragments (left) as well as p21 cDNA (DNA), 3′UTR, 3′UTR1, 3′UTR2, 3′UTR3, 3′UTR4, 3′UTR5, 3′UTR6, 3′UTR7, 3′UTR8, 3′UTR9, and 3′UTR10 fragments (right). The incorporation of 3H-labeled SAM into p21 cDNA (DNA) and RNA fragment ACGAGUCCUGGACUGAAACGGACUUGU served as a negative control and a positive control (PC), respectively.
Figure 5
Figure 5. Measurement of m5C or m6A in NSUN2 or METTL3/METTL14 methylated fragments
(A) p21 CR and 3′UTR fragments were in vitro-methylated by purified his-NSUN2 and non-isotopic SAM (+NSUN2) or kept untreated (−NSUN2), whereupon these fragments were subjected to HPLC-MS analysis to determine the formation of m5C. Data represent the peak value of m5C. (B) left, p21 3′UTR10 fragment was in vitro methylated by non-isotopic SAM and subjected to bisulfite RNA sequencing analysis to identify the methylation sites, as described in “Materials and Methods”. The percentage of methylation and the number of positive colones from the total colones sequenced are indicated. Right, in vitro methylation assays by using purified his-NSUN2 and fragments 5′UTR, 3′UTR10, and 3′UTR10 mutating C2079 (C-G, 3′UTRCm). (C) left, p21 3′UTR10 fragment was in vitro-methylated by immunoprecipitated flag-METTL3/flag-METTL14 and non-isotopic SAM (+MET3/MET14) or kept untreated (-MET3/MET14), whereupon these fragments were subjected to HPLC-MS analysis to determine the formation of m6A. The peak values of m6A are indicated. Right, in vitro methylation assays by using immunoprecipitated flag-MET3/flag-MET14 as well as 3′UTR10 and its variants m1-m5.
Figure 6
Figure 6. NSUN2 and METTL3/METTL14 cooperatively methylate p21 3′UTR and thereby enhancing the translation of p21
(A) p21 3′UTR fragment was in vitro-methylated by NSUN2 (Pre-m5C) and non-isotopic SAM or kept untreated (Control). These fragments were further in vitro-methylated by flag-METTL3/METTL14 and 3H-labeled SAM. Data represent the means ± SD from 3 independent experiments; significance was analyzed by Student′s t test (**, p<0.01). (B) p21 3′UTR3 or 3′UTR10 fragment was in vitro methylated by METTL3/METTL14 and non-isotopic SAM (Pre-m6A) or kept untreated (Control). These fragments were further in vitro methylated by flag-METTL3/METTL14 and 3H-labeled SAM. Data represent the means ± SD from 3 independent experiments; significance was analyzed by Student′s t test (**, p<0.01). (C) Luc-3′UTR10 chimeric transcript transcribed from pGL3-3′UTR10 reporter was methylated by NSUN2, METTL3/METTL14 (MET3/14), NSUN2 + METTL3/METTL14 (NSUN2 + MET3/14), or kept untreated (Control). These transcripts then were used for in vitro translation assays. Luciferase activity was represented to reflect the efficiency of translation. (D) Luc-3′UTR10 (3′UTR10) or LUC-3′UTR10Cm (3′UTR10Cm, mutating C2079) was methylated in vitro by NSUN2 (Met) or kept untreated (Unmet), whereupon in vitro translation assays were performed. (E) Luc-3′UTR10 or Luc-3′UTR10Am was methylated by METTL3/METTL14 in vitro (Met) or kept untreated (Unmet), whereupon in vitro translation assays were performed. (F) Luc-3′UTR10, Luc-3′UTR10Am, or Luc-3′UTRCm was methylated by NSUN2+METTL3/METTL14 in vitro (Met) or kept untreated (Unmet), whereupon in vitro translation assays were performed. Data in C-F represent the means ± SD from 3 independent experiments; significance was analyzed by Student′s t test (**, p<0.01; *, p<0.05).
Figure 7
Figure 7. NSUN2 and METTL3/METTL14 cooperatively methylate p21 3′UTR in vivo
(A) top, RNA isolated from HCT116 p53−/− cells was subjected to IP assays by using an antibody recognizing m6A or a control IgG antibody. The levels of p21 mRNA in the IP materials normalized against were analyzed by RT-qPCR analysis. Data represent the means ± SD from 3 independent experiments. Bottom, HCT116 p53−/− cells were transfected with siRNAs targeting NSUN2 (siNSUN2) or METTL14 (siMET14) or both (siNSUN2+siMET14). Forty-eight h later, RNA was prepared and subjected to IP assays by using m6A antibody. The levels of p21 mRNA were determined by RT-qPCR analysis. Data represent the means ±SD from 3 independent experiments; significance was analyzed by Student’s t test (*, p<0.05; **, p<0.01). (B) HCT116 p53−/− cells were transfected with a pGL3-3′UTR vector. Twenty four h later, cells were further transfected with a NSUN2 siRNA, METTL14 siRNA, NSUN2 and METTL14 siRNA, or kept untreated (Control) and cultured for additional 48 h. RNA was isolated and subjected to bisulfite RNA sequencing to assess the methylation of C2079 (m5C). The percent of methylation and the number of positive colons from the total colons sequenced are indicated.
Figure 8
Figure 8. NSUN2 and METTL3/METTL14 synergistically enhance the expression of p21 in oxidative stress-induced cell senescence
(A) HCT116 p53−/− cells were exposed to H2O2 (50 μM) for 48 h. The levels of NSUN2, METTL3, METTL14, p21, and GAPDH were analyzed by Western blot analysis. Data are representatives from 3 independent experiments. (B) The cells described in Fig. 8A were subjected to SA-β-gal analysis and the percentage of SA-β-gal-positive cells was counted. Data are representatives of 3 independent experiments. (C) HCT116 p53−/− cells were transfected with siRNAs to silence NSUN2 or METTL14 (siMET14) or both proteins. Twenty-four h later, cells were exposed to H2O2 (50 μM) and cultured for additional 48 h. The levels of NSUN2, METTL14, p21, and GAPDH were analyzed by Western blot analysis. Data are representatives of 3 independent experiments. (D) Cells described in Fig. 8C were subjected to SA-β-gal analysis. Data represent the means ± SD from 3 independent experiments and statistical significance was analyzed by Student’s t test (*, p<0.05; **, p<0.01).

References

    1. Blanco S, Bandiera R, Popis M, Hussain S, Lombard P, Aleksic J, Sajini A, Tanna H, Cortés-Garrido R, Gkatza N, Dietmann S, Frye M. Stem cell function and stress response are controlled by protein synthesis. Nature. 2016;534:335–40. - PMC - PubMed
    1. Blanco S, Kurowski A, Nichols J, Watt FM, Benitah SA, Frye M. The RNA-methyltransferase Misu (NSun2) poises epidermal stem cells to differentiate. PLoS Genet. 2011;7(12):e1002403. doi: 10.1371/journal.pgen.1002403. Epub 2011 Dec 1. - DOI - PMC - PubMed
    1. Björk GR, Ericson JU, Gustafsson CE, Hagervall TG, Jönsson YH, Wikström PM. Transfer RNA modification. Annu Rev Biochem. 1987;56:263–287. - PubMed
    1. Cai X, Hu Y, Tang H, Hu H, Pang L, Xing J, Liu Z, Luo Y, Jiang B, Liu T, Gorospe M, Chen C, Wang W. RNA methyltransferase NSUN2 promotes stress-induced HUVEC senescence. Oncotarget. 2016;7:19099–110. - PMC - PubMed
    1. Carroll SM, Narayan P, Rottman FM. N6-methyladenosine residues in an intron-specific region of prolactin pre-mRNA. Mol Cell Biol. 1990;10:4456–4465. - PMC - PubMed

MeSH terms

LinkOut - more resources