

Mass Spectrometric Immunoassays in Characterization of Clinically Significant Proteoforms
- PMID: 28248223
- PMCID: PMC5217360
- DOI: 10.3390/proteomes4010013
Mass Spectrometric Immunoassays in Characterization of Clinically Significant Proteoforms
Abstract
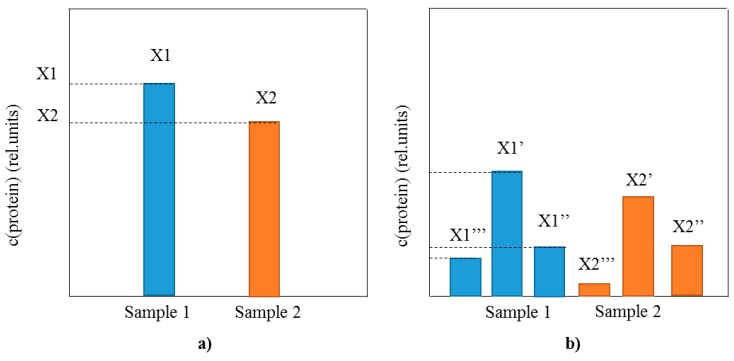
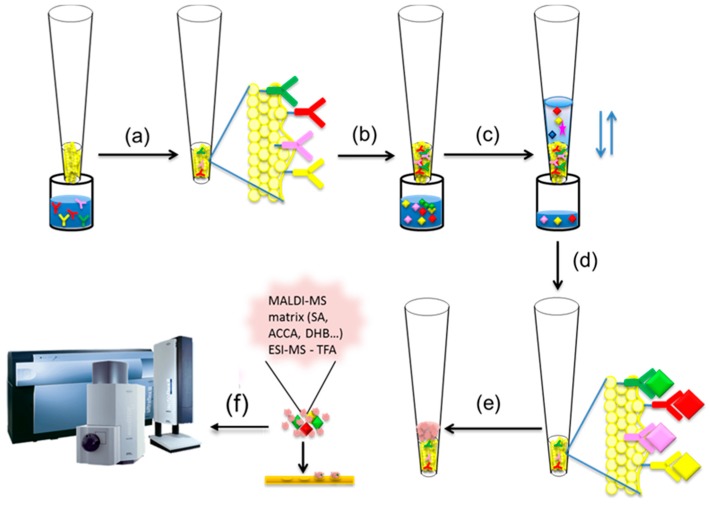
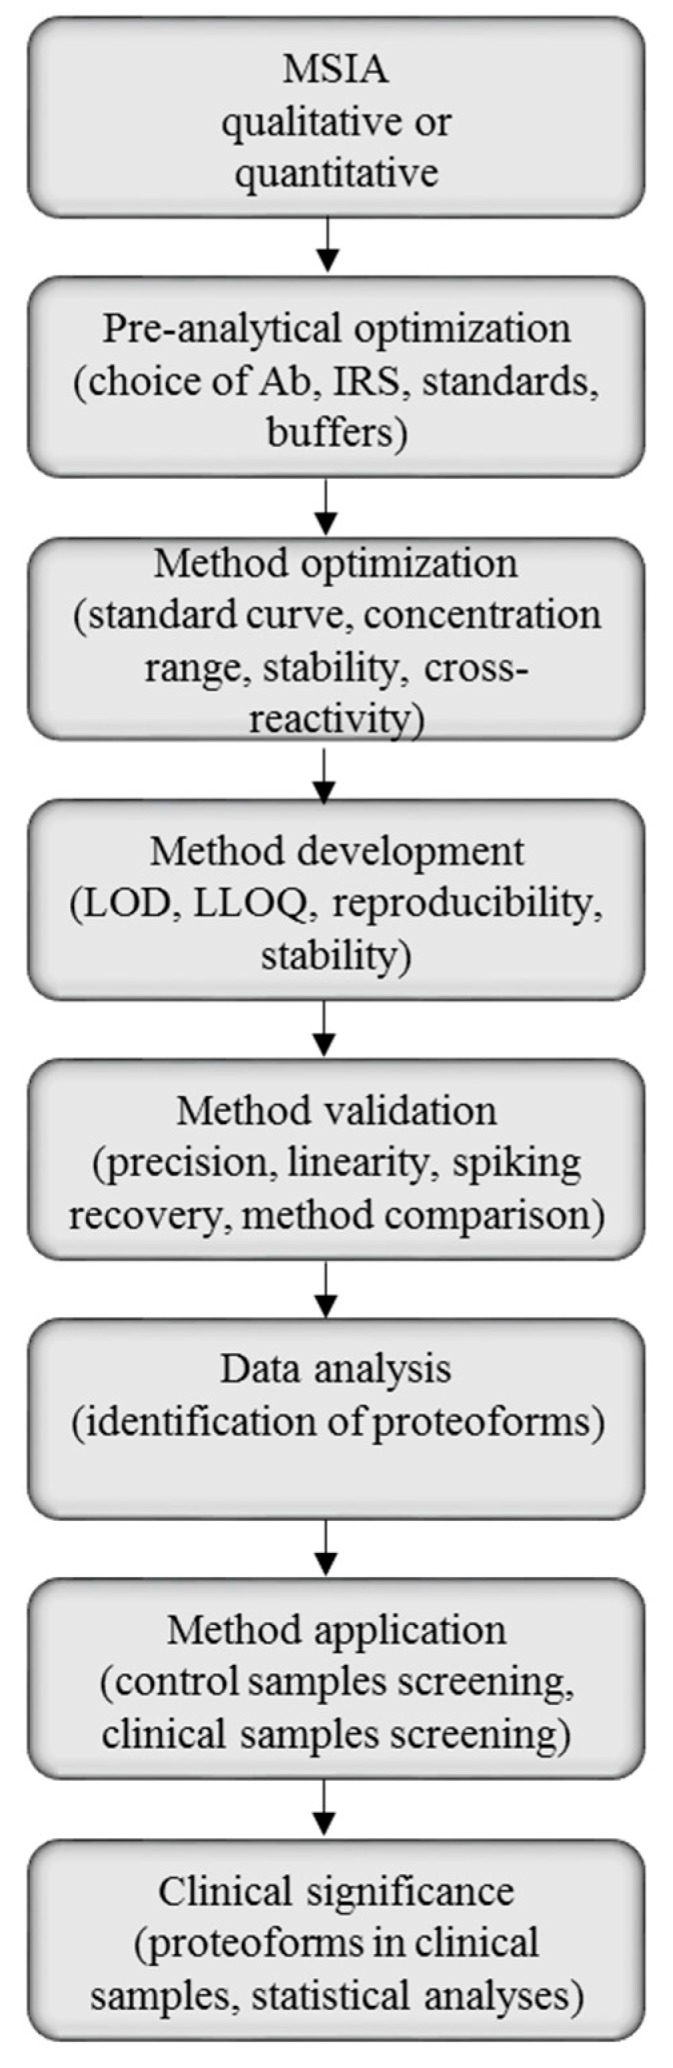
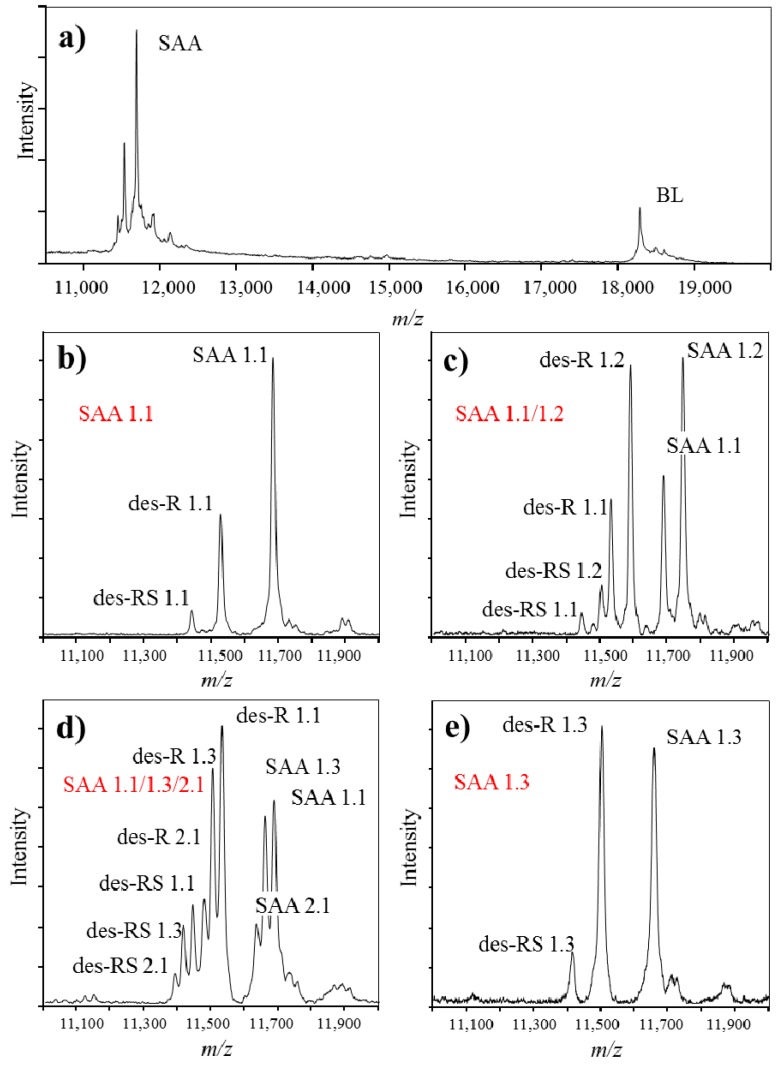
Proteins can exist as multiple proteoforms in vivo, as a result of alternative splicing and single-nucleotide polymorphisms (SNPs), as well as posttranslational processing. To address their clinical significance in a context of diagnostic information, proteoforms require a more in-depth analysis. Mass spectrometric immunoassays (MSIA) have been devised for studying structural diversity in human proteins. MSIA enables protein profiling in a simple and high-throughput manner, by combining the selectivity of targeted immunoassays, with the specificity of mass spectrometric detection. MSIA has been used for qualitative and quantitative analysis of single and multiple proteoforms, distinguishing between normal fluctuations and changes related to clinical conditions. This mini review offers an overview of the development and application of mass spectrometric immunoassays for clinical and population proteomics studies. Provided are examples of some recent developments, and also discussed are the trends and challenges in mass spectrometry-based immunoassays for the next-phase of clinical applications.
Keywords: biomarkers; immunoaffinity; mass spectrometry; posttranslational modifications; top-down analysis.
Figures
Similar articles
-
Development of quantitative mass spectrometric immunoassay for serum amyloid A.Biomarkers. 2016 Dec;21(8):743-751. doi: 10.1080/1354750X.2016.1201533. Epub 2016 Jul 22. Biomarkers. 2016. PMID: 27308834 Free PMC article.
-
Mass spectrometric immunoassays for discovery, screening and quantification of clinically relevant proteoforms.Bioanalysis. 2016 Aug;8(15):1623-1633. doi: 10.4155/bio-2016-0060. Epub 2016 Jul 11. Bioanalysis. 2016. PMID: 27396364 Free PMC article. Review.
-
Quantitative mass spectrometric immunoassay for the chemokine RANTES and its variants.J Proteomics. 2015 Feb 26;116:15-23. doi: 10.1016/j.jprot.2014.12.011. Epub 2014 Dec 27. J Proteomics. 2015. PMID: 25549571 Free PMC article.
-
Mass spectrometry-based immunoassays for the next phase of clinical applications.Expert Rev Proteomics. 2006 Dec;3(6):631-40. doi: 10.1586/14789450.3.6.631. Expert Rev Proteomics. 2006. PMID: 17181477 Review.
-
Profiling proteoforms: promising follow-up of proteomics for biomarker discovery.Expert Rev Proteomics. 2014 Feb;11(1):121-9. doi: 10.1586/14789450.2014.878652. Expert Rev Proteomics. 2014. PMID: 24437377 Review.
Cited by
-
Within-person reproducibility of proteoforms related to inflammation and renal dysfunction.Sci Rep. 2022 May 6;12(1):7426. doi: 10.1038/s41598-022-11520-1. Sci Rep. 2022. PMID: 35523986 Free PMC article.
-
Mass Spectrometric Studies of Apolipoprotein Proteoforms and Their Role in Lipid Metabolism and Type 2 Diabetes.Proteomes. 2017 Oct 15;5(4):27. doi: 10.3390/proteomes5040027. Proteomes. 2017. PMID: 29036931 Free PMC article. Review.
-
Conjugating immunoassays to mass spectrometry: Solutions to contemporary challenges in clinical diagnostics.Trends Analyt Chem. 2020 Nov;132:116064. doi: 10.1016/j.trac.2020.116064. Epub 2020 Oct 7. Trends Analyt Chem. 2020. PMID: 33046944 Free PMC article. Review.
-
New Multiscale Characterization Methodology for Effective Determination of Isolation-Structure-Function Relationship of Extracellular Vesicles.Front Bioeng Biotechnol. 2021 Jun 7;9:669537. doi: 10.3389/fbioe.2021.669537. eCollection 2021. Front Bioeng Biotechnol. 2021. PMID: 34164385 Free PMC article.
-
The Time Has Come for Quantitative Protein Mass Spectrometry Tests That Target Unmet Clinical Needs.J Am Soc Mass Spectrom. 2021 Mar 3;32(3):636-647. doi: 10.1021/jasms.0c00379. Epub 2021 Feb 1. J Am Soc Mass Spectrom. 2021. PMID: 33522792 Free PMC article.
References
-
- Flodin M., Jonsson A.S., Hansson L.O., Danielsson L.A., Larsson A. Evaluation of gentian cystatin c reagent on Abbott Ci8200 and calculation of glomerular filtration rate expressed in mL/min/1.73 m2 from the cystatin c values in mg/L. Scand. J. Clin. Lab. Investig. 2007;67:560–567. doi: 10.1080/00365510601187773. - DOI - PubMed
Publication types
Grants and funding
LinkOut - more resources
Full Text Sources
Other Literature Sources
