Review
. 2016 Nov 29;4(4):36.
doi: 10.3390/proteomes4040036.

Let There Be Light!

Affiliations
Review

Let There Be Light!

Doroteya Raykova et al. Proteomes. .

Abstract

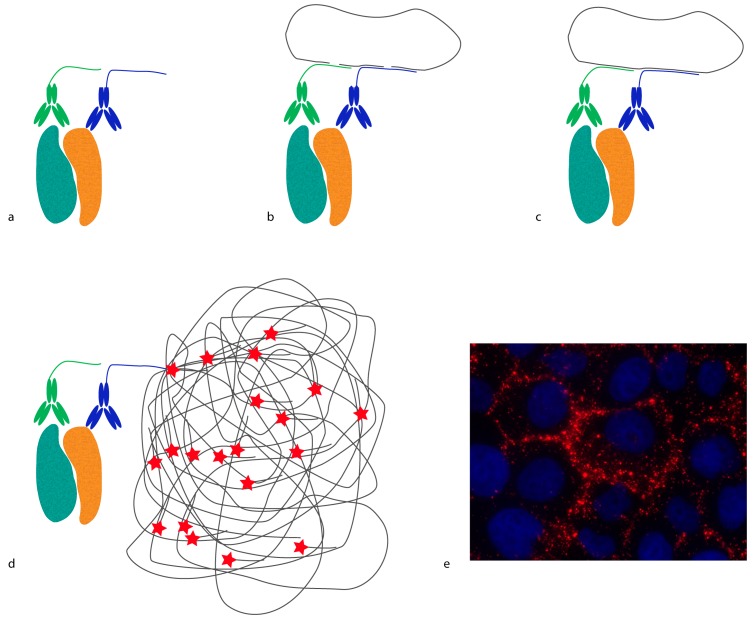
The invention of the microscope has been fundamental for the understanding of tissue architecture and subcellular structures. With the advancement of higher magnification microscopes came the development of various molecular biology tools such as Förster resonance energy transfer (FRET) and in situ proximity ligation assay (in situ PLA) to monitor protein interactions. Microscopy has become a commonly used method for the investigation of molecular events within the cell, for the identification of key players in signaling networks, and the activation of these pathways. Multiple approaches are available for functional analyses in single cells. They provide information not only on the localization of proteins at a given time point, but also on their expression levels and activity states, allowing us to pinpoint hallmarks of different cellular identities within tissues in health and disease. Clever solutions to increase the sensitivity of molecular tools, the possibilities for multiplexing, as well as image resolution have recently been introduced; however, these methods have their pros and cons. Therefore, one needs to carefully consider the biological question of interest along with the nature of the sample before choosing the most suitable method or combination of methods. Herein, we review a few of the most exciting microscopy-based molecular techniques for proteomic analysis and cover the benefits as well as the disadvantages of their use.

Keywords: FRET; high resolution microscopy; in situ PLA; post-translational modifications; protein–protein interactions; proxHCR.


Conflict of interest statement

The authors declare no conflict of interest.

Figures

Figure 1
Figure 1
Förster resonance energy transfer (FRET). (a) Fluorescent proteins (proteins in teal and ochre; donor molecule in green, and acceptor in red) fused to the protein of interest are expressed ectopically in the cell. In the absence of interaction between the proteins, no energy transfer occurs; (b) If interaction occurs, the two fluorescent proteins come in close proximity to each other. FRET can occur due to energy transfer from the donor to the acceptor molecule; (c) Depending on the readout, a heat-map can be generated, showing regions of high and low interaction.
Figure 2
Figure 2
In situ proximity ligation assay (in situ PLA). (a) Recognition: A pair of antibodies conjugated to oligonucleotides (proximity probes) binds a protein complex (teal and ochre); (b) Hybridization: two circularization oligonucleotides (grey lines) with regions complementary to parts of the proximity probes’ oligonucleotide sequences are added; (c) Ligation: The circularization oligonucleotides are joined by ligation to form a complete DNA circle; (d) Rolling circle amplification (RCA): The ligated circle serves as amplification template where one of the proximity probes acts as a primer for phi29 polymerase. As a result, an RCA product is synthesized: a single-stranded DNA molecule attached to the proximity probe that contains hundreds of repeated sequences required for detection. Detection is achieved by the addition of a complementary detection oligonucleotide labeled with a fluorophore (red star); (e) In situ PLA image depicting the interaction between E-cadherin and β-catenin in MCF-10 cells. The in situ PLA signals appear as discrete red dots in the areas of cell-to-cell contact, and the nucleus is visualized by Hoechst staining (blue).
Figure 3
Figure 3
Proximity-dependent initiation of hybridization chain reaction (proxHCR). (a) Two proximity probes—i.e., antibodies conjugated to proximity hairpins (PH1 in green and PH2 in blue)—bind a protein complex (teal and ochre). Subsequently, an activator oligonucleotide is added (red line); (b) The activator breaks the secondary structure of PH1 open and binds to it, releasing its 3′-end; (c) The open PH1 can now invade PH2, thereby liberating its 3′-end. The latter can initiate the hybridization chain reaction (HCR); (d) The 3′ initiator sequence invades a fluorophore-labelled hairpin (teal line with a red star); (e) which then commences a chain reaction of invading and activating other such hairpins; (f) The reaction continues until depletion of the available fluorescent hairpins; (g) ProxHCR microscopy image: detection of interaction between E-cadherin and β-catenin in HaCaT cells. ProxHCR signal is shown in red and nuclei are stained in blue with Hoechst.
Figure 3
Figure 3
Proximity-dependent initiation of hybridization chain reaction (proxHCR). (a) Two proximity probes—i.e., antibodies conjugated to proximity hairpins (PH1 in green and PH2 in blue)—bind a protein complex (teal and ochre). Subsequently, an activator oligonucleotide is added (red line); (b) The activator breaks the secondary structure of PH1 open and binds to it, releasing its 3′-end; (c) The open PH1 can now invade PH2, thereby liberating its 3′-end. The latter can initiate the hybridization chain reaction (HCR); (d) The 3′ initiator sequence invades a fluorophore-labelled hairpin (teal line with a red star); (e) which then commences a chain reaction of invading and activating other such hairpins; (f) The reaction continues until depletion of the available fluorescent hairpins; (g) ProxHCR microscopy image: detection of interaction between E-cadherin and β-catenin in HaCaT cells. ProxHCR signal is shown in red and nuclei are stained in blue with Hoechst.

Similar articles

Cited by

References

    1. Caprioli R.M., Farmer T.B., Gile J. Molecular imaging of biological samples: Localization of peptides and proteins using MALDI-TOF MS. Anal. Chem. 1997;69:4751–4760. doi: 10.1021/ac970888i. - DOI - PubMed
    1. Angelo M., Bendall S.C., Finck R., Hale M.B., Hitzman C., Borowsky A.D., Levenson R.M., Lowe J.B., Liu S.D., Zhao S., et al. Multiplexed ion beam imaging of human breast tumors. Nat. Med. 2014;20:436–442. doi: 10.1038/nm.3488. - DOI - PMC - PubMed
    1. Giesen C., Wang H.A., Schapiro D., Zivanovic N., Jacobs A., Hattendorf B., Schuffler P.J., Grolimund D., Buhmann J.M., Brandt S., et al. Highly multiplexed imaging of tumor tissues with subcellular resolution by mass cytometry. Nat. Methods. 2014;11:417–422. doi: 10.1038/nmeth.2869. - DOI - PubMed
    1. Uhlen M., Bjorling E., Agaton C., Szigyarto C.A., Amini B., Andersen E., Andersson A.C., Angelidou P., Asplund A., Asplund C., et al. A human protein atlas for normal and cancer tissues based on antibody proteomics. Mol. Cell. Proteom. 2005;4:1920–1932. doi: 10.1074/mcp.M500279-MCP200. - DOI - PubMed
    1. Uhlen M., Fagerberg L., Hallstrom B.M., Lindskog C., Oksvold P., Mardinoglu A., Sivertsson A., Kampf C., Sjostedt E., Asplund A., et al. Tissue-based map of the human proteome. Science. 2015;347:1260419. doi: 10.1126/science.1260419. - DOI - PubMed

LinkOut - more resources