. 2017 Mar 1:8:14760.
doi: 10.1038/ncomms14760.

Clonal selection in the human Vδ1 T cell repertoire indicates γδ TCR-dependent adaptive immune surveillance

Affiliations

Clonal selection in the human Vδ1 T cell repertoire indicates γδ TCR-dependent adaptive immune surveillance

Martin S Davey et al. Nat Commun. .

Abstract

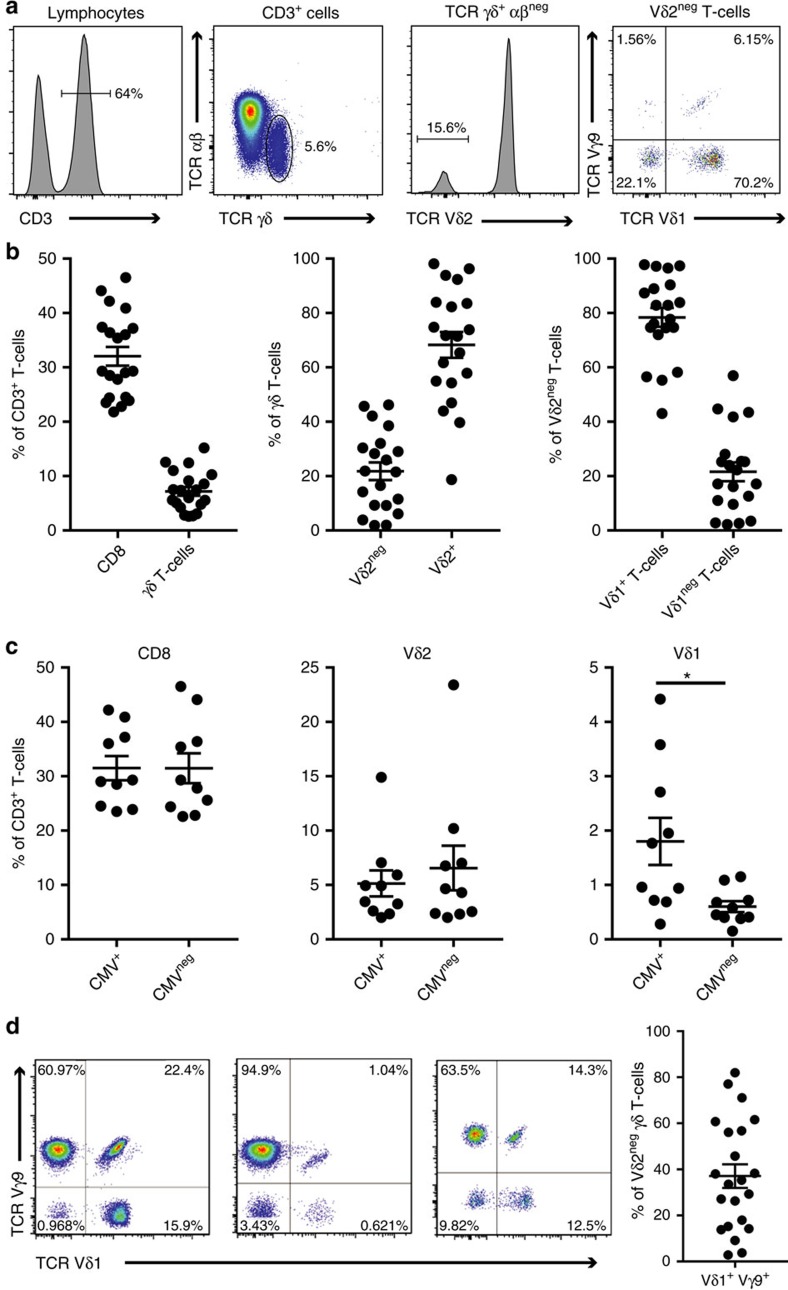
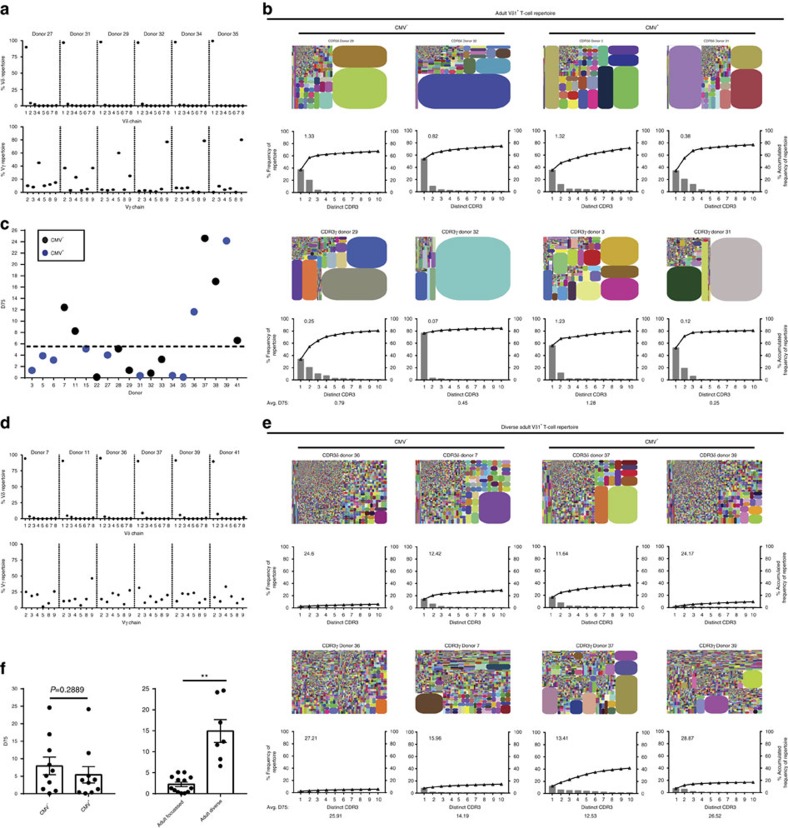
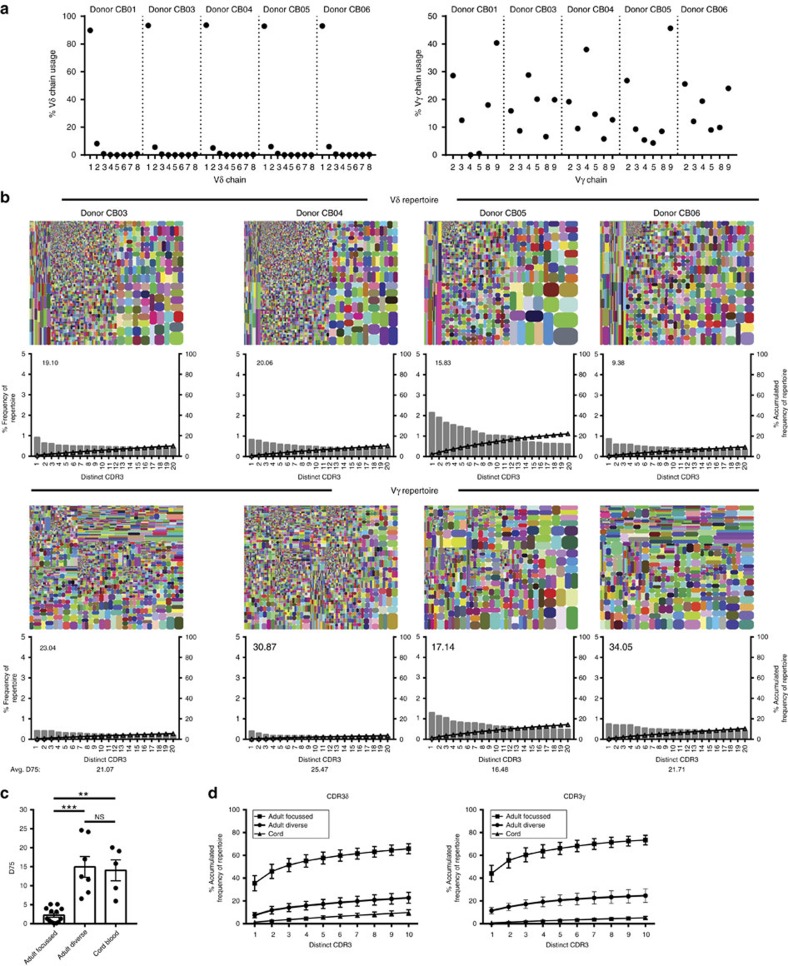
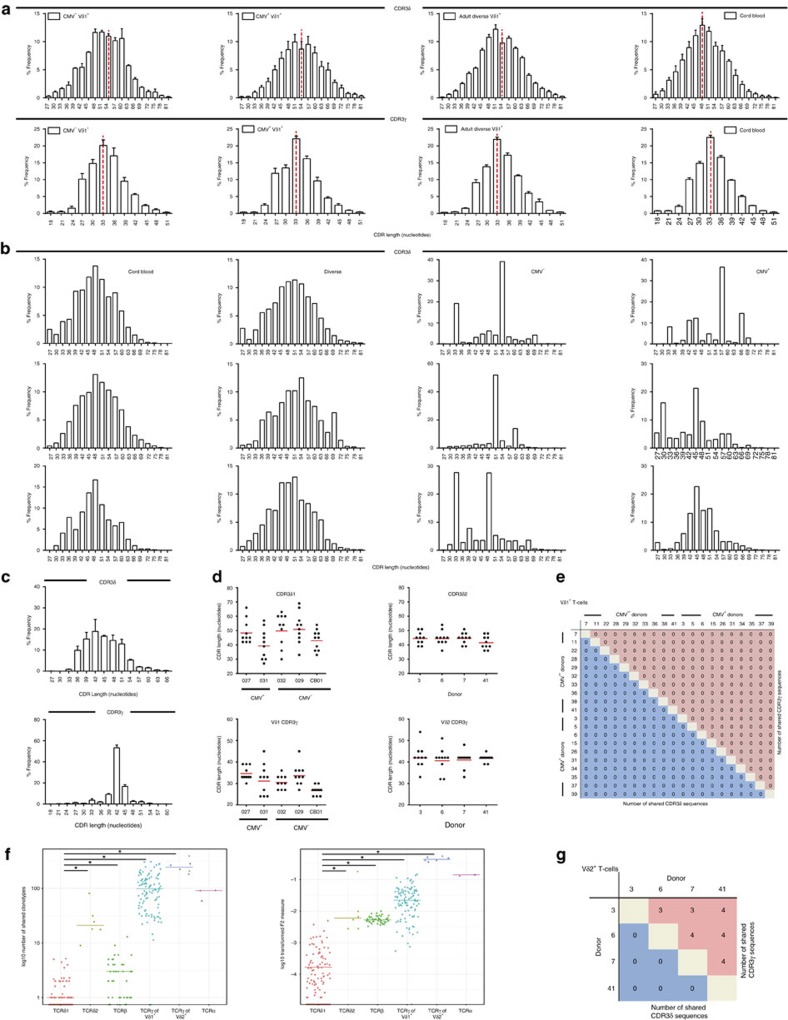
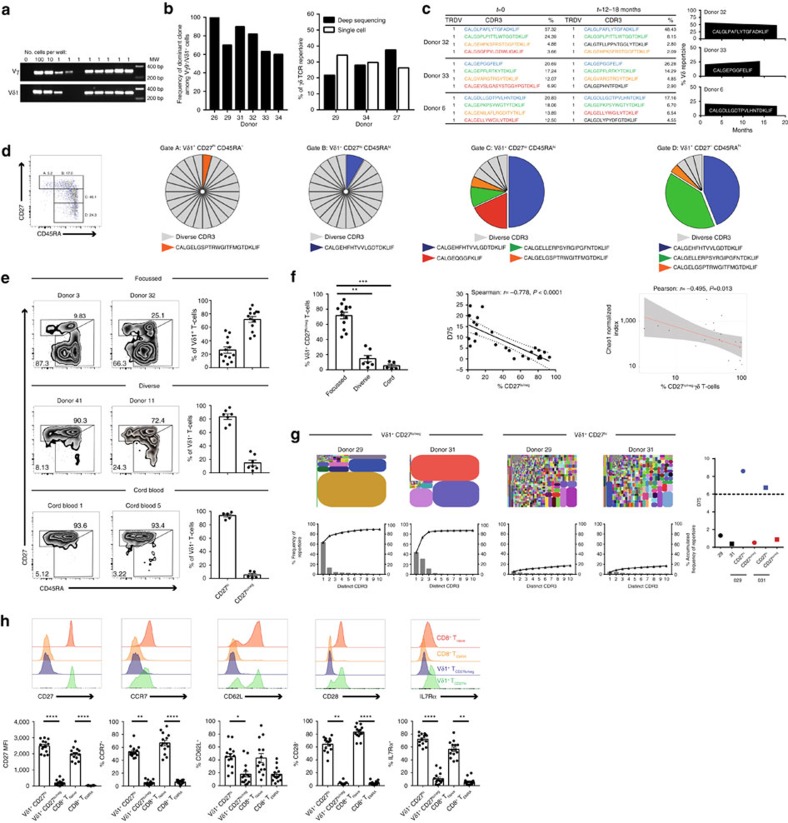
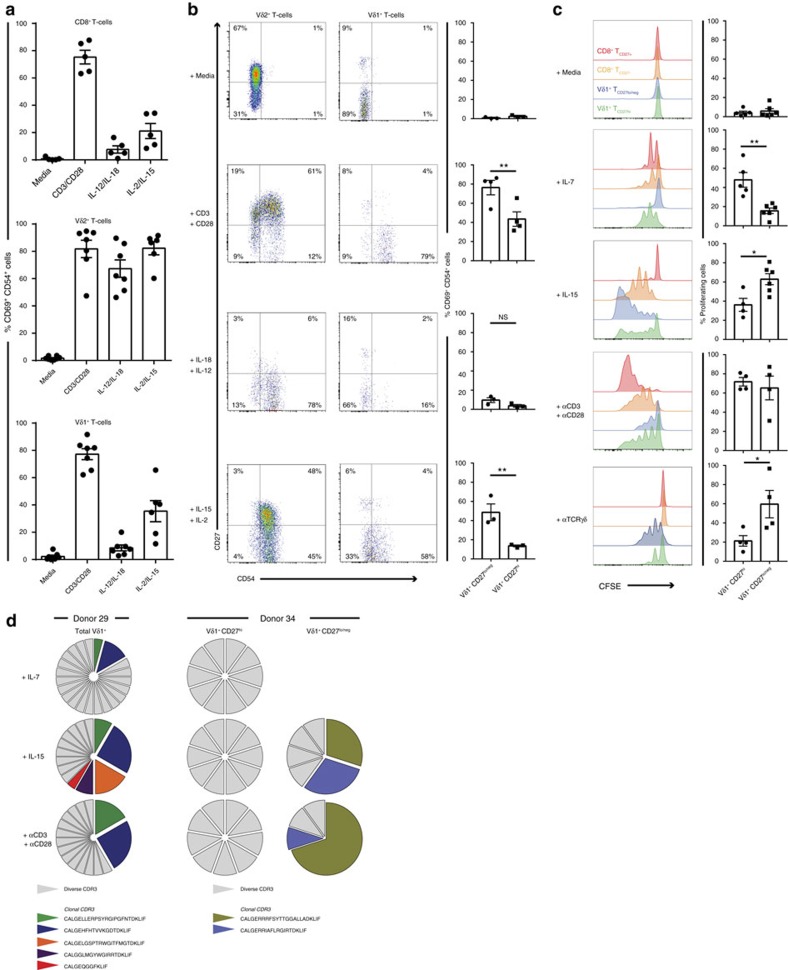
γδ T cells are considered to be innate-like lymphocytes that respond rapidly to stress without clonal selection and differentiation. Here we use next-generation sequencing to probe how this paradigm relates to human Vδ2neg T cells, implicated in responses to viral infection and cancer. The prevalent Vδ1 T cell receptor (TCR) repertoire is private and initially unfocused in cord blood, typically becoming strongly focused on a few high-frequency clonotypes by adulthood. Clonal expansions have differentiated from a naive to effector phenotype associated with CD27 downregulation, retaining proliferative capacity and TCR sensitivity, displaying increased cytotoxic markers and altered homing capabilities, and remaining relatively stable over time. Contrastingly, Vδ2+ T cells express semi-invariant TCRs, which are present at birth and shared between individuals. Human Vδ1+ T cells have therefore evolved a distinct biology from the Vδ2+ subset, involving a central, personalized role for the γδ TCR in directing a highly adaptive yet unconventional form of immune surveillance.


Conflict of interest statement

The authors declare no competing financial interests.

Figures

Figure 1
Figure 1. Peripheral blood γδ T-cell populations in donors analysed for γδ TCR repertoires.
(a) Major peripheral blood γδ T-cell populations identified by γδ TCR chain specific antibodies. Flow cytometry plots are representative of 20 donors. (b) Frequency of γδ T cells in CD3+ lymphocytes (left graph), abundance of Vδ2+ and Vδ2neg T cells in the γδ T cell compartment (Middle), and proportion of Vδ1+ T cells in the Vδ2neg γδ T-cell sub-population (Right). Graphs show the mean±s.e.m. from 20 donors. (c) Effect of donor CMV-seropositivity on CD8+, Vδ2+ and Vδ1+ cell percentages in total T cells. Graphs show the mean±s.e.m. from 10 CMV-seropositive and 10 CMV-seronegative donors. (d) Prevalence of a Vγ9 chain pairing in Vδ1+ T cells. Graphs show the mean±s.e.m. and flow cytometry plots are representative of 20 donors. Data analysed by student's t-test, *P=0.0228.
Figure 2
Figure 2. The Vδ1+ TCR repertoire is focused on a few dominant clonotypes in healthy adults.
(a) Vγ and Vδ chain usage by γδ TCR sequences from sorted Vδ1+ T cells from peripheral blood. Graphs show six representative donors of 13. (b) Tree maps show CDR3 clonotype usage in relation to repertoire size (each CDR3 colour is chosen randomly and does not match between plots) and graphs show the individual clone frequency (left y axis) and the accumulated frequency for the first 10 most prevalent clonotypes (right y axis). (c) Analysis of inter-donor diversity by D75 (percentage of clonotypes required to occupy 75% of the total TCR repertoire) from TCRδ repertoire analyses from 20 donors with CMV-seropositive (blue dots), CMV-seronegative individuals (black dots) and lowest quartile range plotted (dashed line). (d) Vγ and Vδ chain usage and (e) Tree maps and accumulated frequency graphs, for γδ TCR repertoires in donors with a D75>6. (f) Comparison of mean ±s.e.m. of TCRδ D75 values for 10 CMV-seropositive and 10 CMV-seronegative donors (Left) and focused donors (n=13) against diverse donors (n=7) (Right). Data were analysed by student's t-test, **P=0.0002.
Figure 3
Figure 3. The cord blood Vδ1+ TCR repertoire is composed of an unfocused set of γδ TCRs.
(a) Vγ and Vδ chain usage by sorted Vδ1+ T cells from cord blood samples. (b) Tree maps for both CDR3γ and CDR3δ clonotype usage in relation to repertoire size and accumulated frequency graphs for each of the top 20 most prevalent clonotypes. (c) Comparison of mean±s.e.m. of TCRδ D75 values from adult focused (n=13), adult unfocused (n=7) and cord blood (n=5) donors. (d) Accumulated frequencies means±s.e.m. occupied by the first 10 clonotypes for each donor and grouped into adult focused donors (n=13), adult diverse (n=7) and cord blood (n=5). Data were analysed by Kruskal–Wallis ANOVA with Dunn's post-test comparisons, **P=0.0049 and ***P=0.0007.
Figure 4
Figure 4. CDR3 length and diversity within the Vδ1 and Vδ2 TCR.
(a) Comparison of the mean ±s.e.m. from frequency-normalized CDR3δ and CDR3γ length spectratyping for Vδ1+ T cells in CMVneg (n=5), CMV+ (n=8), adult diverse (n=7) and cord blood (n=5) donors. (b) Comparison of non-normalized CDR3δ length spectratyping for Vδ1+ T cells from 3 representative individuals from CMV-seronegative (representative of n=5), CMV-seropositive (representative of n=8), adult diverse (representative of n=7) and cord blood (representative of n=5) donor groupings. (c) Non-normalized length spectratyping for CDR3δ and CDR3γ in adult Vδ2+ T cells (n=4). (d) Length distribution and mean (red line) within the top 10 most prevalent clonotypes in CDR3δ (left two panels) and CDR3γ (right two panels) of Vδ1+ T cells (5 donors shown, representative of 20) and Vδ2+ T cells (from 4 donors). (e) Publicity in the 10 most prevalent clonotypes for each donor's Vδ1+ TCR repertoire compared against all other donors (both aa and nt sequences compared). (f) Comparison of relative publicity in TCR repertoires. Overlap of individual TCR repertoires in TCRδ1 (n=15), TCRδ2 (n=4), TCRβ (n=15, ref PMID: 27183615), TCRγ of Vδ1+ cells, TCRγ of Vδ2+ cells and TCRα (n=3). Each dot shows relative similarity of repertoires for a pair of unrelated donors in terms of the shared TCR variants with identical amino acid CDR3 sequence, and V and J segments used. Overlap was estimated either as a number of clonotypes shared between the sets of top-1,000 largest clonotypes of each repertoire (left), or as a sum of clonotype frequencies shared between the total repertoires (F2 metrics of VDJTools software, right). (g) Publicity in the 10 most prevalent clonotypes for each donor's Vδ2+ TCR repertoire compared against all other donors (both aa and nt sequences compared). Mean overlap of sequences between each group was analysed by Kruskal–Wallis ANOVA with Dunn's post-test comparisons *P<0.003.
Figure 5
Figure 5. Vδ1 clonal expansion and differentiation is associated with decreased CD27 expression.
(a) PCR detection of Vγ9 and Vδ1 TCR chains in single cell sorted Vγ9Vδ1 T cells. n=6. (b) Frequency of each individual's dominant clone among single cell sorted Vγ9Vδ1 T cells. (c) Sequential TCR repertoire analyses in three individuals using RACE-PCR (left panel, first time point), and deep-sequencing ARM-PCR (middle panel, second time point, 12–18 months later). Clonotypic sequences are coloured consistently. The right panel depicts the frequency of the top clone within the repertoire over the two time points. (d) Relationship between CD27 and CD45RA expression and clonality by single cell PCR analysis of CDR3δ. Each colour represents an individual CDR3δ, with clonal sequences labelled below each chart (from 24 single cells per-population). Data are from one donor, representative of 3. (e) Vδ1+ T cells were segregated into CD27hi and CD27lo/neg, informed by TCR sequence clonality in d, and this FACS-gating strategy was applied to focused adults (top row, n=13), unfocused diverse adults (second row, n=7), and cord blood (third row, n=4). Flow cytometry data is shown for representative donors, with all donors shown with mean ±s.e.m. (right column). (f) Comparison of Vδ1+ CD27lo/neg cells from all adult and cord blood donors (left panel), correlation with CDR3δ D75 (middle) and Chao1 TCRδ1 diversity metric, normalized to 50,000 randomly chosen CDR3 sequencing reads, (right) for each donor. (g) TCRδ repertoire analysis of sorted CD27hi and CD27lo/neg Vδ1+ T cells, showing Tree maps (top row), accumulated frequency graphs of the top 10 clonotypes (bottom row) and CDR3δ D75 values (right column). (h) Comparison of CD27, CCR7, CD62L, CD28 and IL-7Rα expression within CD8+ T EMRA, CD8+ T naïve, Vδ1+ CD27hi and Vδ1+ CD27lo/neg T cells. Histograms from one representative donor and graphs show mean±s.e.m. from 14 different donors. Data analysed by Kruskal–Wallis ANOVA with Dunn's post-test comparisons, *P<0.05, **P<0.01 and ****P<0.0001.
Figure 6
Figure 6. Functional characteristics of clonally expanded CD27lo/negversus naive CD27hi Vδ1+ T cells.
(a) Sorted CD3+ T cells were incubated for 72 h with cytokines or anti-CD3/CD28 beads. CD8+, Vδ2+ and Vδ1+ T cells were then assessed for the upregulation of CD69 and CD54. Graphs show mean ±s.e.m. from medium controls (n=5–7), CD3/CD28 (n=5–7), IL-12/IL-18 (n=5–7) and IL-2/IL-15 (n=5–6) stimulation. (b) Flow cytometry analysis of Vδ2 and Vδ1 T cells from a, with cells analysed for CD27 and CD54 expression (left, representative flow cytometry plots) and graphs show mean±s.e.m. of CD69+ CD54+ cells in Vδ1+ CD27hi and Vδ1+ CD27lo/neg populations, data from medium controls (n=4), CD3/CD28 (n=4), IL-12/IL-18 (n=3) and IL-2/IL-15 (n=3). (c) Proliferation of Vδ1 T cells, assessed by CFSE dilution, for 7 days in response to stimulation with IL-7, IL-15, anti-CD3/CD28 and anti-TCRγδ mAb. Histograms are from a representative focused adult donor's Vδ1+ CD27hi cells, Vδ1+ CD27lo/neg cells, CD8+CD27+ or CD8+ CD27neg T cells and graphs show mean±s.e.m. of proliferating cells (n=4–6). (d) Total proliferating Vδ1+ T cells (Left, donor 29) or CD27hi and CD27lo/neg Vδ1+ T cells were single cell sorted and CDR3δ sequenced by PCR, prevalent clonotypes detected by previous deep sequencing are coloured and diverse individual sequences are grey. Donor 29 had 24 single cells, and donor 34 had 10 single cells analysed from each condition. Data analysed by student's t test, NS=P>0.05, *P<0.05 and **P<0.01.
Figure 7
Figure 7. Clonally expanded CD27lo/negVδ1+ T cells express CX3CR1 and cytotoxic effector molecules.
(a) Expression of intracellular cytotoxic effector molecules, granzyme A, granzyme B and perforin by CD8+ T Naïve, CD8+ T EMRA, Vδ1+ CD27lo/neg and Vδ1+ CD27hi cells. Correlation graph between all 7 donors and the corresponding TCRδ D75 calculated from TCR repertoire deep sequencing. Representative histograms, graph and dot plot are from 7 donors. (b) Expression of CX3CR1 on the surface of CD8+ T Naïve, CD8+ T EMRA, Vδ1+ CD27lo/neg and Vδ1+ CD27hi cells. Within CX3CR1+ or CX3CR1- Vδ1+ T cells the expression of granzyme B and IL7Rα. Representative histograms of 5 donors (left), with all 5 donors shown (middle) and 4 of these donors assessed for CX3CR1/granzyme B/IL7Rα (right). (c) Single cell γδ TCR analysis from 3 donors, single cells were sorted from CX3CR1+ or CX3CR1- Vδ1+ T cells and CDR3 sequences analysed against dominant clonotypes identified by deep sequencing. Graphs show the mean±s.e.m. and data were analysed by two-way ANOVA (a) and one-way ANOVA with Holm-Sidak's post-tests (b), ***P<0.001 and ****P<0.0001.

Comment in

References

    1. Hayday A. C. [gamma][delta] cells: a right time and a right place for a conserved third way of protection. Annu. Rev. Immunol. 18, 975–1026 (2000). - PubMed
    1. Bonneville M., O'Brien R. L. & Born W. K. Gammadelta T cell effector functions: a blend of innate programming and acquired plasticity. Nat. Rev. Immunol. 10, 467–478 (2010). - PubMed
    1. Chien Y. H., Meyer C. & Bonneville M. gammadelta T cells: first line of defense and beyond. Annu. Rev. Immunol. 32, 121–155 (2014). - PubMed
    1. Gerber D. J. et al. IL-4-producing gamma delta T cells that express a very restricted TCR repertoire are preferentially localized in liver and spleen. J. Immunol. 163, 3076–3082 (1999). - PubMed
    1. Kashani E. et al. A clonotypic Vgamma4Jgamma1/Vdelta5Ddelta2Jdelta1 innate gammadelta T-cell population restricted to the CCR6(+)CD27(−) subset. Nat. Commun. 6, 6477 (2015). - PubMed

Publication types

MeSH terms

Substances