. 2017 Mar 1:8:14623.
doi: 10.1038/ncomms14623.

Perfect X-ray focusing via fitting corrective glasses to aberrated optics

Affiliations

Perfect X-ray focusing via fitting corrective glasses to aberrated optics

Frank Seiboth et al. Nat Commun. .

Abstract

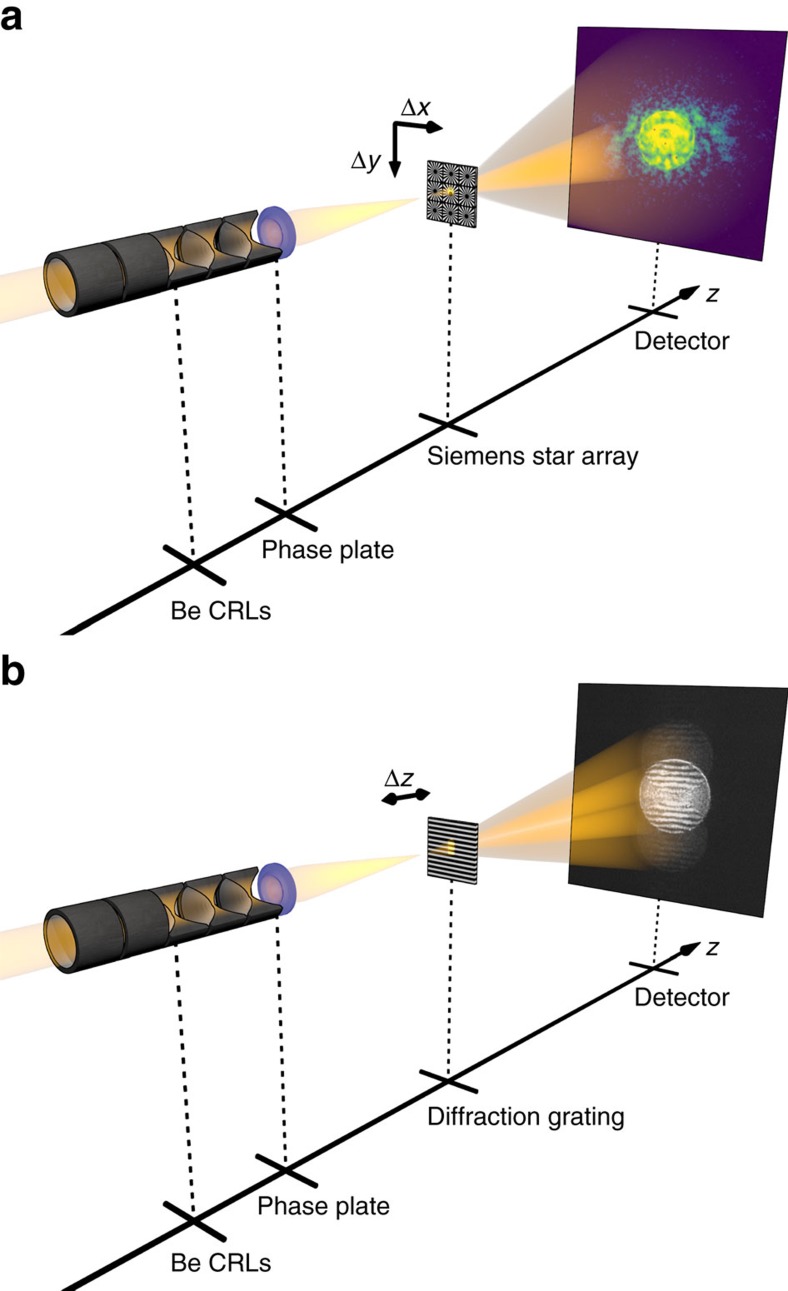
Due to their short wavelength, X-rays can in principle be focused down to a few nanometres and below. At the same time, it is this short wavelength that puts stringent requirements on X-ray optics and their metrology. Both are limited by today's technology. In this work, we present accurate at wavelength measurements of residual aberrations of a refractive X-ray lens using ptychography to manufacture a corrective phase plate. Together with the fitted phase plate the optics shows diffraction-limited performance, generating a nearly Gaussian beam profile with a Strehl ratio above 0.8. This scheme can be applied to any other focusing optics, thus solving the X-ray optical problem at synchrotron radiation sources and X-ray free-electron lasers.


Conflict of interest statement

The authors declare no competing financial interests.

Figures

Figure 1
Figure 1. Experimental setup.
X-rays with E=8.2 keV (selected by a Si-111 monochromator) were focused by a compound refractive lens made of beryllium (Be CRL). To correct for the residual aberrations of the lens, a phase plate was installed immediately following the lens stack. (a) For ptychography the test object—an array of Siemens stars—was placed in the vicinity of the focal plane. The sample was scanned transversely to the beam (x–y raster scan) and far-field diffraction patterns were recorded at each position. (b) Ronchigrams were recorded using a grating test sample with a distinct grating period positioned along the optical axis. Further details can be found in the Methods.
Figure 2
Figure 2. Initial lens characterization and phase plate design.
(a) Measured wavefront deformation at the lens exit compared to a spherical wave. (b) Phase error of a modelled lens stack at the lens exit. Scale bars in a,b correspond to 50 μm. (c) Deformation of every lens surface in the modelled stack of 20 beryllium compound refractive lenses used to generate b. The surface error (solid red line) is enhanced by the axis on the right side. (d) Model of the SiO2 phase plate to correct for errors shown in ac. (e) Surface profile of the manufactured corrective SiO2 phase plate using ultrashort-pulse laser ablation compared with the design goal d as measured by a laser scanning microscope.
Figure 3
Figure 3. Aberration correction by a corrective phase plate.
(a) Beam caustic retrieved from the ptychographic reconstruction. Scale bars are 2 μm and 1 mm in x and z direction, respectively. (b) Logarithmic intensity distribution in the focal plane as marked by the dashed line in a. Scale bar represents 2 μm in x and y direction. (c) Ronchigram recorded at the dotted position in the beam caustic a. Insets ac are without the phase plate. (d) Beam caustic retrieved from the ptychographic reconstruction. Scale bars identical to a. (e) Logarithmic intensity distribution in the focal plane as marked by the dashed line in d. Scale bar identical to b. (f) Ronchigram recorded at the dotted position in the beam caustic d. Insets df are with the phase plate installed. Insets a,b,d,e share the same colour bar as well as c,f.
Figure 4
Figure 4. Improved focal spot characteristics.
(a) Horizontal slice (x-direction, logarithmic scale) through the focal plane depicted in Fig. 3b,e and for an ideal lens. (b) Radially integrated intensity distribution around the centre of the focal spot. The solid green line represents the results for the uncorrected lens (without the phase plate), the dotted blue line represents the phase plate corrected lens, and the dashed red line represents the modelled aberration-free lens in both a,b.

Similar articles

Cited by

References

    1. David C. et al.. Nanofocusing of hard X-ray free electron laser pulses using diamond based Fresnel zone plates. Sci. Rep. 1, 57 (2011). - PMC - PubMed
    1. Yumoto H. et al.. Focusing of X-ray free-electron laser pulses with reflective optics. Nat. Photon. 7, 43–47 (2013).
    1. Mimura H. et al.. Generation of 1020 W cm−2 hard X-ray laser pulses with two-stage reflective focusing system. Nat. Commun. 5, 3539 (2014). - PubMed
    1. Schropp A. et al.. Full spatial characterization of a nanofocused x-ray free-electron laser beam by ptychographic imaging. Sci. Rep. 3, 01633 (2013). - PMC - PubMed
    1. Seiboth F. et al.. Focusing XFEL SASE pulses by rotationally parabolic refractive x-ray lenses. J. Phys. 499, 012004 (2014).

Publication types