Review
. 2017 Aug 23;117(16):10694-10725.
doi: 10.1021/acs.chemrev.6b00765. Epub 2017 Mar 1.

Water Dynamics in the Hydration Shells of Biomolecules

Affiliations
Review

Water Dynamics in the Hydration Shells of Biomolecules

Damien Laage et al. Chem Rev. .

Abstract

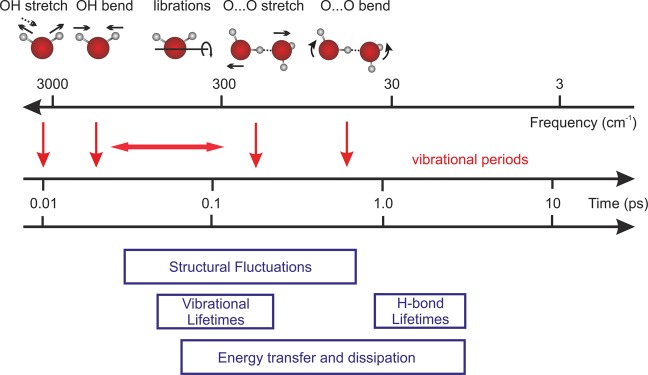
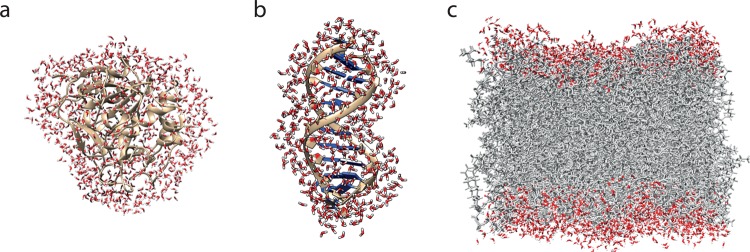
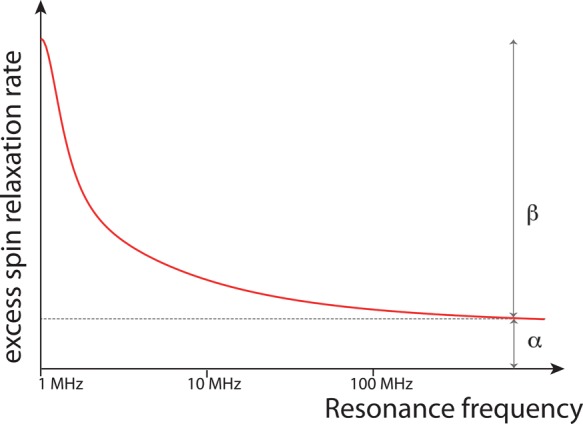
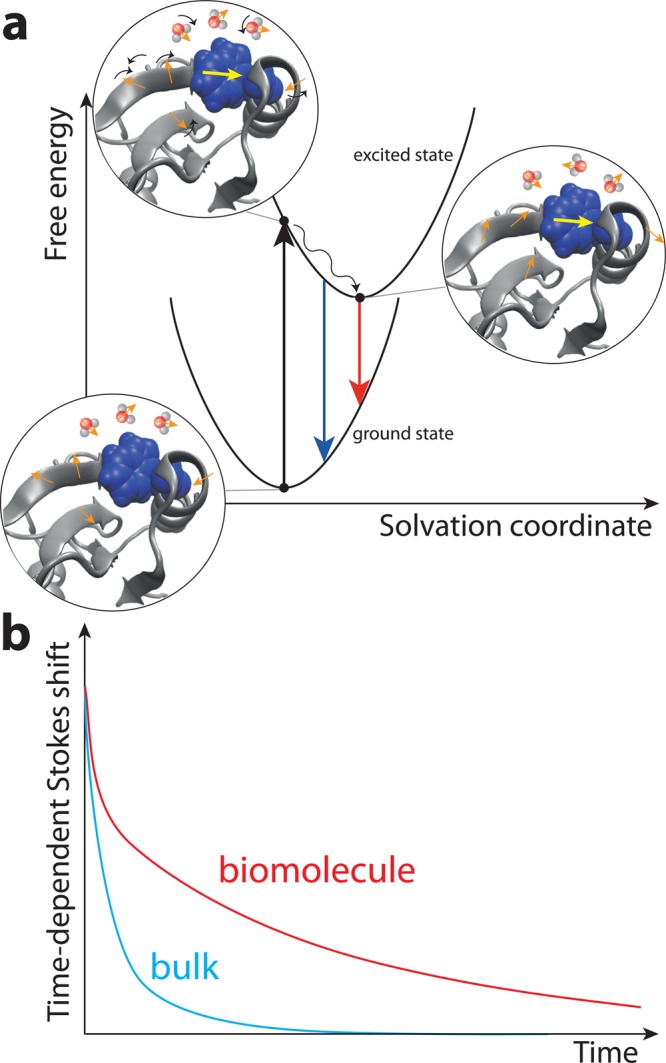
The structure and function of biomolecules are strongly influenced by their hydration shells. Structural fluctuations and molecular excitations of hydrating water molecules cover a broad range in space and time, from individual water molecules to larger pools and from femtosecond to microsecond time scales. Recent progress in theory and molecular dynamics simulations as well as in ultrafast vibrational spectroscopy has led to new and detailed insight into fluctuations of water structure, elementary water motions, electric fields at hydrated biointerfaces, and processes of vibrational relaxation and energy dissipation. Here, we review recent advances in both theory and experiment, focusing on hydrated DNA, proteins, and phospholipids, and compare dynamics in the hydration shells to bulk water.


Conflict of interest statement

The authors declare no competing financial interest.

Figures

Figure 1
Figure 1
Time scales and processes in bulk H2O. Red arrows above the logarithmic time axis mark the periods of vibrational and librational degrees of freedom schematically illustrated at the top of the figure. Horizontal boxes below the time axis illustrate the time range covered by particular processes of bulk water dynamics.
Figure 2
Figure 2
Typical hydration shells of (a) a protein, (b) a DNA double strand, and (c) a phospholipid bilayer (snapshots from simulations described in refs (−59)).
Figure 3
Figure 3
Magnetic relaxation dispersion probes, as a function of the resonance frequency, the water excess spin relaxation rate in the aqueous biomolecule solution relative to the bulk. The rate is the sum of two contributions: a constant α due to the Nα hydration shell water molecules which move on a time scale faster than 1 ns and cannot be resolved, with α ∝ Nα (⟨τhyd⟩/τbulk – 1), where ⟨τhyd⟩ and τbulk are the average hydration shell and bulk reorientation times, and a sum of two Lorentzians whose total amplitude is β and is proportional to the number Nβ of slower water molecules.
Figure 4
Figure 4
Schematic description of the pump–probe time-dependent Stokes shift measurement of solvation dynamics. (a) Electronic ground and excited state free energy surfaces of the chromophore attached to the biomolecule along the solvation coordinate that describes the electrostatic environment produced by the solvent and the polar and charged sites on the biomolecule. (b) Typical time-dependent Stokes shift decay in time for the chromophore in bulk water and attached to the biomolecule.
Figure 5
Figure 5
(a) Pump–probe spectroscopy. Excitation by an ultrashort pump pulse (blue arrow, left) results in a transient change of the linear absorption spectrum (middle), which is measured by the probe pulse (red arrows, left). An absorption decrease ΔA < 0 occurs on the v = 0 → 1 transition, while the v = 1 → 2 absorption is enhanced (right panel). (b) (Left) Linear infrared absorption with contributions from different vibrational transitions. (Right) Nonlinear 2D infrared spectrum consisting of peaks on the diagonal ν1 = ν3 (colored) and off-diagonal (cross) peaks (black). The strength of cross peaks reflects the vibrational coupling strength. (c) (Left) Spectral diffusion from an initial frequency νi to a frequency νf within an inhomogeneously broadened vibrational band. In the 2D spectrum, this process leads to a change from an elliptic to a round line shape with increasing waiting time T. This loss of frequency correlation can be quantified with the help of so-called center lines (CLs, white) which connect the maximum signals at different detection frequencies ν3. The decrease of the CL slope as a function of T is a measure for the correlation decay. (d) Pulse sequence in 3-pulse photon echo experiments with the coherence time τ, the waiting time T, and the real time t.
Figure 6
Figure 6
(a) Acetylcholinesterase enzyme with its hydration shell water molecules (left), and map of water reorientation dynamics in the shell (right). (b) Idem around a DNA dodecamer. (c) Probability density of water reorientation times next to a series of globular proteins, and next to DNA on a linear scale and on a semilog scale in the inset.
Figure 7
Figure 7
(a) Molecular jump mechanism for water reorientation. (b) Schematic figure with a protein interface and the three types of sites, respectively hydrophobic, H-bond donor, and H-bond acceptor, together with a pictorial representation of the types of perturbation they induce on water dynamics (excluded volume and H-bond strength factors).
Figure 8
Figure 8
Schematic representation of part of an E. coli cell, including cell wall (green), cytoplasm area (blue and purple), and nucleoid region (yellow and orange). Water molecules are not shown (Illustration by David S. Goodsell, the Scripps Research Institute).
Figure 9
Figure 9
Effect of crowding on water structure and dynamics. For water molecules between two proteins (a) and four proteins (b), the number of H bonds is practically unchanged with the degree of confinement (c), while the H-bond dynamics exhibit a sharp transition at a distance which changes markedly with the confining geometry (d) (Reprinted with permission from ref (159). Copyright 2014 American Chemical Society.). There are alternate definitions for the HB lifetime than the one employed here, see, e.g., ref (58).
Figure 10
Figure 10
Schematic illustration of energy relaxation pathways as mapped in pump–probe experiments. (a) Optical excitation to an electronically excited state S1 (blue arrow) initiates an internal conversion process (wavy arrow) which results in excess populations of higher levels of intramolecular modes (levels shown in red). These populations lead to an enhancement of the low-energy tail of the S0S1 absorption spectrum (red arrow), which is measured by a delayed probe pulse. With increasing delay between excitation and probe pulse, the absorption enhancement decays by energy transfer to the water shell. (b) Relaxation pathways after resonant excitation of a vibration (blue arrow, oscillator levels v = 0, 1, and 2). Decay of the v = 1 state generates nonequilibrium populations of intramolecular low-frequency modes which are anharmonically coupled to the initially excited vibration (red levels). As a result, the vibrational transition frequency between the v′ = 0 and the v′ = 1 states is different from that of the initial v = 0 to 1 transition. Subsequent vibrational relaxation leads to a decay of the excess populations of the red levels and the related frequency shift, populating other modes in the vibrational manifold of the molecule (short red arrow) and/or modes of the water shell (short blue arrow, blue levels). Vertical red arrows: Transitions contributing to the absorption changes measured in a pump–probe experiment.
Figure 11
Figure 11
Pump–probe spectra of DOPC reverse micelles with (a and b) w0 = 2 and (c and d) w0 = 16 water molecules per phosphate head (Reprinted with permission from ref (237). Copyright 2011 American Chemical Society.). In the experiments, the asymmetric PO2 stretch vibration is resonantly excited by a 150 fs pulse, and the resulting change of absorption ΔA = −log (T/T0) at a fixed delay time is measured as a function of probe frequency (with T and T0 being the sample transmissions with and without excitation). Spectra at early delays reflect population relaxation of the excited mode (cf. Figure 5a), whereas absorption changes at late delay times (lower panels) are a signature of a hot vibrational ground state. At low hydration (w0 = 2), the PO2 stretch band undergoes a transient red shift at late delay times, whereas a transient blue shift is observed at high hydration levels (w0 = 16).
Figure 12
Figure 12
Absorptive 2D-IR spectra of the OH stretching vibration of water inside DOPC reverse micelles for the waiting times indicated and 3 different hydrations w0 = 1 (first row), w0 = 3 (second row), and w0 = 16 (third row) (Reprinted with permission from ref (154). Copyright 2012 American Chemical Society.). Spectra are taken with parallel linear polarization of the pulses. Contour lines indicate 10% steps in the measured 2D signals. Spectra at low water content (w0 = 1) show a persistent predominantly inhomogeneously broadened line due to a heterogeneous distribution of H-bond geometries of single water molecules bound to the phosphate groups. With increasing water content, the spectral diffusion rates increase as a result of vibrational energy dissipation into local water pools. Blue-shifted absorption around 3550 cm–1 is due to the hot water ground state.
Figure 13
Figure 13
(a) Radial distribution of K+ ions along the distance to the DNA helical axis, averaged over a series of microsecond simulations of different tetranucleotides at physiological ion concentration, in the major (upper panel) and minor (lower panel) grooves (Reproduced with permission from ref (278). Copyright 2015.). (b) Distribution of K+ (blue) and Cl (green) ions around DNA, where the oxygen and phosphorus atoms are highlighted in red and purple, from a snapshot of the simulation described in ref (278) (Image courtesy of R. Lavery).
Figure 14
Figure 14
2D infrared spectra of fully hydrated salmon testes DNA with (A) Na+ and (B) Mg2+ counterions (Reprinted with permission from ref (173). Copyright 2016 American Chemical Society.). Exchange of counterions has a negligible influence on spectral positions and line shapes of the different contributions to the 2D spectra.

References

    1. Rothschild L. J.; Mancinelli R. L. Life in Extreme Environments. Nature 2001, 409, 1092–1101. 10.1038/35059215. - DOI - PubMed
    1. Ball P. Water As an Active Constituent in Cell Biology. Chem. Rev. 2008, 108, 74–108. 10.1021/cr068037a. - DOI - PubMed
    1. Levy Y.; Onuchic J. N. Water Mediation in Protein Folding and Molecular Recognition. Annu. Rev. Biophys. Biomol. Struct. 2006, 35, 389–415. 10.1146/annurev.biophys.35.040405.102134. - DOI - PubMed
    1. Arunan E.; Desiraju G. R.; Klein R. A.; Sadlej J.; Scheiner S.; Alkorta I.; Clary D. C.; Crabtree R. H.; Dannenberg J. J.; Hobza P.; et al. Defining the Hydrogen Bond: An Account (IUPAC Technical Report). Pure Appl. Chem. 2011, 83, 1619–1636. 10.1351/PAC-REP-10-01-01. - DOI
    1. Chandler D. Interfaces and the Driving Force of Hydrophobic Assembly. Nature 2005, 437, 640–647. 10.1038/nature04162. - DOI - PubMed