

8-year trends in physical activity, nutrition, TV viewing time, smoking, alcohol and BMI: A comparison of younger and older Queensland adults
- PMID: 28248975
- PMCID: PMC5332140
- DOI: 10.1371/journal.pone.0172510
8-year trends in physical activity, nutrition, TV viewing time, smoking, alcohol and BMI: A comparison of younger and older Queensland adults
Abstract
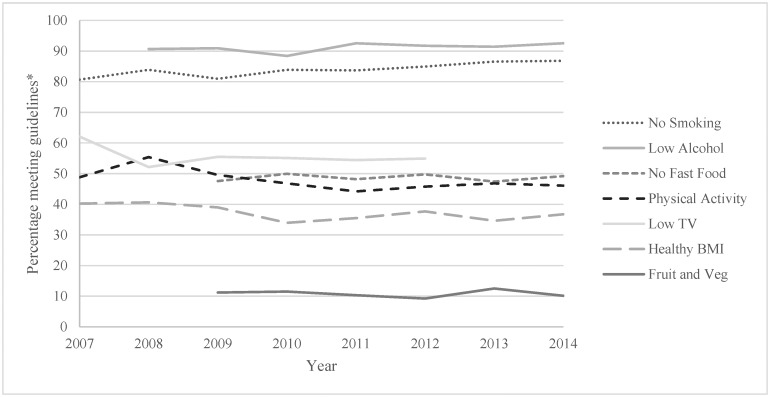
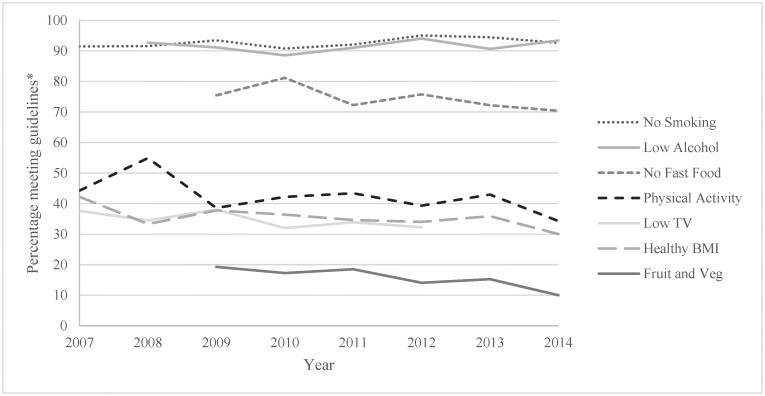
Lifestyle behaviours significantly contribute to high levels of chronic disease in older adults. The aims of the study were to compare the prevalence and the prevalence trends of health behaviours (physical activity, fruit and vegetable consumption, fast food consumption, TV viewing, smoking and alcohol consumption), BMI and a summary health behaviour indicator score in older (65+ years) versus younger adults (18-65 years). The self-report outcomes were assessed through the Queensland Social Survey annually between 2007-2014 (n = 12,552). Regression analyses were conducted to compare the proportion of older versus younger adults engaging in health behaviours and of healthy weight in all years combined and examine trends in the proportion of younger and older adults engaging in health behaviours and of healthy weight over time. Older adults were more likely to meet recommended intakes of fruit and vegetable (OR = 1.43, 95%CI = 1.23-1.67), not consume fast food (OR = 2.54, 95%CI = 2.25-2.86) and be non-smokers (OR = 3.02, 95%CI = 2.53-3.60) in comparison to younger adults. Conversely, older adults were less likely to meet the physical activity recommendations (OR = 0.86, 95%CI = 0.78-0.95) and watch less than 14 hours of TV per week (OR = 0.65, 95%CI = 0.58-0.74). Overall, older adults were more likely to report engaging in 3, or at least 4 out of 5 healthy behaviours. The proportion of both older and younger adults meeting the physical activity recommendations (OR = 0.97, 95%CI = 0.95-0.98 and OR = 0.94, 95%CI = 0.91-0.97 respectively), watching less than 14 hours of TV per week (OR = 0.96, 95%CI = 0.94-0.99 and OR = 0.94, 95%CI = 0.90-0.99 respectively) and who were a healthy weight (OR = 0.95, 95%CI = 0.92-0.99 and OR = 0.96, 95%CI = 0.94-0.98 respectively) decreased over time. The proportion of older adults meeting the fruit and vegetable recommendations (OR = 0.90, 95%CI = 0.84-0.96) and not consuming fast food (OR = 0.94, 95%CI = 0.88-0.99) decreased over time. Although older adults meet more health behaviours than younger adults, the decreasing prevalence of healthy nutrition behaviours in this age group needs to be addressed.
Conflict of interest statement
Figures
References
-
- Australian Institute of Health and Welfare. Health expenditure Australia 2007–08. Canberra: AIHW, 2009.
-
- Australian Bureau of Statistics. Population Projections, Australia, 2012 (base) to 2101. Canberra: 2012 Contract No.: 3222.0.
-
- Australian Bureau of Statistics. Profiles of health, Australia, 2011–13 Canberra, Australia: ABS, 2013 Contract No.: 4338.0.
Publication types
MeSH terms
LinkOut - more resources
Full Text Sources
Other Literature Sources
Medical
