. 2017 Mar 1;12(3):e0172293.
doi: 10.1371/journal.pone.0172293. eCollection 2017.

Maximum soil organic carbon storage in Midwest U.S. cropping systems when crops are optimally nitrogen-fertilized

Affiliations

Maximum soil organic carbon storage in Midwest U.S. cropping systems when crops are optimally nitrogen-fertilized

Hanna J Poffenbarger et al. PLoS One. .

Abstract

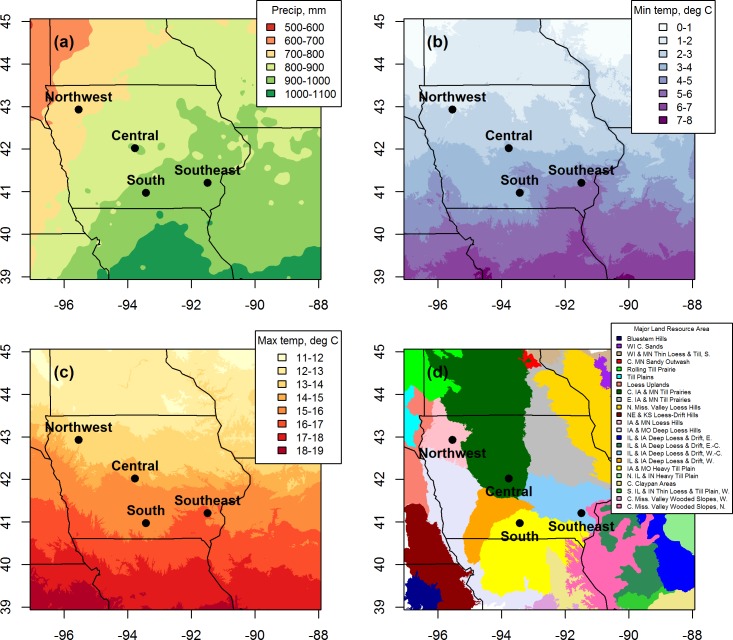
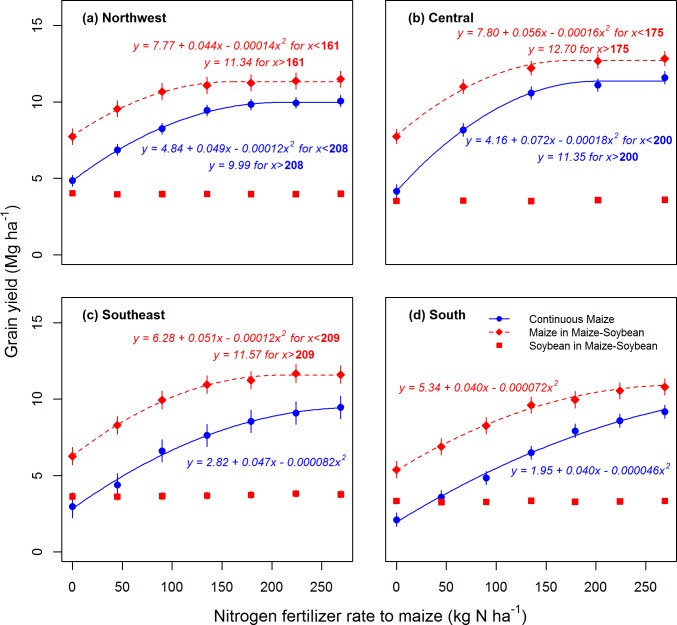
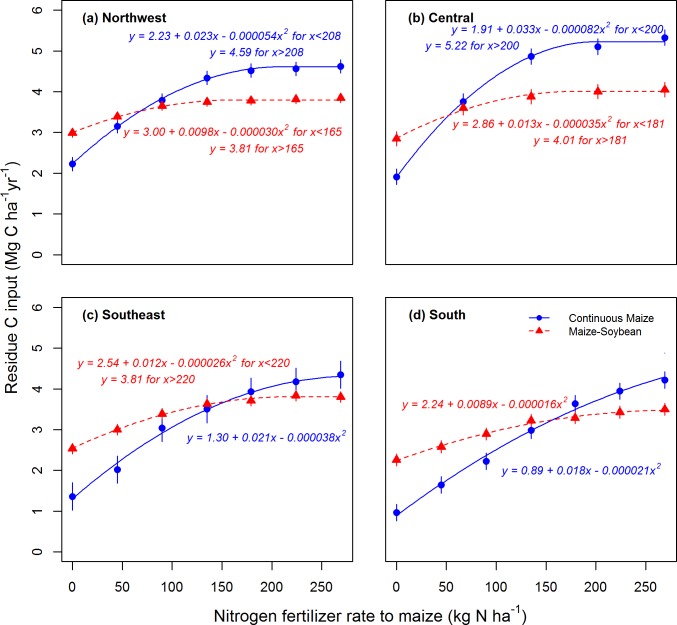
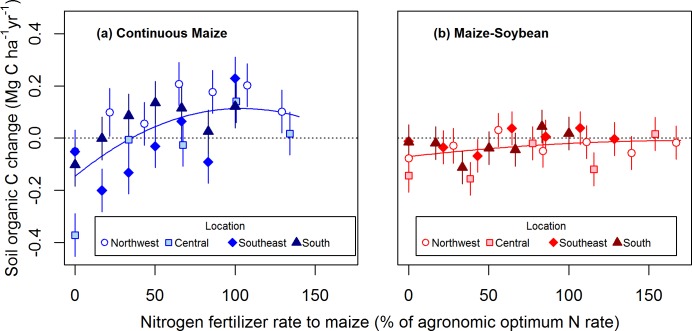
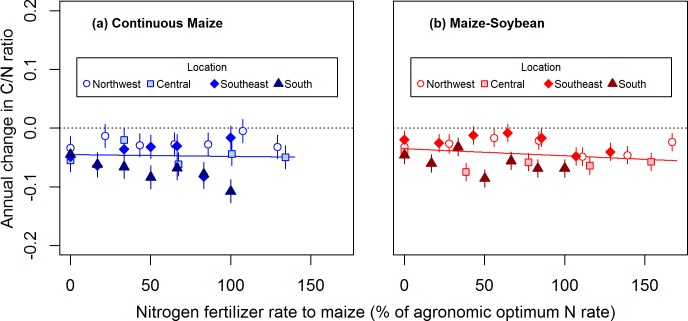
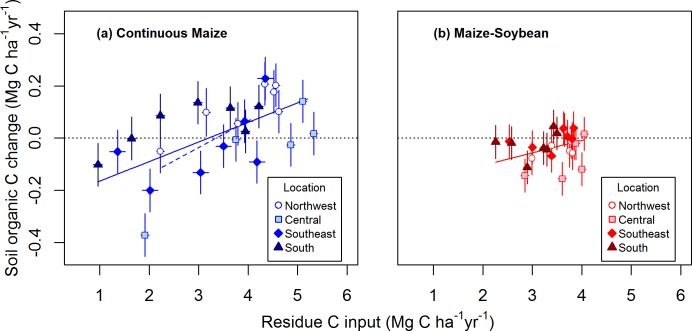
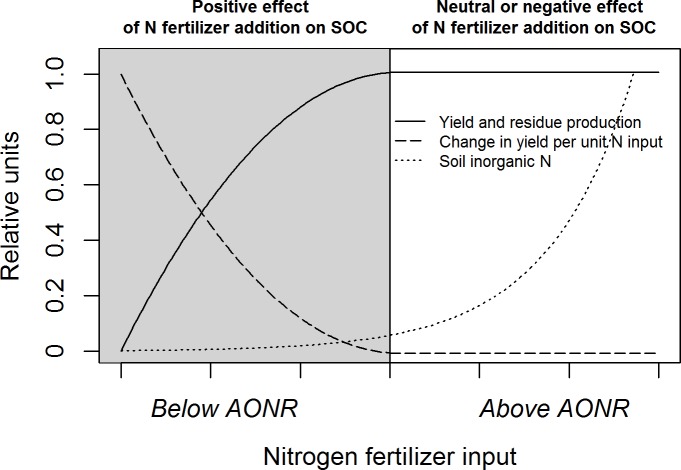
Nitrogen fertilization is critical to optimize short-term crop yield, but its long-term effect on soil organic C (SOC) is uncertain. Here, we clarify the impact of N fertilization on SOC in typical maize-based (Zea mays L.) Midwest U.S. cropping systems by accounting for site-to-site variability in maize yield response to N fertilization. Within continuous maize and maize-soybean [Glycine max (L.) Merr.] systems at four Iowa locations, we evaluated changes in surface SOC over 14 to 16 years across a range of N fertilizer rates empirically determined to be insufficient, optimum, or excessive for maximum maize yield. Soil organic C balances were negative where no N was applied but neutral (maize-soybean) or positive (continuous maize) at the agronomic optimum N rate (AONR). For continuous maize, the rate of SOC storage increased with increasing N rate, reaching a maximum at the AONR and decreasing above the AONR. Greater SOC storage in the optimally fertilized continuous maize system than in the optimally fertilized maize-soybean system was attributed to greater crop residue production and greater SOC storage efficiency in the continuous maize system. Mean annual crop residue production at the AONR was 22% greater in the continuous maize system than in the maize-soybean system and the rate of SOC storage per unit residue C input was 58% greater in the monocrop system. Our results demonstrate that agronomic optimum N fertilization is critical to maintain or increase SOC of Midwest U.S. cropland.


Conflict of interest statement

Competing Interests: The authors have declared that no competing interests exist.

Figures

Fig 1
Fig 1. Locations of long-term N fertilization experiments.
Maps show study locations within the most productive region of the U.S. rainfed Maize Belt (eastern Nebraska, southern Minnesota, Iowa, and central and northern Illinois) [20]. a) Mean annual precipitation, b) mean annual minimum temperature, c) mean annual maximum temperature, d) Major Land Resource Areas [21]. All climate data were averaged over 1981–2010 [22]. Cardinal directions for the Major Land Resource Areas are abbreviated in the legend (N, S, E, W, and C for north, south, east, west, and central, respectively).
Fig 2
Fig 2. Cropping system and N fertilizer rate effects on grain yield.
Mean maize and soybean grain yields in response to N fertilizer rate applied to maize in continuous maize and maize-soybean systems. Each of four Iowa study locations is shown on a separate panel (a-d). Grain yields were averaged across 14 (Northwest), 15 (Central and South), or 16 (Southeast) years according to the number of years between soil sampling events. Curves are quadratic-plateau or quadratic models fit to the data (P < 0.01 for all models). Bolded values are the agronomic optimum N rate (AONR) for quadratic-plateau curves. The AONR was set to the highest N rate applied (269 kg ha-1) for quadratic curves. Error bars represent 95% CIs, calculated using the variability in across-year mean grain yields among replicate plots. Confidence intervals for soybean yields are encompassed by the points.
Fig 3
Fig 3. Cropping system and N fertilizer rate effects on mean annual residue C inputs.
Estimated mean annual inputs of crop residue C in response to N fertilizer rate applied to maize in continuous maize and maize-soybean systems. Each of four Iowa study locations is shown on a separate panel (a-d). Curves are quadratic-plateau or quadratic models fit to the data (P < 0.01 for all models). Error bars represent 95% CIs, calculated using the variability in residue C inputs among replicate plots.
Fig 4
Fig 4. Cropping system and N fertilizer rate effects on soil organic C storage.
Mean (± SE) annual change in surface (0–15 cm) soil organic C (SOC) in response to N fertilizer rate applied to maize in continuous maize (a) and maize-soybean (b) systems. Nitrogen fertilizer rate is expressed as a percentage of the agronomic optimum N rate for each system within each location. Quadratic regression curves are shown for both cropping systems, but the linear and quadratic coefficients were not significant for the maize-soybean rotation (continuous maize: y = -0.15 + 0.0050x – 0.000024x2, P < 0.01 for all coefficients; maize-soybean: y = -0.071 + 0.00070x – 0.0000020x2, P < 0.05 for intercept, P = 0.28 for linear coefficient, P = 0.66 for quadratic coefficient). For reference, the horizontal dotted lines represent no SOC change.
Fig 5
Fig 5. Cropping system and N fertilizer rate effects on change in the soil C/N ratio.
Mean (± SE) annual change in the surface (0–15 cm) soil C/N ratio in response to N fertilizer rate applied to maize in continuous maize (a) and maize-soybean (b) systems at four Iowa locations. Nitrogen fertilizer rate is expressed as a percentage of the agronomic optimum N rate for each system within each location. Regression lines are shown for both cropping systems, but the slope was not significant for the continuous maize system (continuous maize: y = -0.045–0.00003x, P < 0.01 for intercept, P = 0.71 for linear coefficient; maize-soybean: y = -0.035–0.00012x, P < 0.05 for intercept and linear coefficient). For reference, the horizontal dotted lines represent no change in the C/N ratio.
Fig 6
Fig 6. Relationship between soil organic C storage and residue C inputs.
Mean (± SE) annual change in surface (0–15 cm) soil organic C (SOC) in response to mean (± SE) annual residue C inputs for continuous maize (a) and maize-soybean (b) systems. Solid regression lines apply to the full range of residue C inputs for each cropping system (continuous maize: y = -0.24 + 0.075x, P < 0.01 for both coefficients; maize-soybean: y = -0.20 + 0.048x, P < 0.05 for both coefficients). The dashed regression line for the continuous maize system was fitted using the range of residue C inputs equal to the range observed for the maize-soybean system; the regression lines for the full and truncated data ranges did not differ (P = 0.43). Some horizontal error bars are encompassed by the points. For reference, the horizontal dotted lines represent no SOC change.
Fig 7
Fig 7. Conceptual relationships between N fertilizer input and maize yield, residue production, and residual soil inorganic N.
The agronomic optimum N rate (AONR) is the N rate at which crop yield is maximized. Expected soil organic C (SOC) responses to fertilization of N-deficient maize (below the AONR, grey area) and N-sufficient maize (above the AONR, white area) are shown in bold above the plot.

References

    1. Williams CL, Liebman M, Edwards JW, James DE, Singer JW, Arritt R, et al. Patterns of regional yield stability in association with regional environmental characteristics. Crop Sci. 2008;48:1545–59.
    1. Hudson B. Soil organic matter and available water capacity. J Soil Water Conserv. 1994;49:189–94.
    1. Barrett JE, Burke IC. Nitrogen retention in semiarid ecosystems across a soil organic matter gradient. Ecol Appl. 2002;12:878–90.
    1. Weil RR, Magdoff F. Significance of soil organic matter to soil quality and health. In: Soil Organic Matter in Sustainable Agriculture. 2004. p. 1–43.
    1. Stevens WB, Hoeft RG, Mulvaney RL. Fate of nitrogen-15 in a long-term nitrogen rate study: II. Nitrogen uptake efficiency. Agron J. 2005;97:1046–53.

LinkOut - more resources