. 2017 May;104(4):652-663.
doi: 10.1111/mmi.13655. Epub 2017 Mar 26.

ZapA and ZapB form an FtsZ-independent structure at midcell

Affiliations

ZapA and ZapB form an FtsZ-independent structure at midcell

Jackson A Buss et al. Mol Microbiol. 2017 May.

Abstract

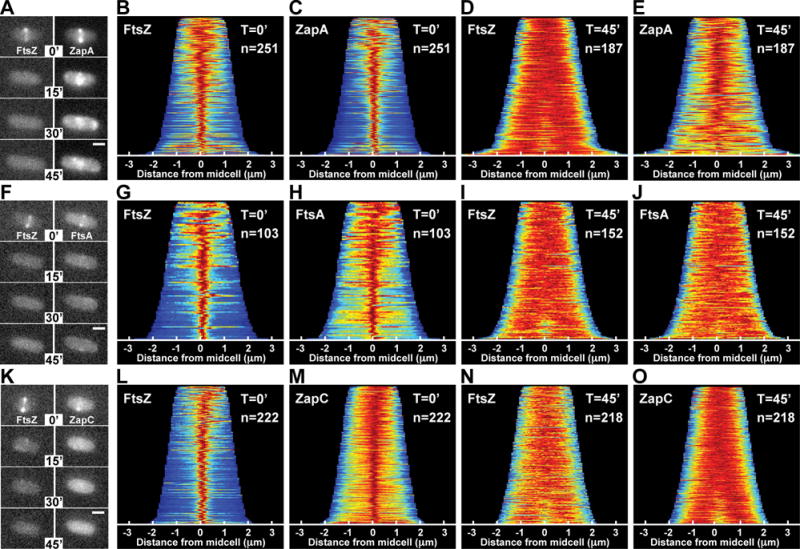
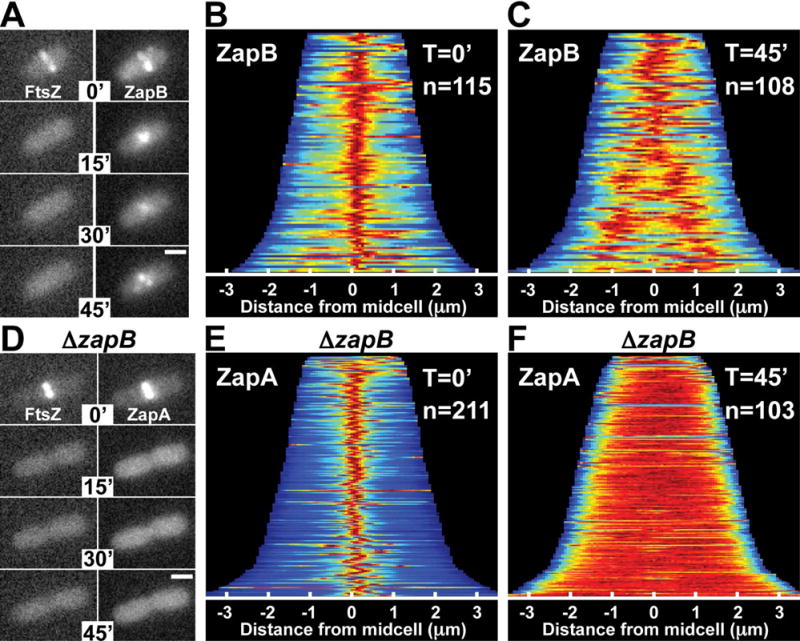
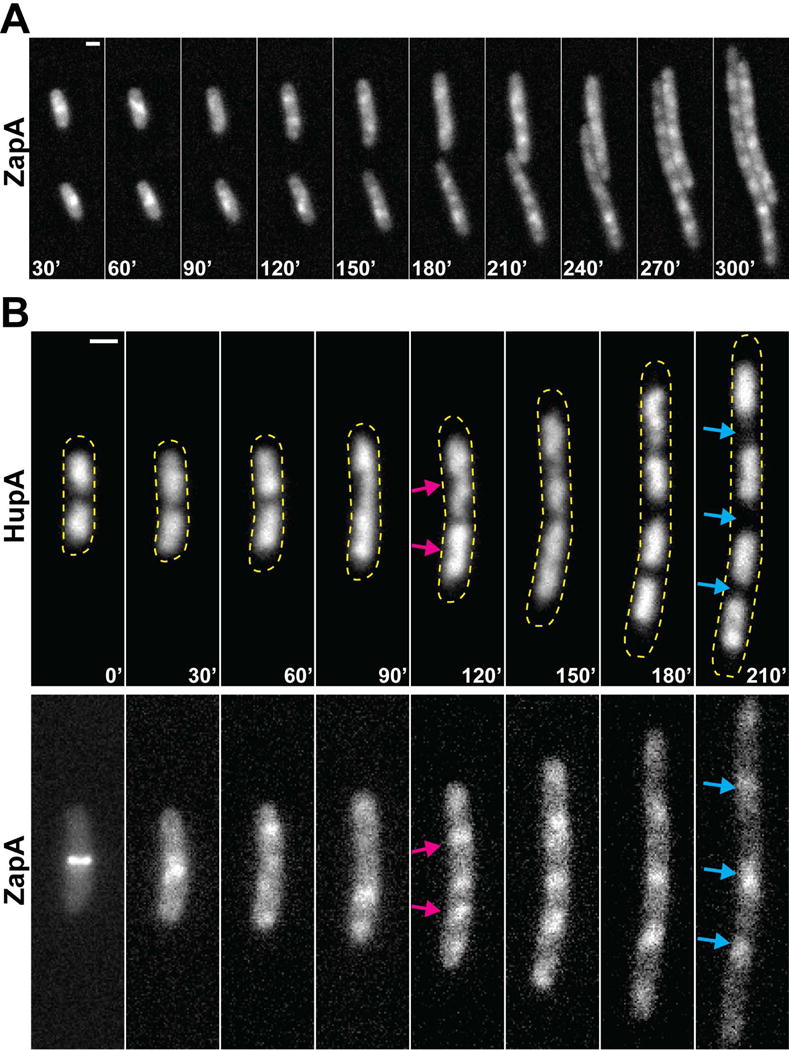
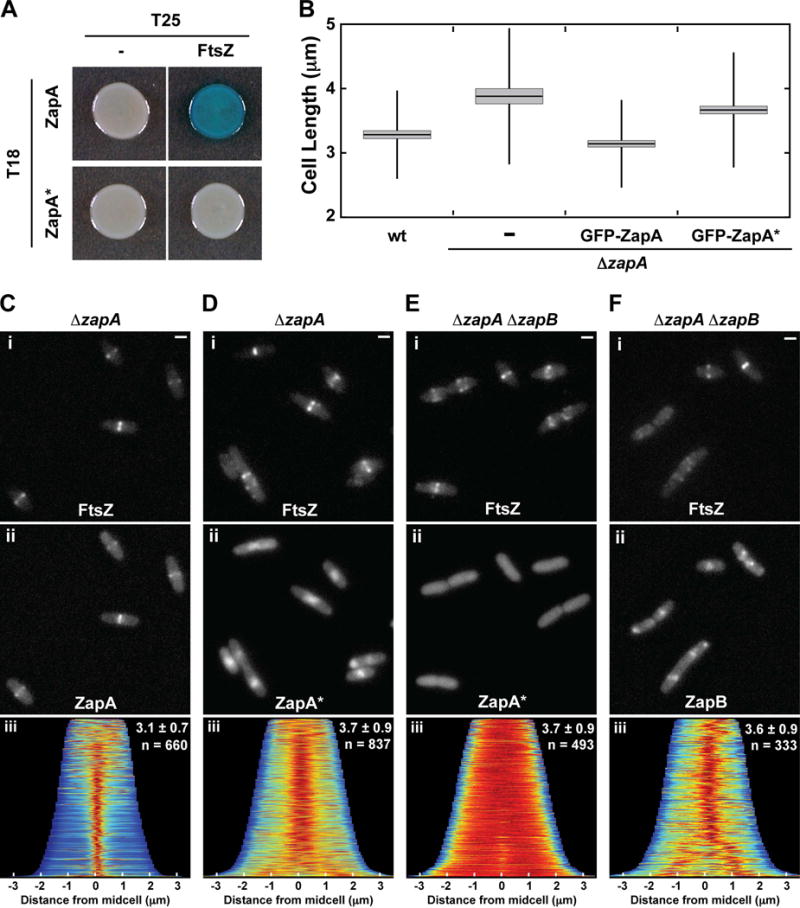
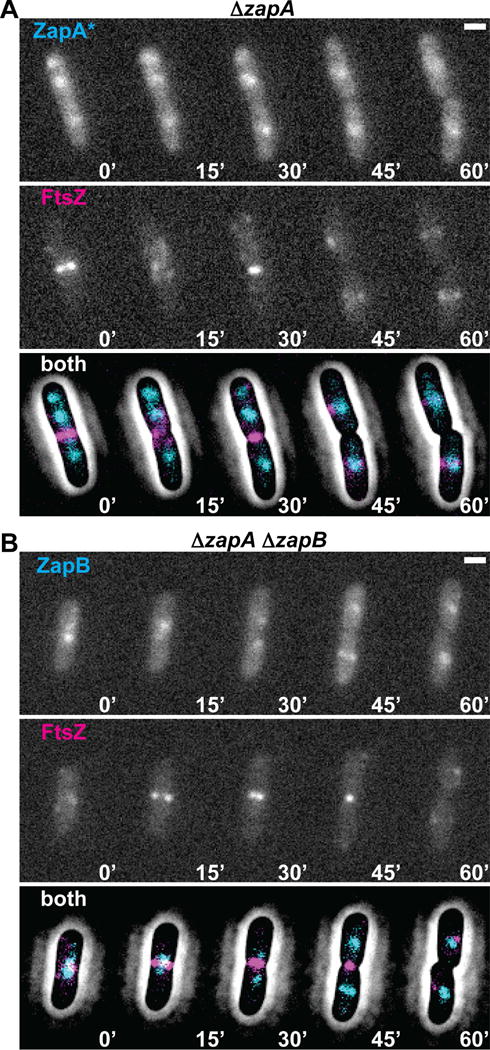
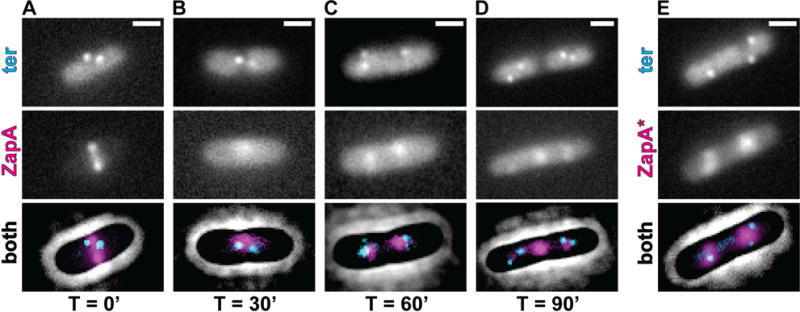
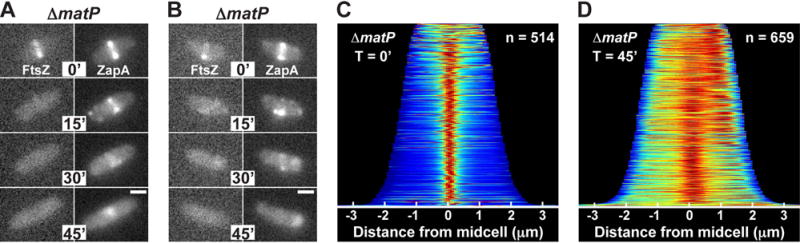
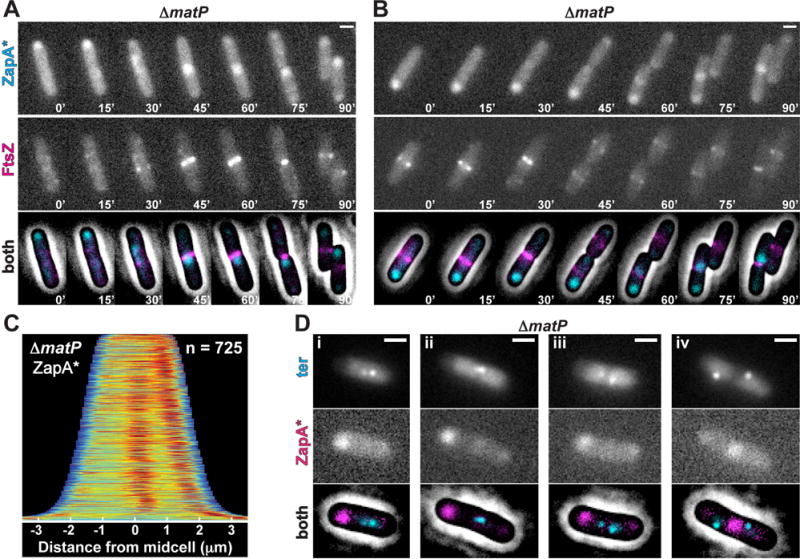
Cell division in Escherichia coli begins with the polymerization of FtsZ into a ring-like structure, the Z-ring, at midcell. All other division proteins are thought to require the Z-ring for recruitment to the future division site. Here, it is reported that the Z-ring associated proteins ZapA and ZapB form FtsZ-independent structures at midcell. Upon Z-ring disruption by the FtsZ polymerization antagonist SulA, ZapA remained at midcell as a cloud-like accumulation. Using ZapA(N60Y), a variant defective for interaction with FtsZ, it was established that these ZapA structures form without a connection to the Z-ring. Furthermore, midcell accumulations of GFP-ZapA(N60Y) often preceded Z-rings at midcell and required ZapB to assemble, suggesting that ZapB polymers form the foundation of these structures. In the absence of MatP, a DNA-binding protein that links ZapB to the chromosomal terminus region, cloud-like ZapA structures still formed but failed to track with the chromosome terminus and did not consistently precede FtsZ at midcell. Taken together, the results suggest that FtsZ-independent structures of ZapA-ZapB provide additional positional cues for Z-ring formation and may help coordinate its assembly with chromosome replication and segregation.


Figures

Figure 1
Figure 1. ZapA structures persist after FtsZ-ring disassembly
The localization of mCherry-FtsZ (expressed from attλNP145) and either ZapA-GFP (A–E, from its native chromosomal locus), GFP-FtsA (F–J, expressed from attHKHC427) or ZapC-GFP (K–O, expressed from attHKNP162) was followed in wild-type cells during a time-course following sulA induction from pNP146 (0–45min). (A,F,K) Montages of fluorescence images depicting representative single cells in both color channels following sulA induction (0–45min). The protein fusion being monitored is indicated in the top panel (left, red channel; right, green channel). (B–E, G–J, L–O) Population demographs illustrate the localization trend of an indicated fusion protein for a representative population immediately following sulA induction (T=0′) or 45min post-induction (T=45′). The majority of cells at T=0′ display midcell localization for all fluorescence constructs tested (B–C, G–H, L–M). At T=45′, only ZapA-GFP retains midcell localization (D-E, I-J, N-O). Midcell persistence of ZapA-GFP results in an altered appearance transforming from a tight-band (A,C) to a broad, cloud-like structure (A,E). Scale bars = 1μm.
Figure 2
Figure 2. ZapB structures persist after FtsZ-ring disassembly, and are required for ZapA cloud formation
(A) Fluorescence images of mCherry-FtsZ (expressed from attλNP145) and GFP-ZapB (expressed from attHKJAB034) in ΔzapB [DL56] cells during a time-course following sulA induction from pNP146 (0–45min). (B–C) Population demographs for GFP-ZapB in cells from (A) at T=0′ and T=45′ post sulA induction. (D) Fluorescence images of mCherry-FtsZ (expressed from attλNP145) and ZapA-GFP (expressed from its native locus) in ΔzapB cells [NP298] during a time-course following sulA induction (0–45min). (E–F) Population demographs for ZapA-GFP in cells from (D) at T=0′ (E) and T=45′ (F). Scale bars = 1μm.
Figure 3
Figure 3. ZapA structures assemble between segregating nucleoids
(A) Representative fluorescence time-lapse images of ZapA-GFP (expressed from its native locus in NP1) in two cells 30min after sulA induction from pNP146 (30–300min). (B) Representative fluorescence time-lapse images of a single cell expressing ZapA-GFP and HupA-mCherry (expressed from their native loci in NP127) during a time-course following sulA induction (0–210min). Arrows indicate ZapA-GFP localization between actively segregating (bilobed) nucleoids (magenta) or nucleoid-free regions (cyan). Yellow dashed lines approximate the cellular perimeter. Scale bars = 1μm.
Figure 4
Figure 4. ZapA(N60Y) fails to bind FtsZ, and assembles into ZapB-dependent midcell clouds
(A) Bacterial two-hybrid results for T18-ZapA (pJB132) and T18-ZapA(N60Y) (ZapA*, pJAB047) paired with unfused T25 (pKT25) and T25-FtsZ (pJB145). (B) Box plots of cell length measurements for wild-type [TB28] and ΔzapA [TB119] cells expressing no fusion protein (−), GFP-ZapA (from attHKJAB032) or GFP-ZapA(N60Y) (GFP-ZapA*, from attHKJAB033). The mean (horizontal line) and standard deviation (vertical line) are illustrated along with the 95% confidence interval (light gray box). Representative micrographs of ΔzapA [TB119] (C–D) or ΔzapA ΔzapB [JAB470] (E–F) cells expressing mCherry-FtsZ (attλNP145, Ci–Fi) and either GFP-ZapA (from attHKJAB032, Cii), GFP-ZapA(N60Y) (attHKJAB033, Dii and Eii), or GFP-ZapB (from attHKJAB034, Fii). Population demographs (Ciii, Diii, and Eiii) illustrate the localization of GFP-ZapA, GFP-ZapA(N60Y), or GFP-ZapB, respectively, in the populations measured in B. Mean length ± standard deviation (μm), along with sample size (n) are indicated in the top right. Scale bars = 1μm
Figure 5
Figure 5. FtsZ-independent ZapA(N60Y) and ZapB structures precede Z-ring assembly at midcell
(A) Time-lapse fluorescence images of a single cell expressing GFP-ZapA(N60Y) (ZapA*, from attHKJAB033) and mCherry-FtsZ (from attλNP145) in ΔzapA [TB119] cells. Below the images of individual fluorescence channels is a combined image of GFP-ZapA(N60Y) (cyan) and mCherry-FtsZ (magenta) overlaid with a contrast-adjusted phase image. (B) Similar time-lapse fluorescence images of a single cell expressing GFP-ZapB (from attHKJAB034) and mCherry-FtsZ (from attλNP145) in ΔzapA ΔzapB [JAB470] cells. Images are as in (A). Scale bars = 1μm.
Figure 6
Figure 6. ZapA and ZapA(N60Y) largely colocalize with the chromosomal ter region
(A–D) Fluorescence micrographs of GFP-ParB (ter, cyan) and ZapA-mCherry (magenta, expressed from its native locus) in strain JAB338 are shown together with a contrast-adjusted phase image during a time course (0–90min) following sulA induction from pNP146. (E) A representative micrograph of GFP-ParB (ter, cyan) and ZapA(N60Y)-mCherry (ZapA*, magenta, expressed from native zapA locus) in strain JAB374 during normal growth. Scale bars = 1μm.
Figure 7
Figure 7. MatP influences ZapA cloud positioning following sulA induction
(A–B) Fluorescence images of mCherry-FtsZ (from attλNP145) and ZapA-GFP (native locus) in ΔmatP [NP301] cells during a time course (0–45min) following sulA induction from pNP146 in minimal medium. (C–D) Population demographs for ZapA-GFP immediately following sulA induction (T=0′) or 45min post-induction (T=45′). Scale bars = 1μm.
Figure 8
Figure 8. ZapA(N60Y) localization in ΔmatP cells
(A–B) Time-lapse fluorescence images of single cells expressing GFP-ZapA(N60Y) (ZapA*, from attHKJAB033) and mCherry-FtsZ (from attλNP145) in ΔzapA ΔmatP [NP314] cells during slow growth. (C) Population demograph illustrating the localization of GFP-ZapA(N60Y) (ZapA*) in a population of ΔzapA ΔmatP [NP314] cells in minimal medium. (Di–iv) Fluorescence images of GFP-ParB (ter, cyan) and ZapA(N60Y)-mCherry (magenta, expressed from its native locus) from JAB378 cells grown in minimal medium. Images are as in Figure 5A. Scale bars = 1μm.

References

    1. Baba T, Ara T, Hasegawa M, Takai Y, Okumura Y, Baba M, et al. Construction of Escherichia coli K-12 in-frame, single-gene knockout mutants: the Keio collection. Mol Syst Biol. 2006;2:2006.0008. - PMC - PubMed
    1. Bailey MW, Bisicchia P, Warren BT, Sherratt DJ, Männik J. Evidence for Divisome Localization Mechanisms Independent of the Min System and SlmA in Escherichia coli. PLoS Genet. 2014;10:e1004504. - PMC - PubMed
    1. Bernhardt TG, de Boer PAJ. SlmA, a nucleoid-associated, FtsZ binding protein required for blocking septal ring assembly over chromosomes in E. coli. Mol Cell. 2005;18:555–564. - PMC - PubMed
    1. Bi E, Lutkenhaus J. Cell division inhibitors SulA and MinCD prevent formation of the FtsZ ring. J Bacteriol. 1993;175:1118–1125. - PMC - PubMed
    1. Bi EF, Lutkenhaus J. FtsZ ring structure associated with division in Escherichia coli. Nature. 1991;354:161–164. - PubMed

MeSH terms

LinkOut - more resources