. 2017 Mar 1;18(1):217.
doi: 10.1186/s12864-017-3540-x.

Genome-wide transcriptomics of aging in the rotifer Brachionus manjavacas, an emerging model system

Affiliations

Genome-wide transcriptomics of aging in the rotifer Brachionus manjavacas, an emerging model system

Kristin E Gribble et al. BMC Genomics. .

Abstract

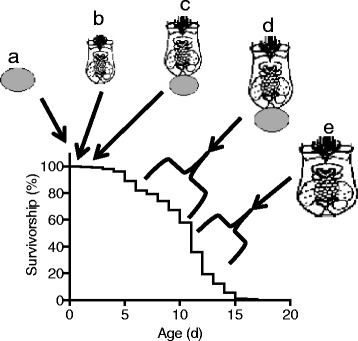
Background: Understanding gene expression changes over lifespan in diverse animal species will lead to insights to conserved processes in the biology of aging and allow development of interventions to improve health. Rotifers are small aquatic invertebrates that have been used in aging studies for nearly 100 years and are now re-emerging as a modern model system. To provide a baseline to evaluate genetic responses to interventions that change health throughout lifespan and a framework for new hypotheses about the molecular genetic mechanisms of aging, we examined the transcriptome of an asexual female lineage of the rotifer Brachionus manjavacas at five life stages: eggs, neonates, and early-, late-, and post-reproductive adults.

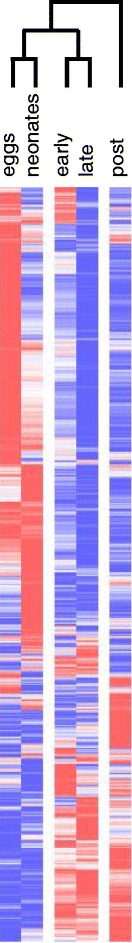
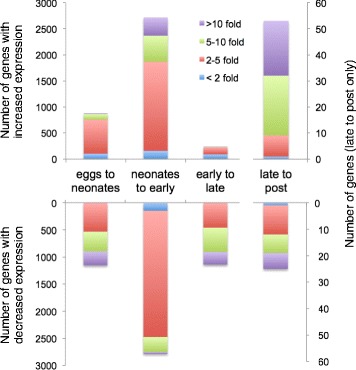
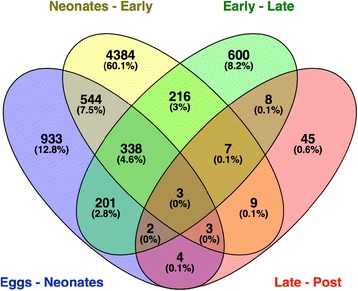
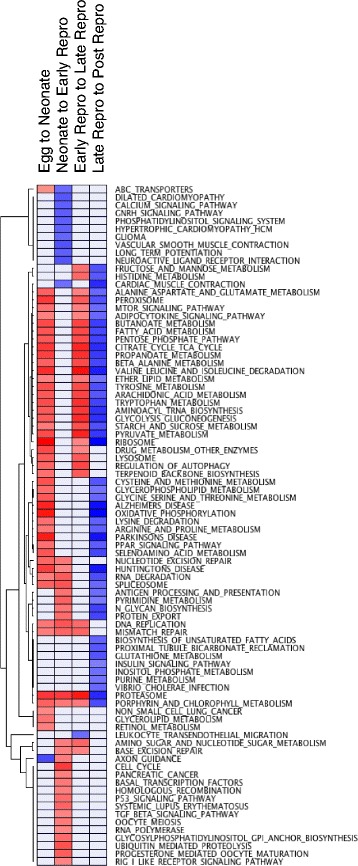
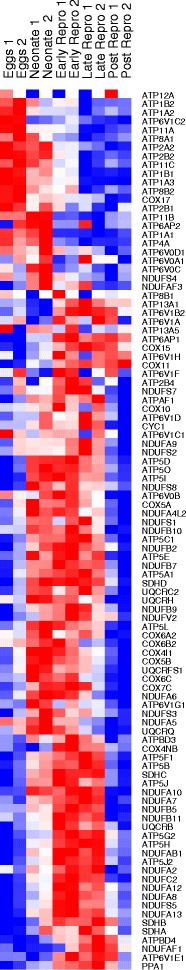
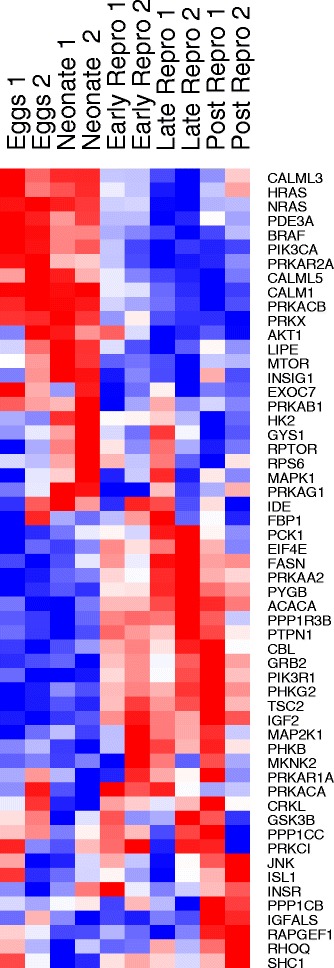
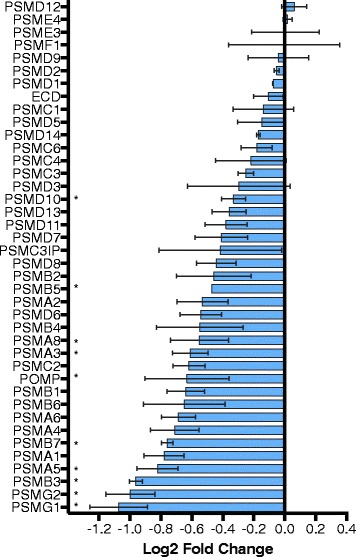
Results: There are widespread shifts in gene expression over the lifespan of B. manjavacas; the largest change occurs between neonates and early reproductive adults and is characterized by down-regulation of developmental genes and up-regulation of genes involved in reproduction. The expression profile of post-reproductive adults was distinct from that of other life stages. While few genes were significantly differentially expressed in the late- to post-reproductive transition, gene set enrichment analysis revealed multiple down-regulated pathways in metabolism, maintenance and repair, and proteostasis, united by genes involved in mitochondrial function and oxidative phosphorylation.

Conclusions: This study provides the first examination of changes in gene expression over lifespan in rotifers. We detected differential expression of many genes with human orthologs that are absent in Drosophila and C. elegans, highlighting the potential of the rotifer model in aging studies. Our findings suggest that small but coordinated changes in expression of many genes in pathways that integrate diverse functions drive the aging process. The observation of simultaneous declines in expression of genes in multiple pathways may have consequences for health and longevity not detected by single- or multi-gene knockdown in otherwise healthy animals. Investigation of subtle but genome-wide change in these pathways during aging is an important area for future study.

Keywords: Aging; Monogonont; RNA-Seq; Rotifer; Transcriptome.


Figures

Fig. 1
Fig. 1
Representative survivorship curve of asexual Brachionus manjavacas females. The life stages collected for analysis are shown: a eggs; b neonates, 3 hrs old; c early reproduction, 36 h old; d late reproduction, 5–7 days old; e post-reproductive, 8–9 days old. Median rotifer lifespan is 9–11 days. Reproduction begins at 36 h and peaks by day 5; rotifers are post-reproductive after 8–9 days, with a post-reproductive period of 2–4 days
Fig. 2
Fig. 2
Relative expression profiles between life stages in Brachionus manjavacas. Heatmap of genes significantly differentially expressed between at least two life stages with hierarchical clustering of average FPKM across two biological replicates performed by average linkage 1- Pearson’s correlation. Data are row-normalized, with red indicating highest expression and blue indicating lowest expression
Fig. 3
Fig. 3
Differential expression at life stage transitions in Brachionus manjavacas. Bars indicate the number of significantly differentially expressed genes is indicated for each transition, with color indicating fold-change (3-fold change = 23 difference in transcript abundance). Note that the late- to post-reproductive transition uses the right y-axis
Fig. 4
Fig. 4
Shared differential expression between life stage transitions in Brachionus manjavacas. Venn diagram showing number and percentage of significantly differentially expressed genes (both up and down-regulated), in each transition and the overlap of genes shared between transitions
Fig. 5
Fig. 5
Heatmap of KEGG pathways significantly enriched between life stages in Brachionus manjavacas. Pathways that were significantly up-regulated or down-regulated are shaded red to blue, respectively, and scaled per row (GSEA, FDR < 0.25). Grey indicates no significant enrichment (GSEA, FDR ≥ 0.25)
Fig. 6
Fig. 6
Relative expression of oxidative phosphorylation pathway genes between life stages in Brachionus manjavacas. Heatmap shows two biological replicates for each life stage. Data are row-normalized, with red indicating highest expression and blue indicating lowest expression
Fig. 7
Fig. 7
Relative expression of insulin signaling pathway genes between life stages in Brachionus manjavacas.. Heatmap shows two biological replicates for each life stage. Data are row-normalized, with red indicating highest expression and blue indicating lowest expression
Fig. 8
Fig. 8
Expression change of proteasome subunit and assembly genes in the late- to post reproduction transition. Bars show mean fold change ± standard deviation of two biological replicates. * indicates significantly different expression between the two life stages (p ≤ 0.05, one-tailed t-test)
Fig. 9
Fig. 9
Expression change of tyrosine metabolism pathway genes between late- and post reproduction in Brachionus manjavacas. Blue arrows indicate the observed decline in expression of enzymes that catalyze metabolism of tyrosine
Fig. 10
Fig. 10
Expression change of calcium signaling pathway genes between life stages in Brachionus manjavacas. Heatmap shows two biological replicates for each life stage. Data are row-normalized, with red indicating highest expression and blue indicating lowest expression
Fig. 11
Fig. 11
Expression of histone acetylase and deacetylase genes at each life stage in Brachionus manjavacas. Bars show mean expression as log2 of Fragments Per Kilobase of transcript per Million mapped reads (FPKM) ± standard deviation of two biological replicates
Fig. 12
Fig. 12
Expression of sirtuin family genes at each life stages in Brachionus manjavacas. Bars show mean expression as log2 of Fragments Per Kilobase of transcript per Million mapped reads (FPKM) ± standard deviation of two biological replicates
Fig. 13
Fig. 13
Expression of histone methyltransferase and demethylase genes at each life stages in Brachionus manjavacas. Bars show mean expression as log2 of Fragments Per Kilobase of transcript per Million mapped reads (FPKM) ± standard deviation of two biological replicates

Similar articles

Cited by

References

    1. López-Otín C, Blasco MA, Partridge L, Serrano M, Kroemer G. The hallmarks of aging. Cell. 2013;153:1194–1217. doi: 10.1016/j.cell.2013.05.039. - DOI - PMC - PubMed
    1. Takahashi T, McDougal C, Troscianko J, Chen W-C, Jayaraman-Nagarajan A, Shimeld SM, Ferrier DEK. An EST screen from the annelid Pomatoceros lamarckii reveals patterns of gene loss and gain in animals. BMC Evol Biol. 2009;9:240. doi: 10.1186/1471-2148-9-240. - DOI - PMC - PubMed
    1. Wyder S, Kriventseva E, Schroder R, Kadowaki T, Zdobnov E. Quantification of ortholog losses in insects and vertebrates. Genome Biol. 2007;8(11):R242. doi: 10.1186/gb-2007-8-11-r242. - DOI - PMC - PubMed
    1. Zmasek CM, Zhang Q, Ye Y, Godzik A. Surprising complexity of the ancestral apoptosis network. Genome Biol. 2007;8(10):R226. doi: 10.1186/gb-2007-8-10-r226. - DOI - PMC - PubMed
    1. Dieterich C, Clifton SW, Schuster LN, Chinwalla A, Delehaunty K, Dinkelacker I, Fulton L, Fulton R, Godfrey J, Minx P, et al. The Pristionchus pacificus genome provides a unique perspective on nematode lifestyle and parasitism. Nat Genet. 2008;40(10):1193–8. - PMC - PubMed

Publication types

LinkOut - more resources