. 2017 Mar 1;18(1):44.
doi: 10.1186/s13059-017-1169-3.

ddClone: joint statistical inference of clonal populations from single cell and bulk tumour sequencing data

Affiliations

ddClone: joint statistical inference of clonal populations from single cell and bulk tumour sequencing data

Sohrab Salehi et al. Genome Biol. .

Abstract

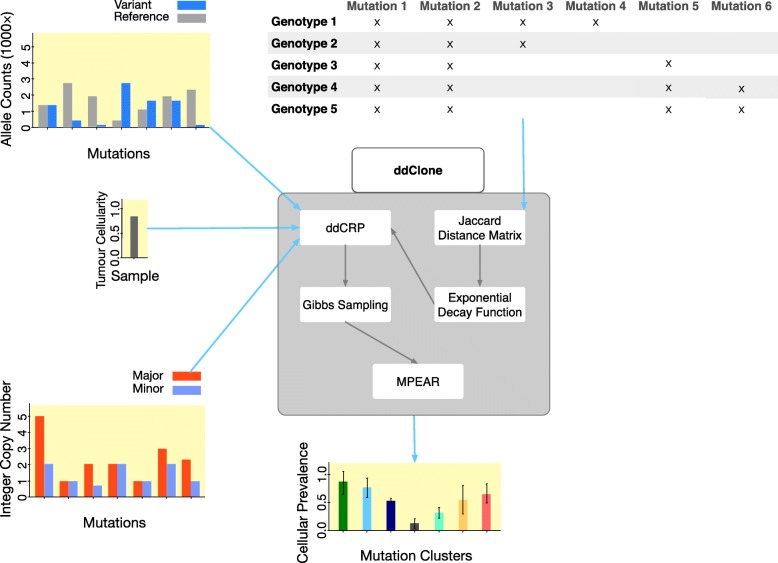
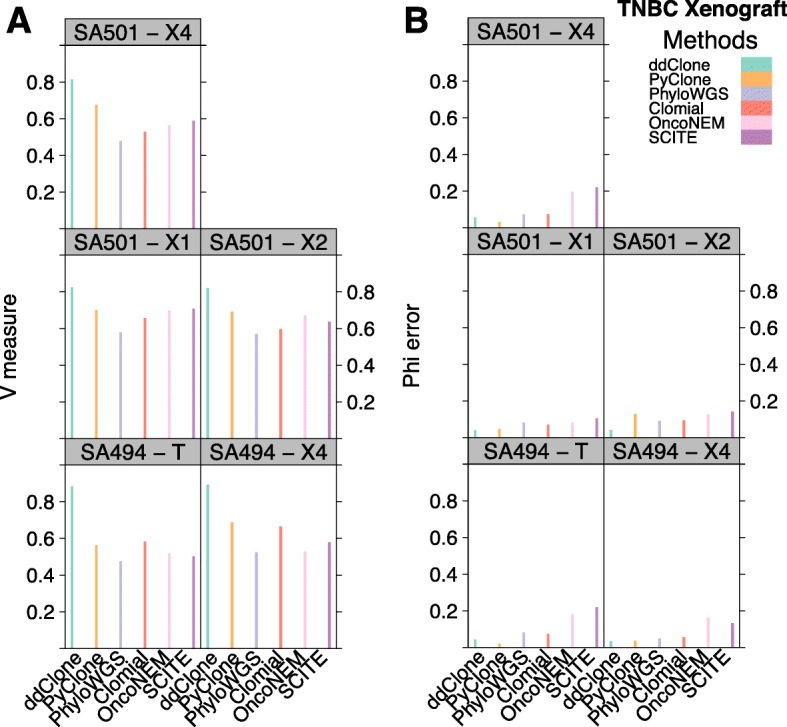
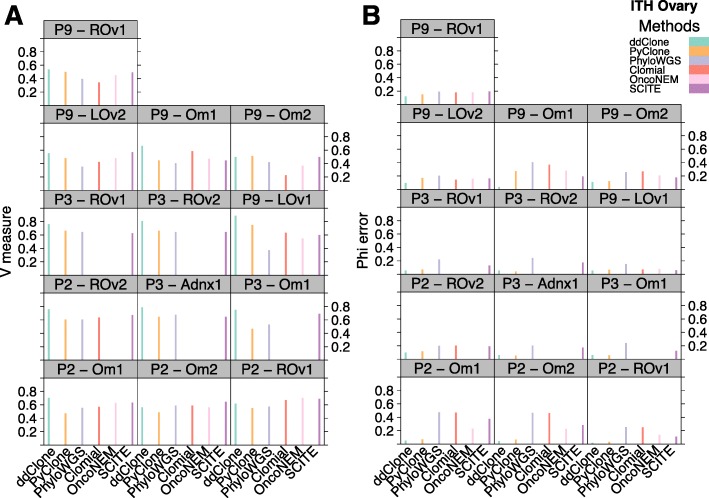
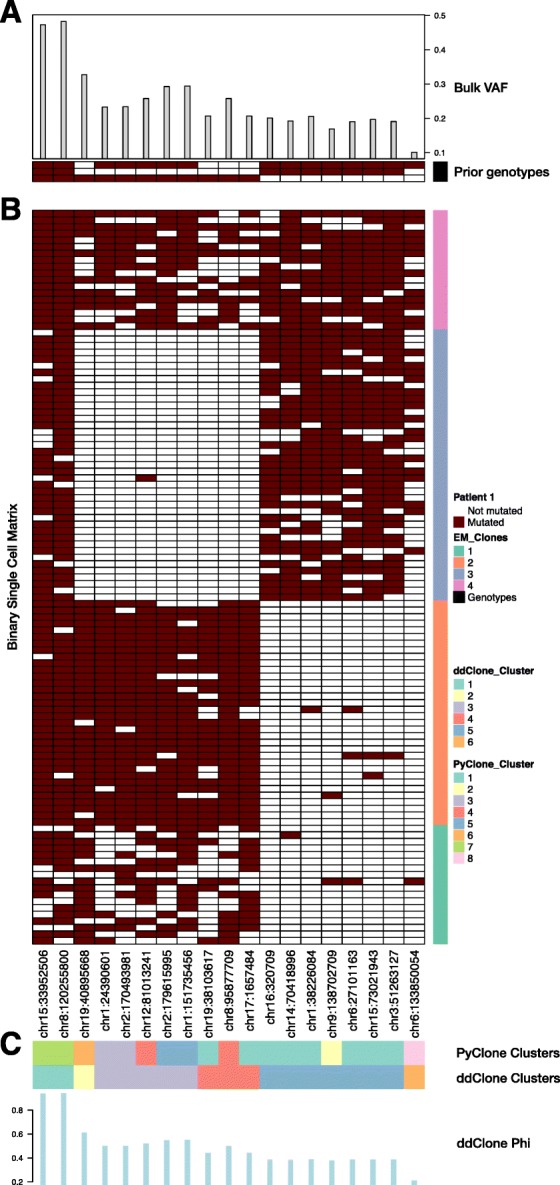
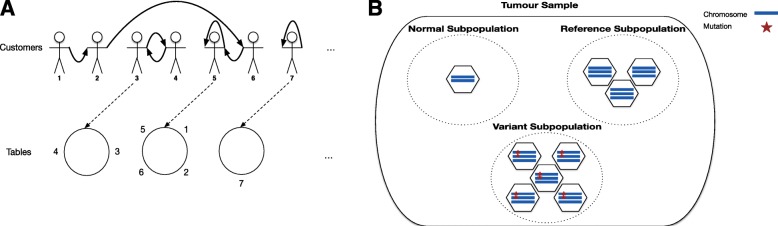
Next-generation sequencing (NGS) of bulk tumour tissue can identify constituent cell populations in cancers and measure their abundance. This requires computational deconvolution of allelic counts from somatic mutations, which may be incapable of fully resolving the underlying population structure. Single cell sequencing (SCS) is a more direct method, although its replacement of NGS is impeded by technical noise and sampling limitations. We propose ddClone, which analytically integrates NGS and SCS data, leveraging their complementary attributes through joint statistical inference. We show on real and simulated datasets that ddClone produces more accurate results than can be achieved by either method alone.

Keywords: Chinese restaurant process; Clonal evolution; Distance dependent; Intra-tumour heterogeneity; Joint probabilistic model; Next-generation sequencing; Single cell sequencing.


Figures

Fig. 1
Fig. 1
The workflow of ddClone. This figure shows the workflow of our method, ddClone. The ddClone approach is predicated on the notion that single cell sequencing data will inform and improve clustering of allele fractions derived from bulk sequencing data in a joint statistical model. ddClone combines a Bayesian non-parametric prior informed by single cell data with a likelihood model based on bulk sequencing data to infer clonal population architecture. Intuitively, the prior encourages genomic loci with co-occurring mutations in single cells to cluster together. Using a cell-locus binary matrix from single cell sequencing, ddClone computes a distance matrix between mutations using the Jaccard distance with exponential decay. This matrix is then used as a prior for inference over mutation clusters and their prevalences from deeply sequenced bulk data in a distance-dependent Chinese restaurant process framework. The output of the model is the most probable set of clonal genotypes present and the prevalence of each genotype in the population
Fig. 2
Fig. 2
Simulated phylogenetic tree (panel a) and the resulting binarized cell genotype matrix (panel b). Transposed binarized simulated cell genotypes Δ from Generalized Dollo process over a fixed phylogeny. The original cell genotype matrix Δ CN is in copy number space. We binarize it by setting entries with non-zero variant allele copy number to one (coloured red) and setting entries with variant allele copy number of zero to zero (coloured blue). The clonal prevalence of each genotype is in parentheses
Fig. 3
Fig. 3
Performance analysis in presence of sampling distortion. Effect of sampling distortion on V-measure index (panel a) and mean absolute error of cellular prevalences (panel b) across multiple values for the total number of single cells (specified on top of each panel). Each box plot represents 10 simulated datasets each with 10 genotypes and 48 genomic loci. The cells are sampled from a Dirichlet-multinomial distribution with sample size m∈{50,100,200,500,1000} and parameters equal to the true prevalence of each genotype scaled by the concentration coefficient λ. The larger the λ, the closer the Dirichlet-multinomial distribution approximates the multinomial distribution. At higher values of λ the sampled cells better represent the true proportions of genotypes. Estimated values of λ for the real datasets are annotated on panel (b). We note that OncoNEM did not converge when number of cells exceeded 100 (boxes marked by a star). This result suggests that ddClone’s clustering and cellular prevalence estimates are fairly robust to the presence of distorted single cell sampling
Fig. 4
Fig. 4
Benchmarking results over simulated data. Performance results for ddClone, single cell-only, and bulk data methods on ten synthetic datasets. ddClone and single cell-only methods were provided with single cells, either (1) 50 cells, sampled from a multinomial distribution with true genotype prevalences as parameters (labelled ddClone(λ=), OncoNEM(λ=), and SCITE(λ=)) in absence of doublet and ADO noise, or (2) 50 cells sampled from a Dirichlet-multinomial distribution with λ=10, constituting moderate to small levels of sampling bias (labelled as ddClone(λ=10), OncoNEM(λ=10), and SCITE(λ=10), or (3) 50 cells sampled from a Dirichlet-multinomial distribution with λ=1.12, constituting high levels of sampling bias (labelled as ddClone(λ=1.12), OncoNEM(λ=1.12), and SCITE(λ=1.12), where in the case of (2) and (3), 30% of cells are doublets and r ADO=30%. Panel a shows V-measure clustering performance. Panel b shows the average over loci of the absolute differences between the inferred and true cellular prevalences. This result shows that in the presence of reasonable levels of noise, ddClone performs comparably well in terms of both V-measure and the accuracy of inferred cellular prevalences
Fig. 5
Fig. 5
Performance analysis in presence of doublets. Effect of presence of doublets on V-measure index (panel a) and mean absolute error of cellular prevalences (panel b) across multiple values for the total number of single cells (specified as m on top of each panel). Each box plot represents 10 simulated datasets each with 10 genotypes and 48 genomic loci. The cells are sampled from a multinomial distribution with a sample size of m and parameters equal to the true prevalence of each genotype. Progressively increasing the percentage of doublet cells results in minor degrading performance in cellular prevalence estimate. Overall, this result suggests that ddClone’s cellular prevalence estimates are robust to the presence of uncorrected doublet noise
Fig. 6
Fig. 6
Performance analysis in presence of allele drop-outs. Effect of presence of allele drop-outs (ADO) on V-measure index (panel a) and mean absolute error of cellular prevalences (panel b) across multiple values for the total number of single cells (specified as m on top of each panel). Each box plot represents 10 simulated datasets each with 10 genotypes and 48 genomic loci. The cells are sampled from a multinomial distribution with a sample size of m and parameters equal to the true prevalence of each genotype. As expected, progressively increasing the ADO rate results in degrading performance in both clustering and cellular prevalence estimates. The detrimental effect dampens as the number of sampled cells increases
Fig. 7
Fig. 7
Performance analysis in presence of loss of multiple genotypes. Effect of removing genotypes on V-measure index (panel a) and mean absolute error of cellular prevalences (panel b). Unsurprisingly, progressively removing more cell genotypes (in increasing order of prevalence) results in monotonically degrading performance However, when as few as approximately half of the genotypes are available to encode in the prior, ddClone still outperforms the naive methods in terms of cellular prevalence estimate
Fig. 8
Fig. 8
Genotypes curated for the triple-negative breast cancer data. Binary cell genotype matrices for sample SA494 over 28 genomic loci (left) and sample SA501 over 38 genomic loci (right). These are manually curated from a single cell genotype sequencing experiment [24]. Briefly, MrBayes was used to infer a consensus phylogenetic tree over the single nuclei. Then they were grouped into clades according to high probability branching splits. Finally, each clade was assigned a consensus genotype by taking the mode genotype of the clade at each genomic locus. Colour red indicates a mutated locus, while colour blue indicates a non-mutated locus
Fig. 9
Fig. 9
Benchmarking results over TNBC dataset. Performance results for ddClone and existing methods over TNBC SA501 X1, X2, X4, and SA494 T, X4. Panel a shows clustering assignment performance. Panel b shows cellular prevalence approximation mean absolute error. Evaluated against multi-sample PyClone, ddClone outperforms the second best performing method (PyClone) in terms of V-measure (Wilcoxon rank sum test with p value < 0.05) and performs as well (SA494, timepoint T) or better (all the other timepoints) than the second best performing method in terms of accuracy of inferred cellular prevalences
Fig. 10
Fig. 10
Benchmarking results over HGSOvCa dataset. Performance results for ddClone and existing methods over HGSOvCa data, from three patients: Patient 2 (P2) at sites Om1, Om2, ROv1, ROv2, Patient 3 (P3) at sites Adnx1, Om1, Rov1, Rov2, and Patient 9 (P9) at sites LOv1, LOv2, Om1, Om2, and ROv1. Panel a shows clustering assignment performance. Panel b shows cellular prevalence approximation mean absolute error. (Om1) Omentum sample 1, (Om2) Omentum sample 2, (ROv1) Right ovary sample 1, (ROv2) Right ovary sample 2, (LOv1) Left ovary sample 1, (LOv2) Left ovary sample 2, (Adnx1) Adnexa sample1
Fig. 11
Fig. 11
Analysis results of an acute lymphoblastic leukemia (ALL) dataset [12]. Analysis results of a patient with ALL (Patient 1) [12]. The variant allele frequencies (VAFs) from the bulk data (panel a, top) along with the consensus genotypes estimated from the binary cell matrix (panel A, bottom). These two constitute the input to the ddClone model. We note that the binary cell matrix b is displayed here for comparison and is not an input to ddClone. This binary cell matrix was used in [12] to cluster the cells into clones (vertical bar at the right side of the figure) and consensus genotypes (bottom part of panel a). ddClone clusters mutations into 6 groups (panel c, top) and estimates cellular prevalence (Φ) for each (panel c, bottom). ddClone’s estimated Φ are highly correlated with the corrected bulk VAFs (R 2=0.98, also see Additional file 1), suggesting that it does not introduce unreasonable structure in the data. Furthermore, when there is evidence in the bulk, it can override its prior and split clusters as necessary. For instance, even though locus chr19:40895668 has the same prior genotype as loci in cluster 4, its VAF in the bulk data is 1.5 times that of the mean of loci in cluster 4. This hints at a finer structure in cluster 4, and ddClone has automatically assigned chr19:40895668 to a separate cluster
Fig. 12
Fig. 12
Hypothesized sitting arrangement in ddCRP/subpopulation assumptions in the bulk data. a Induced table sitting T(C) by a particular customer connection configuration C. Bold arrows show customer connections and dotted arrows point to equivalent table sittings. Since customer 7 only has a self-loop, the corresponding table has only one customer. b Our assumption about clonal architecture in the tumour with respect to a particular genomic locus. In this example, normal subpopulation represents a collection of un-mutated diploid cells. Reference subpopulation comprises cells that have a copy number amplification event, but no single nucleotide mutations. Variant subpopulation is a collection of cells that have an SNV at the particular genomic locus

References

    1. Nowell PC. The clonal evolution of tumor cell populations. Science. 1976;194(4260):23–8. doi: 10.1126/science.959840. - DOI - PubMed
    1. Roth A, Khattra J, Yap D, Wan A, Laks E, Biele J, Ha G, Aparicio S, Bouchard-Côté A. Shah SP. PyClone: statistical inference of clonal population structure in cancer. Nat Meth. 2014;11(4):396–8. doi: 10.1038/nmeth.2883. - DOI - PMC - PubMed
    1. Navin N, Kendall J, Troge J, Andrews P, Rodgers L, McIndoo J, Cook K, Stepansky A, Levy D, Esposito D, et al. Tumour evolution inferred by single-cell sequencing. Nature. 2011;472(7341):90–4. doi: 10.1038/nature09807. - DOI - PMC - PubMed
    1. Roth A, Ding J, Morin R, Crisan A, Ha G, Giuliany R, Bashashati A, Hirst M, Turashvili G, Oloumi A, et al. JointSNVMix: a probabilistic model for accurate detection of somatic mutations in normal/tumour paired next-generation sequencing data. Bioinformatics. 2012;28(7):907–13. doi: 10.1093/bioinformatics/bts053. - DOI - PMC - PubMed
    1. Saunders CT, Wong WS, Swamy S, Becq J, Murray LJ, Cheetham RK. Strelka: accurate somatic small-variant calling from sequenced tumor–normal sample pairs. Bioinformatics. 2012;28(14):1811–7. doi: 10.1093/bioinformatics/bts271. - DOI - PubMed

Publication types

MeSH terms

Grants and funding

LinkOut - more resources