. 2017 May 15;77(10):2759-2769.
doi: 10.1158/0008-5472.CAN-16-3308. Epub 2017 Mar 1.

Individualized Breast Cancer Characterization through Single-Cell Analysis of Tumor and Adjacent Normal Cells

Affiliations

Individualized Breast Cancer Characterization through Single-Cell Analysis of Tumor and Adjacent Normal Cells

Manjushree Anjanappa et al. Cancer Res. .

Abstract

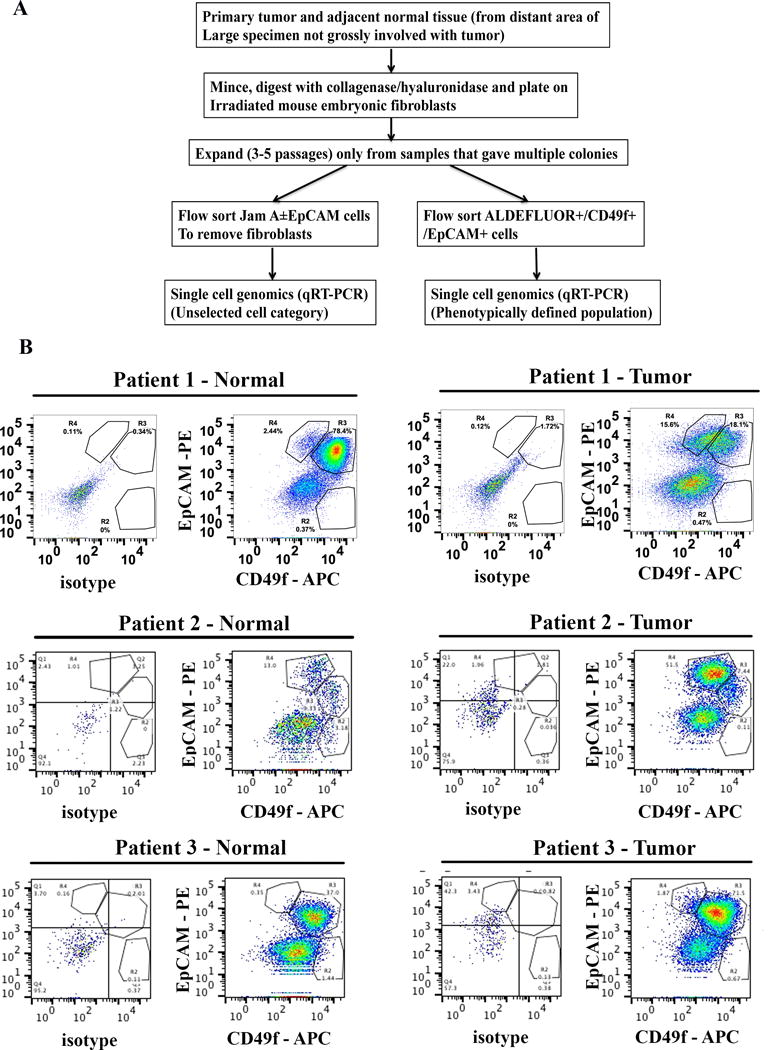
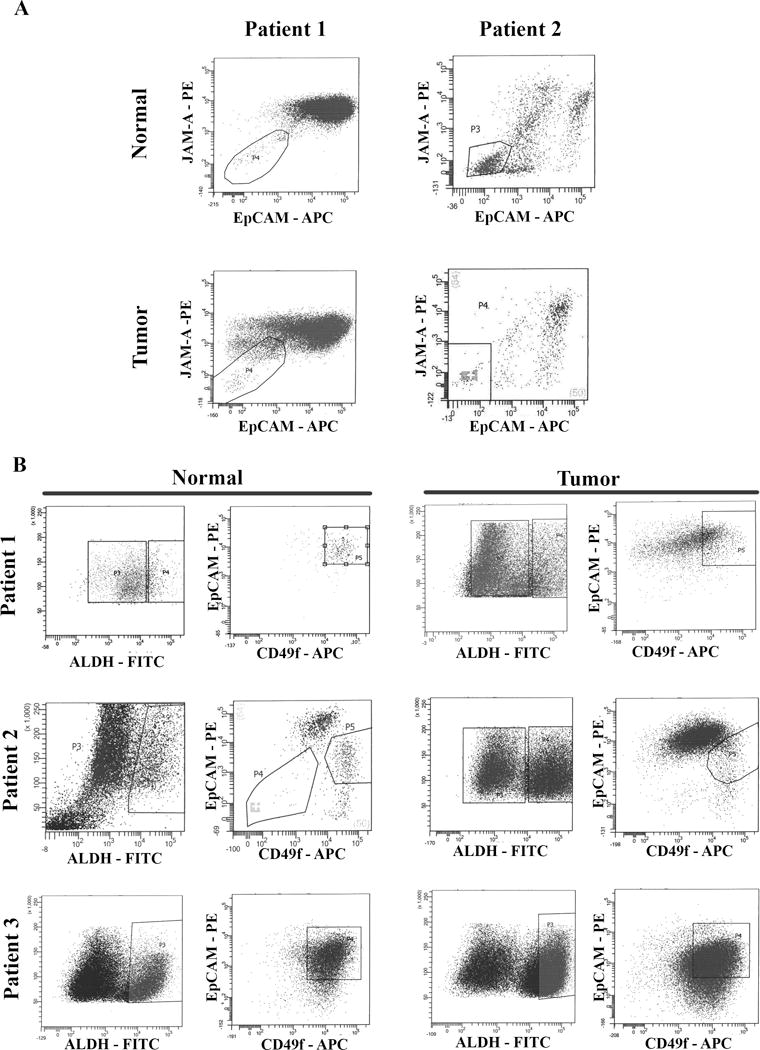
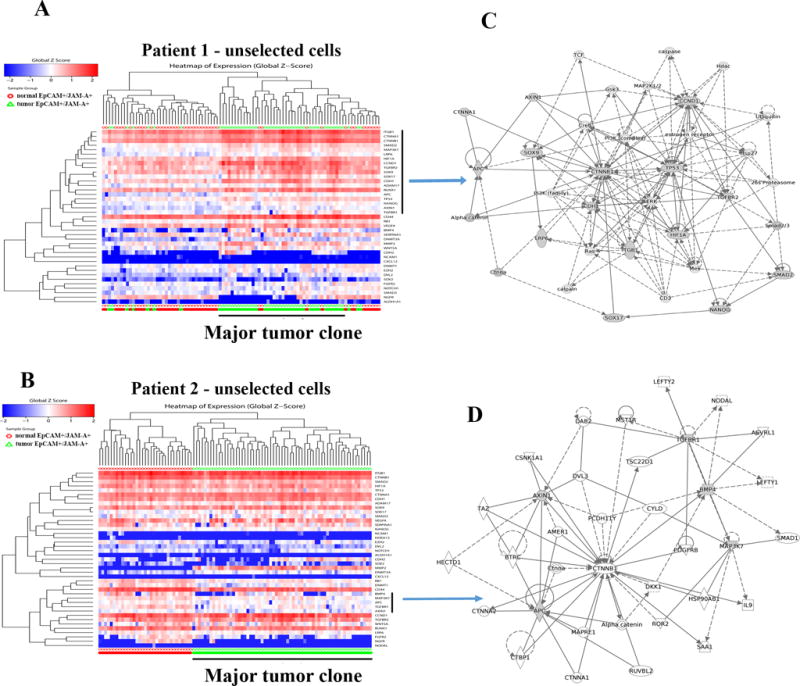
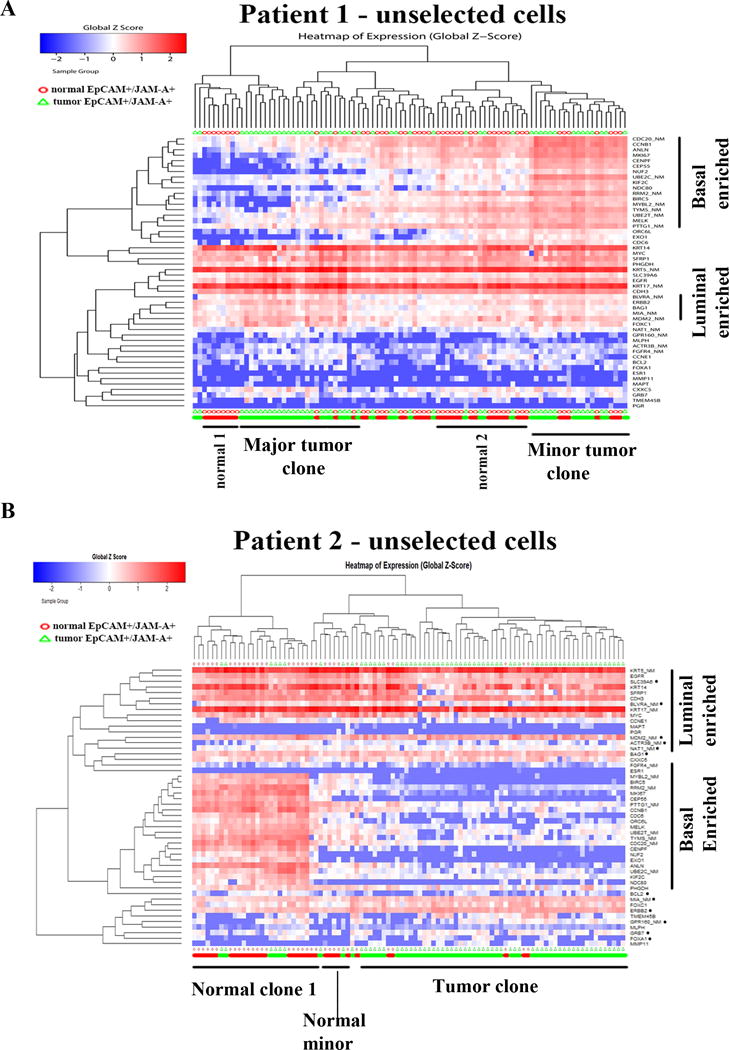
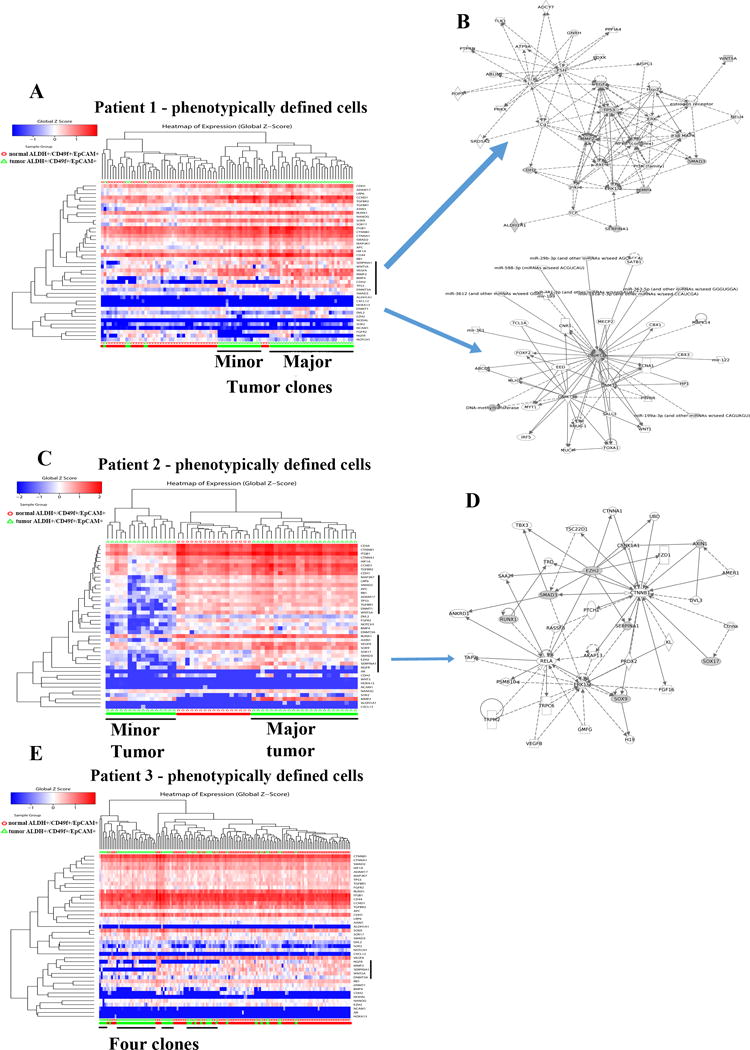
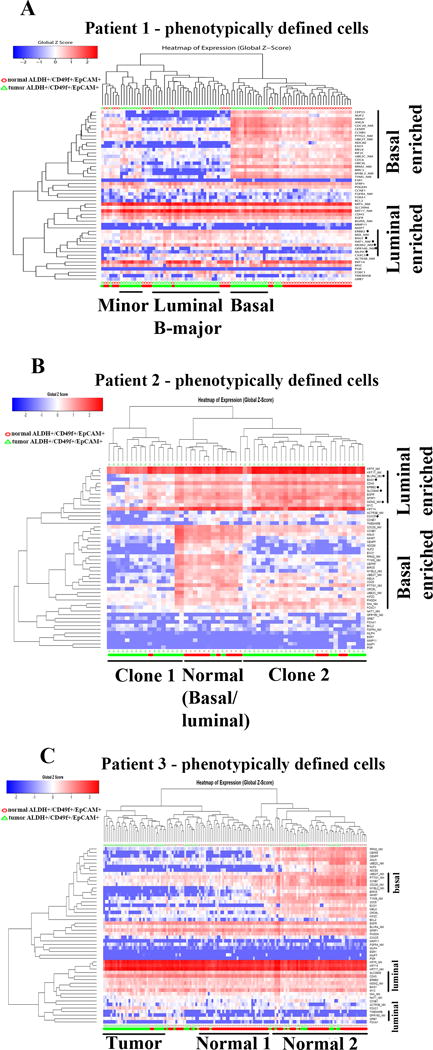
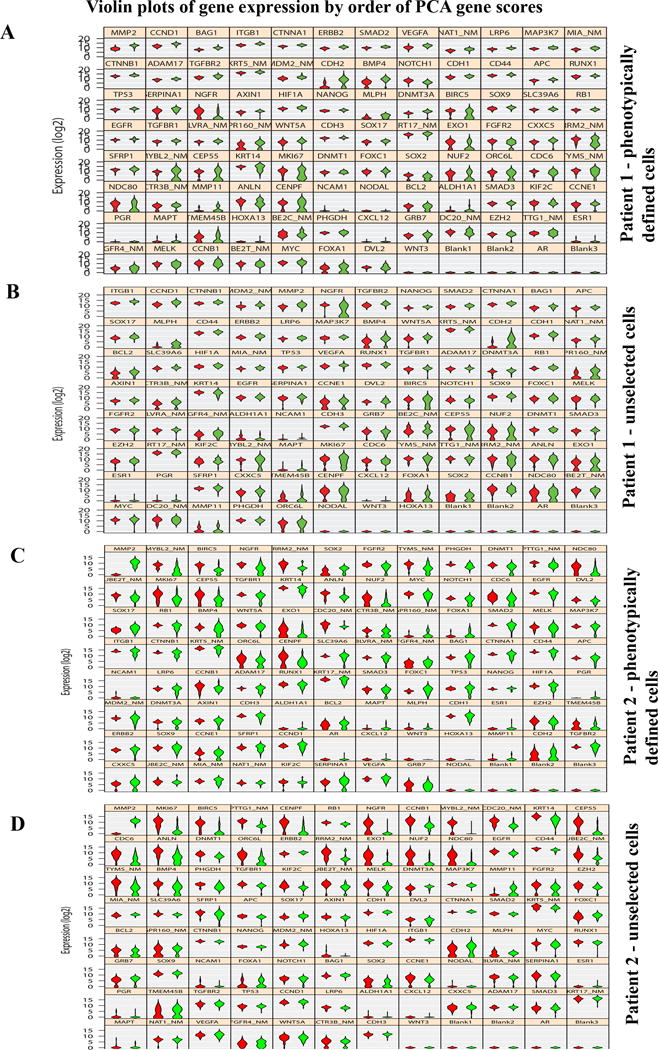
There is a need to individualize assays for tumor molecular phenotyping, given variations in the differentiation status of tumor and normal tissues in different patients. To address this, we performed single-cell genomics of breast tumors and adjacent normal cells propagated for a short duration under growth conditions that enable epithelial reprogramming. Cells analyzed were either unselected for a specific subpopulation or phenotypically defined as undifferentiated and highly clonogenic ALDH+/CD49f+/EpCAM+ luminal progenitors, which express both basal cell and luminal cell-enriched genes. We analyzed 420 tumor cells and 284 adjacent normal cells for expression of 93 genes that included a PAM50-intrinsic subtype classifier and stemness-related genes. ALDH+/CD49f+/EpCAM+ tumor and normal cells clustered differently compared with unselected tumor and normal cells. PAM50 gene-set analyses of ALDH+/CD49f+/EpCAM+ populations efficiently identified major and minor clones of tumor cells, with the major clone resembling clinical parameters of the tumor. Similarly, a stemness-associated gene set identified clones with divergent stemness pathway activation within the same tumor. This refined expression profiling technique distinguished genes truly deregulated in cancer from genes that identify cellular precursors of tumors. Collectively, the assays presented here enable more precise identification of cancer-deregulated genes, allow for early identification of therapeutically targetable tumor cell subpopulations, and ultimately provide a refinement of precision therapeutics for cancer treatment. Cancer Res; 77(10); 2759-69. ©2017 AACR.


Conflict of interest statement

Conflict of Interest: Authors declare no potential conflicts of interest

Figures

Figure 1
Figure 1
Single cell analyses scheme and samples analyzed. A) Schematic view of experimental design. B) Tumor and adjacent normal cells are in different differentiation state. Flow cytometry with CD49f and EpCAM stained cells shows different levels of CD49f+/EpCAM+ luminal progenitor and CD49f-/EpCAM+ differentiated cells in tumor and adjacent normal cells of three samples analyzed. Unstained or weakly CD49f stained cells correspond to feeder fibroblasts.
Figure 2
Figure 2
Flow cytometry sorting of cells for single cell analyses. A) Jam-A/EpCAM staining to separate breast epithelial cells from feeder layer fibroblasts. Fibroblasts do not stain for Jam-A/EpCAM. Jam-A/EpCAM positive cells were sorted and used for unselected cell analyses. B) Sorting of ALDH+/CD49f+/EpCAM+ cells to enrich for phenotypically defined cell population. CD49f+/EpCAM+ cells in the boxed regions on right were selected for analyses.
Figure 3
Figure 3
Genes linked to stemness differentiate tumor cells from normal cells. A) Heatmap depicting expression pattern of stemness-associated genes in unselected cells of tumor and adjacent normal of patient 1. A vertical bar on right side denotes genes overexpressed in tumor cells compared to normal cells. Red and green bars at the bottom indicate normal and tumor cells, respectively. B) Heatmap depicting expression pattern of stemness-associated genes in unselected cells of tumor and adjacent normal of patient 2. A vertical bar on the right side denotes genes that are expressed at a lower level in tumor cells compared to normal. C) Stemness cell signaling network uniquely active in tumor cells of patient 1. Network was generated using genes indicated by a vertical bar in A. Genes with shaded boxes in the network are differentially expressed in tumor cells compared to normal cells. D) Signaling network in tumor cells in patient 2. Negative regulators of Wnt signaling pathway such as AXIN1 and APC were expressed at lower levels in tumor cells compared to normal cells.
Figure 4
Figure 4
PAM50 gene set analyses identify cells with luminal-enriched, basal-enriched or hybrid gene expression patterns. A) Heatmap depicting expression pattern of PAM50 genes in unselected cells of tumor and adjacent normal of patient 1. Red and green bars at the bottom indicate normal and tumor cells, respectively. Unlike with stemness-associated gene set analyses, tumor and normal did not separate clearly into two groups. B) Heatmap depicting expression pattern of PAM50 genes in tumor and normal cells of patient 2.
Figure 5
Figure 5
Distinct clustering of ALDH+/CD49f+/EpCAM+ undifferentiated normal and tumor luminal progenitor cells. A) Heatmap depicting expression pattern of stemness-associated genes in phenotypically defined cells of tumor and adjacent normal of patient 1. B) Genes differentially expressed in tumor cells compared to normal cells were part of two signaling networks. C) Heatmap depicting expression patterns of stemness-associated genes in normal and tumor cells of patient 2. Tumors clustered into two distinct groups. D) Signaling network involving β-Catenin-SOX9-SOX17 was active in the major tumor clone. E). Heatmap depicting stemness-associated gene expression in patient 3.
Figure 6
Figure 6
PAM50 gene set analyses of phenotypically defined cells identify multiple tumor clones. A) Tumor cells in patient 1 clustered into three distinct groups, each expressing different levels of luminal and basal genes. B) Expression pattern of PAM50 genes in patient 2. Tumor cells formed two clusters. C) Tumor cells in patient 3 are relatively homogenous with tumor cells clustering into one group expressing mostly luminal genes.
Figure 7
Figure 7
Identifying genes truly differentially expressed in tumors compared to normal. Violin plots show genes truly overexpressed or underexpressed in all tumor cells compared to all normal cells. Width of the violin depicts expression frequency at that level. A) Data from phenotypically defined cells of patient 1. B) Data from unselected cells of patient 1. C) Data from phenotypically defined cells of patient 2. D) Data from unselected cells of patient 2.

References

    1. Paik S, Shak S, Tang G, Kim C, Baker J, Cronin M, et al. A multigene assay to predict recurrence of tamoxifen-treated, node-negative breast cancer. N Engl J Med. 2004;351(27):2817–26. - PubMed
    1. Prat A, Bianchini G, Thomas M, Belousov A, Cheang MC, Koehler A, et al. Research-based PAM50 subtype predictor identifies higher responses and improved survival outcomes in HER2-positive breast cancer in the NOAH study. Clin Cancer Res. 2014;20(2):511–21. - PubMed
    1. van ’t Veer LJ, Dai H, van de Vijver MJ, He YD, Hart AA, Mao M, et al. Gene expression profiling predicts clinical outcome of breast cancer. Nature. 2002;415(6871):530–6. - PubMed
    1. Drukker CA, Elias SG, Nijenhuis MV, Wesseling J, Bartelink H, Elkhuizen P, et al. Gene expression profiling to predict the risk of locoregional recurrence in breast cancer: a pooled analysis. Breast Cancer Res Treat. 2014;148(3):599–613. - PubMed
    1. Cardoso F, van’t Veer LJ, Bogaerts J, Slaets L, Viale G, Delaloge S, et al. 70-Gene Signature as an Aid to Treatment Decisions in Early-Stage Breast Cancer. N Engl J Med. 2016;375(8):717–29. - PubMed

Publication types

Substances