. 2017 May;206(1):345-361.
doi: 10.1534/genetics.116.197145. Epub 2017 Mar 1.

Inference of the Distribution of Selection Coefficients for New Nonsynonymous Mutations Using Large Samples

Affiliations

Inference of the Distribution of Selection Coefficients for New Nonsynonymous Mutations Using Large Samples

Bernard Y Kim et al. Genetics. 2017 May.

Abstract

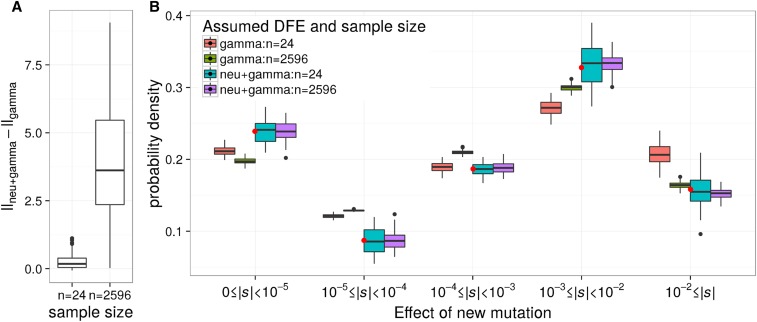
The distribution of fitness effects (DFE) has considerable importance in population genetics. To date, estimates of the DFE come from studies using a small number of individuals. Thus, estimates of the proportion of moderately to strongly deleterious new mutations may be unreliable because such variants are unlikely to be segregating in the data. Additionally, the true functional form of the DFE is unknown, and estimates of the DFE differ significantly between studies. Here we present a flexible and computationally tractable method, called Fit∂a∂i, to estimate the DFE of new mutations using the site frequency spectrum from a large number of individuals. We apply our approach to the frequency spectrum of 1300 Europeans from the Exome Sequencing Project ESP6400 data set, 1298 Danes from the LuCamp data set, and 432 Europeans from the 1000 Genomes Project to estimate the DFE of deleterious nonsynonymous mutations. We infer significantly fewer (0.38-0.84 fold) strongly deleterious mutations with selection coefficient |s| > 0.01 and more (1.24-1.43 fold) weakly deleterious mutations with selection coefficient |s| < 0.001 compared to previous estimates. Furthermore, a DFE that is a mixture distribution of a point mass at neutrality plus a gamma distribution fits better than a gamma distribution in two of the three data sets. Our results suggest that nearly neutral forces play a larger role in human evolution than previously thought.

Keywords: deleterious mutations; diffusion theory; population genetics; site frequency spectrum.


Figures

Figure 1
Figure 1
Previously inferred DFEs differ across studies. We rescaled the DFE in terms of the population size assumed or inferred in each study. A population size of 10,000 diploids is used to rescale the distribution of 2Ns to s for Eyre-Walker et al. (2006). For Boyko et al. (2008) and Li et al. (2010), we rescale the DFE from 2Ns to s using population sizes of 25,636 and 52,097 diploids, respectively (see Materials and Methods).
Figure 2
Figure 2
The discrete DFE can recover the approximate form of the DFE from simulated data. The distributions of the proportions of mutations with different selective effects, as inferred by the discrete DFE for 100 simulated data sets, are shown. Each simulation set assumed the demographic model fit to the LuCamp synonymous SFS. A red point depicts the true proportions of the simulated DFE. The true DFE for each set is: (A) the continuous neutral+gamma distribution of Li et al. (2010) (pneu = 0.2, α = 4, β = 1.065 × 10⁻⁴), (B) the discretized version of that distribution, (C–F) a gamma DFE (α = 0.215, β = 567.1), but where (C and E) the mass of the 10−3 ≤ |s| < 10−2 bin was added to the 10−2 ≤ |s| bin, and (D and F) where the mass of the 10−2 ≤ |s| bin was added to the 10−3 ≤ |s| < 10−2 bin. The data sets simulated for (C) and (D) had sample sizes of n = 2596 chromosomes, while the data sets for (E) and (F) had sample sizes of n = 24 chromosomes.
Figure 3
Figure 3
Inference of the DFE is robust to misspecification of the demographic model and background selection. Points show the MLEs of the (A) demographic parameters and (B) DFE parameters inferred from 100 simulated data sets with linkage and population structure. Red lines denote the true values and the yellow dots denote the median estimates across the 100 data sets. Estimates of time of expansion (T1) and the ratio of current to ancestral population size (N1/NANC) tend to be biased because demography is incorrectly modeled due to background selection, but estimates of the DFE are unbiased.
Figure 4
Figure 4
The distribution of selection coefficients of new mutations under our best-fit DFEs compared to Boyko et al. (2008). Results are presented for the best-fit DFE to each full data set and the best-fit DFE when the data were projected down to n = 24 chromosomes. C.I.’s were estimated by Poisson resampling the nonsynonymous SFS and fitting a DFE 200 times. C.I.’s for the DFE fit to the Boyko et al. (2008) European data set were unavailable. Note that our models predict more nearly neutral mutations (0 ≤ |s| < 10−5) and fewer strongly deleterious mutations (10−2 ≤ |s|) than Boyko et al. (2008), across all mutation rates. Top panel denotes our favored mutation rate while the bottom panel denotes the mutation rate used by Boyko et al. (2008). See Figure S5 in File S1 for a comparison of the population-scaled selection coefficients (2Ns).
Figure 5
Figure 5
Small sample size and misspecification of the DFE can explain some of the differences between previous estimates and our estimates. Gamma and neutral+gamma DFEs were fit to 100 simulated data sets of sample sizes n = 24 and n = 2596 chromosomes, where the true DFE was neutral+gamma distributed (pneu = 0.164, α = 0.338, β = 358.8). (A) The distributions of the difference in log-likelihood between the gamma and neutral+gamma distributions. When the sample size is large (n = 2596) the neutral+gamma distribution has a higher log-likelihood than the gamma distribution. However, the small samples (n = 24) are unable to distinguish between the gamma and neutral+gamma distributions. (B) The estimated proportions of new mutations having different selective effects when fitting the gamma and neutral+gamma distributions. Note that when n = 24, the gamma distribution overpredicts the proportion of strongly deleterious mutations (|s| ≥ 0.01). Red dots denote the true proportion of mutations in each bin. The boxes cover the first and third quartiles, and the band represents the median. The whiskers cover the highest and lowest datum within 1.5 times the interquartile range from the first and third quartiles. Lastly, any data outside that region are plotted as outlier points.

Similar articles

Cited by

References

    1. Aberer A. J., Stamatakis A., 2013. Rapid forward-in-time simulation at the chromosome and genome level. BMC Bioinformatics 14: 216. - PMC - PubMed
    1. Acevedo A., Brodsky L., Andino R., 2014. Mutational and fitness landscapes of an RNA virus revealed through population sequencing. Nature 505: 686–690. - PMC - PubMed
    1. Bank C., Hietpas R. T., Wong A., Bolon D. N., Jensen J. D., 2014. A Bayesian MCMC approach to assess the complete distribution of fitness effects of new mutations: uncovering the potential for adaptive walks in challenging environments. Genetics 196: 841–852. - PMC - PubMed
    1. Bataillon T., Bailey S. F., 2014. Effects of new mutations on fitness: insights from models and data. Ann. N. Y. Acad. Sci. 1320: 76–92. - PMC - PubMed
    1. Boucher J. I., Cote P., Flynn J., Jiang L., Laban A., et al. , 2014. Viewing protein fitness landscapes through a next-gen lens. Genetics 198: 461–471. - PMC - PubMed