. 2017 Apr;24(4):395-406.
doi: 10.1038/nsmb.3383. Epub 2017 Feb 27.

Broad TCR repertoire and diverse structural solutions for recognition of an immunodominant CD8+ T cell epitope

Affiliations

Broad TCR repertoire and diverse structural solutions for recognition of an immunodominant CD8+ T cell epitope

InYoung Song et al. Nat Struct Mol Biol. 2017 Apr.

Abstract

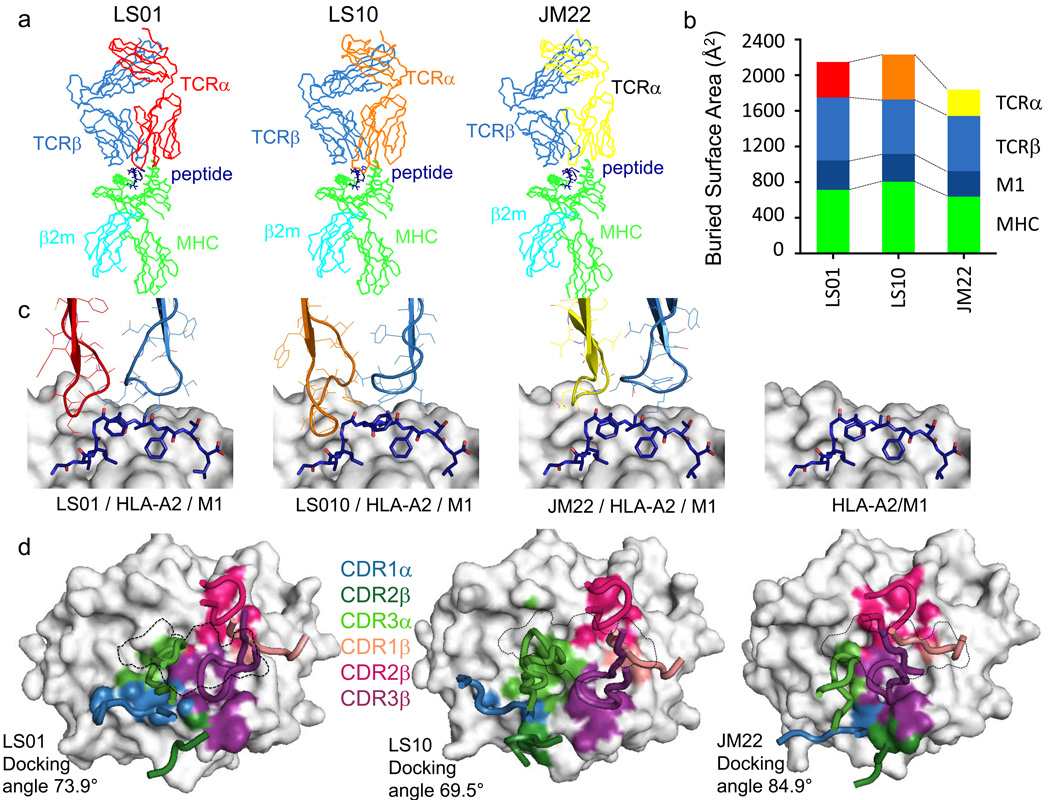
A keystone of antiviral immunity is CD8+ T cell recognition of viral peptides bound to MHC-I proteins. The recognition modes of individual T cell receptors (TCRs) have been studied in some detail, but the role of TCR variation in providing a robust response to viral antigens is unclear. The influenza M1 epitope is an immunodominant target of CD8+ T cells that help to control influenza in HLA-A2+ individuals. Here we show that CD8+ T cells use many distinct TCRs to recognize HLA-A2-M1, which enables the use of different structural solutions to the problem of specifically recognizing a relatively featureless peptide antigen. The vast majority of responding TCRs target a small cleft between HLA-A2 and the bound M1 peptide. These broad repertoires lead to plasticity in antigen recognition and protection against T cell clonal loss and viral escape.


Figures

Figure 1
Figure 1. Diversity of CD8 T cell repertoire, dominant usage of TRAV38, and CDR3α and CDR3β sequence motifs in the HLA-A2/M1-specific response
(a) Schematic diagram. CD8 T cells isolated from donor PBMC were expanded using M1-pulsed HLA-A2+ presenting cells, and cDNA of M1-dextramer positive CD8 T cells sorted by FACS was analyzed by NGS. (b,c) HLA-A2/M1-specific TCR repertoires were analyzed for 6 healthy donors (185, 215, 240, 264, D085, D105). Frequency of each TRAV (b) and TRBV (c) in total HLA-A2/M1- specific TCR repertoire is shown in pie charts. Number of unique sequences found for each donor is shown with total number of sequences in parentheses. (d) Frequency of two most common TRAV genes in M1-specific TCRα repertoire. (e) Frequency of TRAJ gene usage among TRAV38-containing TCRαin the 6 donors. TRAJ52 is used almost exclusively. (f) Average frequency of TRAV38-containing TCRs for various CDR3α lengths. (g) Average frequencies of different CDR3α lengths within the overall CD8 T cell population recognizing HLA-A2/M1 are shown in bar graph at the left. TRAV gene usage for TCR with 15-mer CDR3α is shown for each donor in pie charts. Major TRAV genes (Vα) from each donor are labeled below charts. Numbers in pie charts represent percentage of TRAV38 in total M1-specific TCRs with 15-mer CDR3α. Amino acid compositions of 15-mer CDR3α in TRAV38-containing TCR from six donors were analyzed and depicted as sequence logo above pie charts. Solid lines above logo indicate germline-encoded sequences. Dotted lines show partially conserved sequence. (h) Average frequencies of different CDR3β lengths within the overall CD8 T cell population recognizing HLA-A2/M1 are shown in bar graph at the left, with TRBV gene usage and sequence logos for TCR with 10-mer and 11-mer CDR3β. The number in parentheses represents the individual’s frequency of either 10-mer or 11-mer clonotypes. In panels (b–h), TRAV and TRBV genes are abbreviated as Vα and Vβ. In panel (f–h) the error bars represent standard deviation of the mean for six donors.
Figure 2
Figure 2. TCRαβ pairs bind HLA-A2/M1 and stimulate T cell signaling
(a) TCRα/β deficient Jurkat cells (J76-CD8) transiently expressing each of 13 paired full-length TCRα/TCRβ (LS01 – LS13) stained with M1-HLA-A2 dextramer or negative control BRLF1-HLA-A2 dextramer show specific binding by cloned TCRαβ. TCR surface expression levels for these transfectants are shown in Supplementary Fig. 4a, and T cell activation levels induced by peptide-pulsed HLA-A2+ presenting cells are shown in Supplementary Figure 4b. (b) Representative TCRs (Group I: JM22, Group II: LS10, Group III: LS01) show dose-dependent HLA-A2/M1 tetramer binding. J76-CD8 stably expressing LS01, LS10 or JM22 were stained with increasing concentrations of M1-tetramer. Plot of geometric mean of fluorescent intensities of bound HLA-A2/M1 tetramer subtracted from empty vector controls against increasing M1-tet concentration is shown, with half maximal binding concentrations (Kdapp) indicated. Error bars represent range of two independent duplicate experiments. TCR surface expression levels are shown in Supplementary Fig. 4d, and FACS plots in Supplementary Fig 4c. (c) LS01 and LS10 recognized M1-peptide as efficiently as canonical TCRs (JM22 and LS06). J76-CD8 cells expressing TCRs were stimulated by T2 cells loaded with increasing M1 peptide, and surface expression of the activation marker CD69 was measured. Half-maximal stimulating concentrations (EC50) are shown. Error bars represent mean of triplicate measurements. d) Soluble LS01 and LS10 TCR proteins bind to immobilized HLA-A2/M1. Increasing concentrations of soluble LS01 and LS10 proteins were flowed over immobilized HLA-A2/M1 in surface plasmon resonance experiments. Increased response units relative to control channel (dRU) are plotted against soluble TCR concentration. Equilibrium binding constants (Kd) from fit to a single-site binding equation are shown with standard deviation of three independent experiments. Measured Kd for LS06 was 2.1±0.2 µM.
Figure 3
Figure 3. Structural Comparison of three TCRs docking onto HLA-A2/M1
(a) Ribbon diagrams of three TCR binding to HLA-A2/M1. The common TRBV19 TCRβ chain (blue) paired with different TCRα chains (red, orange, yellow) and bound to M1 peptide (dark blue) presented by HLA-A2 heavy chain (green) and beta-2 globulin (β2m) (b) BSAs at the interface between TCRs and HLA-A2/M1 are plotted with contribution of TCR α and β chains, peptide, and MHC colored as in panel a. Total buried surface area was 2137, 2231 and 1838 Å2 respectively for LS01, LS10, and JM22 (c) CDR3α and CDR3β loops orient over the M1 peptide with different interactions. Unliganded HLA-A2/M1 (PDB 2VLL) is shown in the far right. (d) Surface representations of HLA-A2 are shown with footprints of TCRs colored by CDR loop. Locations of M1 peptide is outlined with dotted lines.
Figure 4
Figure 4. LS10 TCR uses conserved 15-mer CDR3α and ‘xGxY’ CDR3β motifs to select a M1 peptide conformation with Phe5 -p occupying the notch between peptide and MHC
(a) Top and side views of HLA-A2/M1 structures before (red) after (blue) LS10 ligation show that M1 undergoes significant movement upon TCR engagement (dotted line: HLA-A2 surface). (b) Tyr103α and Ala98α of CDR3α make close contacts with Phe5-p of M1 in the new conformation. (c–e) Rearrangement of M1 peptide upon LS10 interaction. Top views of HLAA2/ M1 are shown with MHC in grey and peptide colored before (c) and after (d–e) LS10-ligation. Notches between MHC and peptide (dashed circles) are filled with displaced Phe7-p (d) and CDR3α residues. (e) Close packing among Tyr103α (CDR3α), Gly98β (CDR3β) and Phe5-p (M1) is shown. (f) Similar view as (e) but after JM22 binding. (g) CDR3β (red) and CDR3α (green) loops of LS10 are shown near α2-helix (white) and M1-peptide (blue). Hydrogen bonds shown as dotted lines. (h) CDR3α of ligated LS10 adopts a structured configuration with two β-hairpins (dashed lines). Trp94α and Thr107α make two hydrogen bonds (dotted lines). Non-conserved residues (xxx in CAΦxxxAGGTSYGKLTF) are labeled red. (i) Trp94α (blue) of CDR3α is surrounded by TRAV38-specific residues (light green) and CDR3α (grey).
Figure 5
Figure 5. LS01 TCR uses CDR3β Phe98 to occupy the notch between peptide and MHC with additional interactions from CDR1α, CDR3α, and CDR3β
(a) CDR3β sequence comparison of LS01 and JM22. LS01 has Phe98β instead of conserved Arg98β Frequencies of M1-specific TCRs with Phe and Tyr in total M1-specific TCRs with 11mer CDR3β. (b) Substitution of Arg98β of xRSx motif abolishes HLA-A2/M1 tetramer binding. Relative MFI of HLA-A2/M1 tetramer bound to JM22 variants is shown. (c) CDR3β of LS01 (purple) with nearby portions of M1 (blue) and MHC α2-helix (grey). Water molecules are shown in green with hydrogen bonds indicated by dashed lines. (d) CDR1α (blue) and CDR3α (green) interactions in the LS01/HLA-A2/M1 interface. Tyr31α of CDR1α is inserted between CDR3α and MHCα2 helix interacting with Asn95α, Thr94α, Glu93α, Ala158MHC, and Tyr159MHC mainly via van der Waals interaction. (e) Tyr31α and Asn95α are involved in a network of hydrogen bonds with HLA-A2/M1. Error bars in (b) represent range of two independent duplicate samples.
Figure 6
Figure 6. Different structural solutions to high-avidity binding of a featureless peptide
(a) Identical CDR1β and CDR2β sequences from three TRBV19-containing TCR make different interaction with HLA-A2/M1. (b) Top views of three HLA-A2/M1/TCR complexes show overall similarity and fine specificity of M1 recognition. TCR-ligated M1 peptide residues (yellow), Ile53β of CDR2β (pink), critical residues from CDR3α or CDR3β (red), and Gln155MHC of MHC (green) are displayed as surface/stick representations. (c) Sectional views of the three TCR in the pocket region. Sectional lines are shown by dashes in panel (b). (d) Percentage of TRBV19 TCR for each donor with motif from group I, II, or III. Numbers above bars indicate total for three groups. (g) Frequency of group I, II, and III TCRs plotted against numbers of TCR residues making side chain contacts with peptide-MHC in corresponding crystal structure. Box and whisker plot represent mean, quartile and range of frequencies for five donors and R is Pearson correlation coefficient.

References

    1. La Gruta NL, Turner SJ. T cell mediated immunity to influenza: mechanisms of viral control. Trends Immunol. 2014;35:396–402. - PubMed
    1. Guo H, Lambert K, Takimoto T, Topham DJ. T Cell-Mediated Protection against Lethal 2009 Pandemic H1N1 Influenza Virus Infection in a Mouse Model. J. Virol. 2011;85:448–455. - PMC - PubMed
    1. Tan ACL, et al. The design and proof of concept for a CD8+ T cell-based vaccine inducing cross-subtype protection against influenza A virus. Immunol. Cell Biol. 2013;91:96–104. - PubMed
    1. Gotch F, McMichael A, Smith G, Moss B. Identification of viral molecules recognized by influenza-specific human cytotoxic T lymphocytes. J. Exp. Med. 1987;165:408–416. - PMC - PubMed
    1. Gotch F, Rothbard J, Howland K, Townsend A, McMichael A. Cytotoxic T lymphocytes recognize a fragment of influenza virus matrix protein in association with HLA-A2. Nature. 1987;326:881–882. - PubMed

Publication types

MeSH terms