. 2017 Apr;19(4):391-398.
doi: 10.1038/ncb3481. Epub 2017 Feb 27.

Tubulin acetylation protects long-lived microtubules against mechanical ageing

Affiliations

Tubulin acetylation protects long-lived microtubules against mechanical ageing

Didier Portran et al. Nat Cell Biol. 2017 Apr.

Abstract

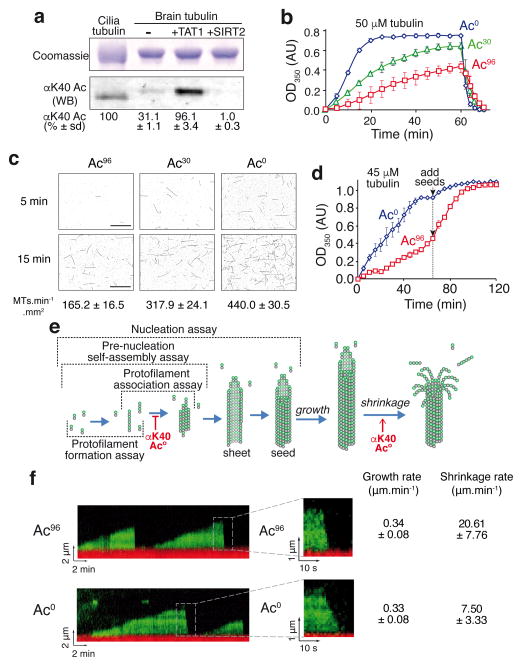
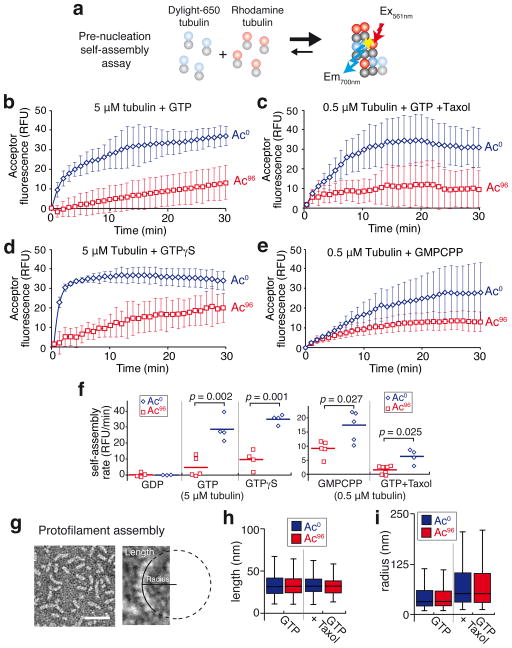
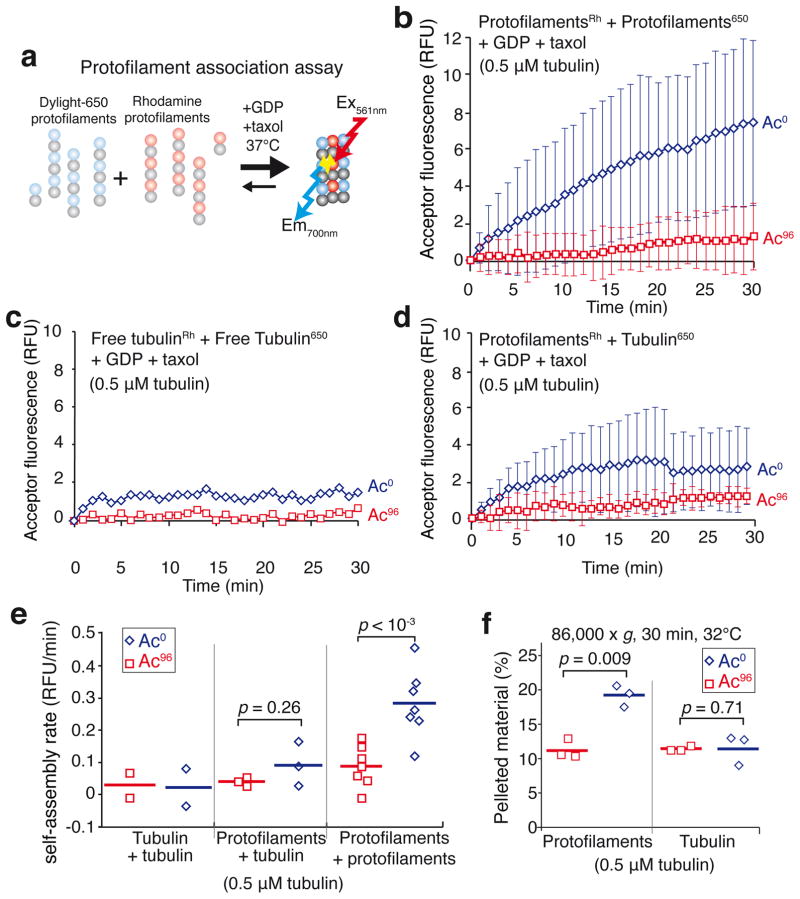
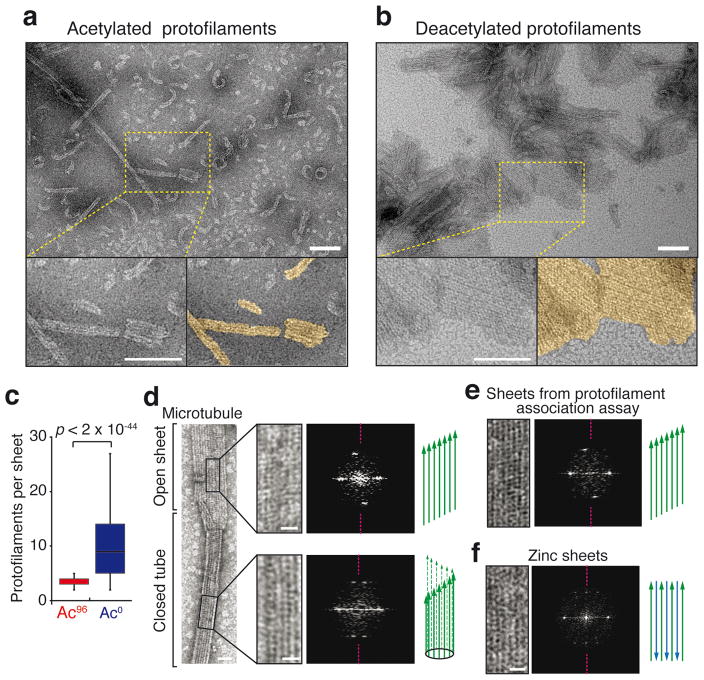
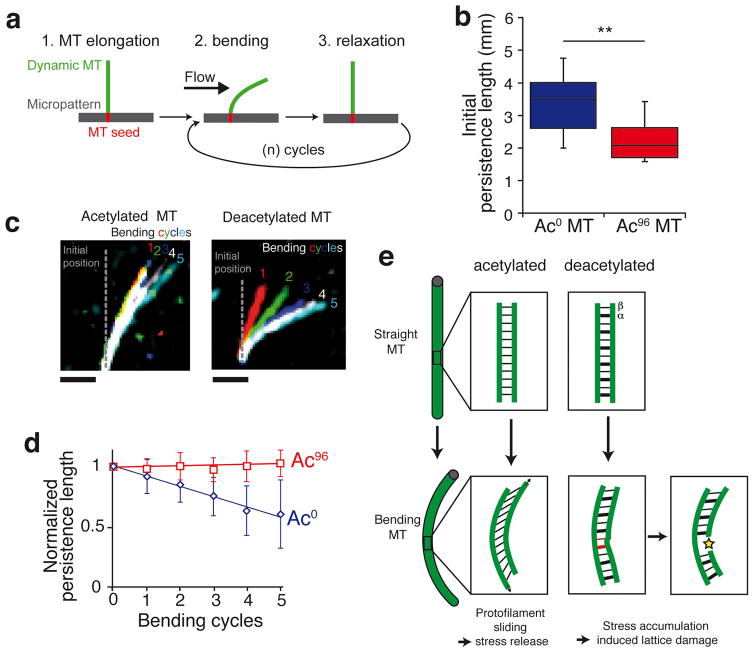
Long-lived microtubules endow the eukaryotic cell with long-range transport abilities. While long-lived microtubules are acetylated on Lys40 of α-tubulin (αK40), acetylation takes place after stabilization and does not protect against depolymerization. Instead, αK40 acetylation has been proposed to mechanically stabilize microtubules. Yet how modification of αK40, a residue exposed to the microtubule lumen and inaccessible to microtubule-associated proteins and motors, could affect microtubule mechanics remains an open question. Here we develop FRET-based assays that report on the lateral interactions between protofilaments and find that αK40 acetylation directly weakens inter-protofilament interactions. Congruently, αK40 acetylation affects two processes largely governed by inter-protofilament interactions, reducing the nucleation frequency and accelerating the shrinkage rate. Most relevant to the biological function of acetylation, microfluidics manipulations demonstrate that αK40 acetylation enhances flexibility and confers resilience against repeated mechanical stresses. Thus, unlike deacetylated microtubules that accumulate damage when subjected to repeated stresses, long-lived microtubules are protected from mechanical ageing through their acquisition of αK40 acetylation. In contrast to other tubulin post-translational modifications that act through microtubule-associated proteins, motors and severing enzymes, intraluminal acetylation directly tunes the compliance and resilience of microtubules.


Conflict of interest statement

The authors declare no competing financial interests.

Figures

Figure 1
Figure 1. αK40 acetylation impairs microtubule nucleation and accelerates depolymerization
a, Acetylated (Ac96) and deacetylated (Ac0) tubulin preparations were produced by treating purified brain tubulin (Ac) with the acetyltransferase TAT1 or the tubulin deacetylatase SIRT2 as detailed in Supplementary Fig. 1a. Samples were resolved on SDS-PAGE and Coomassie-stained (top) or immunoblotted for αK40 acetylation (bottom). Axonemal preparations from Tetrahymena cilia provide a 100% acetylation calibrator. The measured levels of αK40 acetylation are shown below (mean of n=3 tubulin preparations ± SD). Unprocessed original scans of blots are shown in Supplementary Fig. 1c. b, Polymer formation was monitored by following the turbidity, or absorbance at 350 nm, of solutions containing 50 μM tubulin incubated at 37°C. Error bars represent the standard errors of the mean (SEM), n=3 independent experiments for Ac0, Ac and Ac96 tubulin. c, Fluorescence images of microtubules nucleated from 10 μM tubulin solutions incubated at 37°C and fixed at 5 and 15 min (images are representative of 3 independent experiments). The mean rate of microtubule nucleation (± SEM) from n=3 independent experiments is shown below each image. Scale bar: 10 μm. d, Polymer formation was monitored as in b, except that starting tubulin concentration was 45 μM and that 5 μM GMPCPP-stabilized microtubule seeds were added after 70 min. Error bars: SEM, n=3 independent experiments. e, Diagram outlining microtubule nucleation and dynamics. The various assays used in this study are outlined and the effects of tubulin acetylation discovered in this study are shown. f, Kymographs of dynamic Ac96 and Ac0 microtubules imaged by TIRF microscopy (representative of 3 independent experiments). In red are the GMPCPP stabilized microtubule seeds and in green the dynamic microtubules elongating from the seed. Insets show depolymerizing microtubules at higher magnification. The rates of growth and shrinkage are shown on the right, n = 117 Ac96 microtubules and n = 156 Ac0 microtubules (pooled from n= 3 independent experiments, data are mean ± SD). Source data for 1b and 1d can be found in Supplementary Table 1.
Figure 2
Figure 2. Tubulin acetylation affects tubulin self-assembly
a, Diagram of the FRET-based pre-nucleation self-assembly assay. b–e, Tubulin self-assembly assayed by inter-dimer FRET. A solution of free tubulin below the critical concentration for nucleation in which 10% bears a DyLight 650 label and 10% a rhodamine-label was incubated at 37°C and self-assembly was followed in a spectrofluorimeter by exciting rhodamine at 561 nm and measuring DyLight 650 emission at 700 nm. Data points are mean ± SEM, b, 5 μM tubulin was mixed with 1 mM GTP. n=5 for Ac96 and n=4 for Ac0 tubulin. c, 0.5 μM tubulin was mixed with 1 mM GTP + 0.5 μM taxol. n=7 for Ac96 and n=4 for Ac0 tubulin. d, 5 μM tubulin was mixed with 1 mM GTPγS. n=4 for both Ac96 and Ac0 tubulin. e, 0.5 μM tubulin was mixed with 0.5 mM GMPCPP. n=5 for both Ac96 and Ac0 tubulin. n values represent the number of independent experiments. f, Dot plot of the pre-nucleation self-assembly rates for Ac96 and Ac0 tubulin. The experiment was done using 5 μM of free tubulin with 1 mM GDP, 1 mM GTP or 1 mM GTPγS, or 0.5 μM of free tubulin with 1 mM GTP + 0.5 μM taxol or 0.5 mM GMPCPP. The bar denotes the mean. The p-values were calculated using a two-tailed unpaired Student’s t-test. g, Taxol-stabilized protofilaments observed by negative stain electron microscopy. The length of each protofilament was measured and a circle was fitted onto the protofilament to measure the radius (images representative of 2 independent experiments). h,i, Box plots of the length (h) and radius (i) of the Ac0 (blue boxes) and Ac96 (red boxes) protofilaments assembled in the presence of GTP or GTP+taxol. For the GTP condition: n=612 Ac0 protofilaments and n=513 Ac96 protofilaments, for the GTP+taxol condition: n=542 Ac0 protofilaments and n=536 Ac96 protofilaments (pooled from 2 independent experiments). A Mann-Whitney test was used to compare Ac0 and Ac96 protofilaments populations in each condition. No significant differences were observed between Ac0 and Ac96 protofilaments in length (p=0.74 for GTP and p=0.07 for GTP+taxol) or radius (p=0.64 for GTP and p=0.94 for GTP+taxol). The box represents the 25th-75th percentile, whiskers indicate 1.5 times the range and the bar in the middle is the median.
Figure 3
Figure 3. αK40 acetylation weakens inter-protofilament interactions
a, Diagram of the FRET-based protofilament association assay. Two populations of taxol-stabilized protofilaments were mixed together in the presence of taxol and GDP at 37°C and self-association was followed by monitoring the fluorescence transferred between protofilaments. b–d, Self-assembly was assayed in the presence of 1 mM GDP and 0.5 μM taxol at 32°C. FRET was followed in a spectrofluorimeter by exciting rhodamine at 561 nm and measuring DyLight 650 emission at 700 nm. (b) Rhodamine-labeled protofilaments were mixed with DyLight 650-labeled protofilaments (each made with a molar ratio of 90% unlabeled tubulin to 10% labeled tubulin). Data points are mean ± SEM. n = 7 independent experiments for both Ac96 and Ac0 tubulin. (c) Rhodamine- and DyLight 650-labeled tubulin stocks were mixed with unlabeled tubulin so that 10% of the tubulin was rhodamine-labeled and 10% DyLight 650-labeled. Data points are mean of n = 2 experiments for both Ac96 and Ac0 tubulin. (d) Protofilaments (molar ratio of 90% unlabeled tubulin to 10% rhodamine-labeled tubulin) were mixed with free tubulin (molar ratio of 95% unlabeled tubulin to 5% DyLight 650-labeled tubulin) to mimic the free tubulin left in solution after protofilament assembly. Data points are mean ± SEM. n = 3 independent experiments for both Ac96 and Ac0 tubulin. e, Dot plot of the self-assembly rates for free tubulin, free tubulin with protofilaments or protofilaments incubated in the presence of 1 mM GDP and 0.5 μM taxol at 32°C. The bar denotes the mean. Total tubulin concentration was 0.5 μM. The p-values of the two-tailed unpaired Student’s t-tests are indicated. f, Dot plot of the amount of tubulin pelleted at 86,000 x gave for 30 min at 32°C as a result of the association amongst Ac0 or Ac96 protofilaments (n=3 independent experiments). The bar denotes the mean. The p-values of the two-tailed unpaired Student’s t-tests are indicated. Source data for 3c and 3d can be found in Supplementary Table 1.
Figure 4
Figure 4. The protofilament interaction assay produces parallel sheets
a,b, EM micrographs of the protofilaments interaction assays (images are representative of 2 independent experiments). Protofilaments were incubated at 32°C for 30 min with 0.5 μM taxol and 1 mM GDP, and imaged by negative-stain EM. The few sheets observed with Ac96 protofilaments contained only 2 to 5 protofilaments (a), while extended sheets are seen with Ac0 protofilaments (b). Scale bar = 100 nm. Protofilaments sheets are highlighted in gold color in the magnified bottom right panel of (a) and (b). Scale bar: 100 nm. c, Box plots of the width of sheets (expressed in contiguous protofilament numbers) formed by the association of Ac0 or Ac96 protofilaments. n = 361 Ac96 protofilaments and n = 382 Ac0 protofilaments (pooled from 2 independent experiments). The box represents the 25th–75th percentile, whiskers indicate 1.5 times the range, bar in the middle is the median d–f, Negative stain EM images and associated diffraction patterns; magenta dashed lines indicate the meridian of the diffraction pattern. d, The closed microtubule lattice and its diffraction pattern is shown in the bottom right panels while the open sheet and its diffraction patterns is shown on the top right panels. e, Protofilament sheet and its diffraction patterns from the protofilament self-assembly assay. f, Antiparallel protofilament sheet assembled in presence of zinc. Scale bars: 25 nm (full size images), 10 nm (magnified insets). Diagrams illustrate the known and deducted protofilaments organization. The experiments presented in d and f were performed once, and the experiment in e twice.
Figure 5
Figure 5. Acetylation at αK40 protects microtubules against stress-induced material fatigue
a, Diagram representing the experimental setup used to measure microtubule flexibility and material fatigue. Microtubules were elongated from GMPCPP seeds grafted onto micropatterns, bent using a perpendicular flow for 10 s and then allowed to relax for 10 s. The microtubules are kept dynamic during the experiment by maintaining tubulin concentration at 14 μM in the flowing solution. b, Microtubule persistence lengths measured during the first bending cycle. ** denotes a p-value of the two-tailed unpaired Student’s t-test<0.01, n = 11 Ac96 microtubules and n = 17 Ac0 microtubules. The box represents the 25th–75th percentile, whiskers indicate 1.5 times the range, bar in the middle is the median. c, Pseudocolor images of a single representative microtubule at the end of each bending cycle. Scale bar = 5μm. d, Plot showing the evolution of persistence length over successive bending cycles. Microtubule persistence lengths were normalized to their initial values (the non-normalized data are shown in Supplementary Figure 5c and d). Data points are mean ± SD, n = 11 Ac96 microtubules and n= 17 Ac0 microtubules. e, Model accounting for the increased flexibility and mechanical stability of acetylated microtubules due to decreased inter-protofilament interactions.

References

    1. Janke C, Bulinski JC. Post-translational regulation of the microtubule cytoskeleton: mechanisms and functions. Nat Rev Mol Cell Biol. 2011;12:773–786. - PubMed
    1. Palazzo A, Ackerman B, Gundersen GG. Cell biology: Tubulin acetylation and cell motility. Nature. 2003;421:230. - PubMed
    1. Garnham CP, Roll-Mecak A. The chemical complexity of cellular microtubules: tubulin post-translational modification enzymes and their roles in tuning microtubule functions. Cytoskeleton. 2012;69:442–463. - PMC - PubMed
    1. Soppina V, Herbstman JF, Skiniotis G, Verhey KJ. Luminal localization of α-tubulin K40 acetylation by cryo-EM analysis of fab-labeled microtubules. PLoS ONE. 2012;7:e48204. - PMC - PubMed
    1. Gittes F, Mickey B, Nettleton J, Howard J. Flexural rigidity of microtubules and actin filaments measured from thermal fluctuations in shape. J Cell Biol. 1993;120:923–934. - PMC - PubMed

Publication types