. 2017 Jun;16(6):681-689.
doi: 10.1038/nmat4874. Epub 2017 Mar 6.

A fully organic retinal prosthesis restores vision in a rat model of degenerative blindness

Affiliations

A fully organic retinal prosthesis restores vision in a rat model of degenerative blindness

José Fernando Maya-Vetencourt et al. Nat Mater. 2017 Jun.

Abstract

The degeneration of photoreceptors in the retina is one of the major causes of adult blindness in humans. Unfortunately, no effective clinical treatments exist for the majority of retinal degenerative disorders. Here we report on the fabrication and functional validation of a fully organic prosthesis for long-term in vivo subretinal implantation in the eye of Royal College of Surgeons rats, a widely recognized model of retinitis pigmentosa. Electrophysiological and behavioural analyses reveal a prosthesis-dependent recovery of light sensitivity and visual acuity that persists up to 6-10 months after surgery. The rescue of the visual function is accompanied by an increase in the basal metabolic activity of the primary visual cortex, as demonstrated by positron emission tomography imaging. Our results highlight the possibility of developing a new generation of fully organic, highly biocompatible and functionally autonomous photovoltaic prostheses for subretinal implants to treat degenerative blindness.


Conflict of interest statement

Competing financial interests

The authors declare no competing financial interests.

Figures
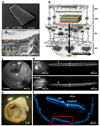
Figure 1
Figure 1. The organic prosthesis and the subretinal implant.
(a) Scanning electron microscopy images of the full prosthetic device (top) and of its cross-section at higher magnification showing the three-layered structure (bottom). (b) Scheme of the subretinal implant strategy. (c) Sample cSLO image of the surgical prosthesis placement in the eye fundus of a dystrophic RCS rat. (d) OCT analysis showing the strict contact between the retina (arrows) and the implant (arrowheads) at 30 and 180 DPI. No retinal detachments or breakages were observed. (e, f) Explanted eye fixed (e), stained with bisbenzimide and acquired by confocal microscopy (f) to identify retinal nuclear layers and the position of the device. The high magnification image (red box) shows the integrity and location of the implant in the retina.
Figure 2
Figure 2. Pupillary reflex and topographic specificity of the prosthesis signal at the cortical level.
(a) Constriction of the pupil by light pulses as assessed using standard infrared imaging in implanted RCS rats at 30 DPI. (b) Quantification of the PLR as a function of light intensity, showing the prosthesis-induced recovery of light sensitivity in RCS rats at 30 DPI at intensities > 2 lux. *p<0.05 vs RCS; +p<0.05 vs RCS+Implant; two-way ANOVA for repeated measures, Tukey's multiple comparison test (RCS-rdy controls, n=6; non-implanted RCS rats, n=11; implanted RCS rats, n=15). (c) Sketch of the temporal projections of the retina to the ipsilateral (light green) and contralateral (light red) areas of the binocular cortex and of the position of the unilateral implant in the RCS rat. (d) The significant increase of the ipsilateral (binocular) cortical responses to visual stimuli highlights the spatial correlation between the implant location in the retina and the response in the corresponding cortical projection areas. I, C: ipsilateral and contralateral, respectively, for both binocular and monocular areas of the visual cortex. Cortical response amplitudes (means ± sem) were: ipsilateral binocular, 144.4 ± 7.3 μV; contralateral binocular, 54.4 ± 3.5 μV; ipsilateral monocular, 51.4 ± 3.0 μV; contralateral monocular, 51.7 ± 1.3 μV (n=4). One-way ANOVA/post-hoc Tukey's multiple comparison test, *p<0.0001.
Figure 3
Figure 3. Electrophysiological assessment of cortical visual responses in response to flash and patterned illumination.
(a-c) VEP recordings in V1 (a) in response to flash stimuli (20 cd m-2; 100 ms) show the rescue of light sensitivity in implanted RCS rats at both 30 DPI (b) and 180 DPI (c). The mean (±sem) amplitudes of the V1 response at 30 DPI were: RCS-rdy, 253.4 ± 12.3 μV (n=8); RCS, 102.8 ± 7.5 μV (n=8); RCS+Implant, 167.0 ± 21.1 μV (n=7); RCS+Substrate, 107.2 ± 8.2 μV (n=7). The mean (±sem) amplitudes of the V1 response at 180 DPI were: RCS-rdy, 23.0 ± 1.05 μV (n=8); RCS, 9.54 ± 1.05 μV (n=8); RCS+Implant, 16.38 ± 1.02 μV (n=8); RCS+Substrate, 11.38 ± 0.73 μV (n=8). (d, e) The electrophysiological analysis of VEP recordings in response to horizontal sinusoidal gratings of increasing spatial frequencies (0.1 to 1 cycle/ degree of visual angle) administered at 0.5 Hz reveals a significant recovery of visual acuity at both 30 DPI (d) and 180 DPI (e). The mean (±sem) spatial acuity values at 30 DPI were: RCS-rdy, 0.76 ± 0.02 cycles/degree (n=10); RCS, 0.32 ± 0.01 cycles/degree (n=10); RCS+Implant, 0.62 ± 0.03 cycles/degree (n=10); RCS+Substrate, 0.34 ± 0.02 cycles/degree (n=7). The mean (±sem) spatial acuity values at 180 DPI were: RCS-rdy, 0.73 ± 0.02 cycles/degree (n=8); RCS, 0.2 ± 0.02 cycles/degree (n=9); RCS+Implant, 0.38 ± 0.02 cycles/degree (n=12); RCS+Substrate, 0.19 ± 0.02 cycles/degree (n=8). One-way ANOVA/post-hoc Tukey's multiple comparison test: * 0.0001<p<0.01 (b); * 0.0001<p<0.05 (c); * p<0.0001 (d,e).
Figure 4
Figure 4. Behavioral evaluation of visual functions.
(a-c) The light-dark box test (a) revealed the reinstatement of light sensitivity in implanted RCS rats evaluated as escape latency from the lit compartment at both 30 DPI (b) and 180 DPI (c). Mean (±sem) latencies at 30 DPI were: RCS-rdy, 17.74 ± 2.30 s (n=46); RCS, 29.46 ± 2.49 s (n=41); RCS+Implant, 18.41 ± 2.03 s (n=44); RCS+Substrate, 30.07 ± 3.29 s (n=28). Mean (±sem) latencies at 180 DPI were: RCS-rdy, 15.86 ± 2.04 s (n=28); RCS, 24.50 ± 1.57 s (n=38); RCS+Implant, 15.71 ± 1.86 s (n=21); RCS+Substrate, 27.84 ± 2.23 s (n=19). (d,e) Implanted animals also showed a significant increase in the time spent in the dark compartment at both 30 DPI (d) and 180 DPI (e). Mean (±sem) percentages of time spent in the dark at 30 DPI: RCS-rdy, 52.69 ± 2.56 % (n=46); RCS, 40.37 ± 1.76 % (n=41); RCS+Implant, 50.90 ± 2.16 % (n=44); RCS+Substrate, 40.82 ± 2.79 % (n=28). Mean (±sem) percentages of time spent in the dark at 180 DPI: RCS-rdy, 58.35 ± 4.14 s (n=28); RCS, 39.34 ± 1.62 s (n=38); RCS+Implant, 50.21 ± 4.98 s (n=21); RCS+Substrate, 34.93 ± 2.85 s (n=19). One-way ANOVA/post-hoc Tukey's multiple comparison test: * 0.01<p<0.05 (b); * 0.001<p<0.01 (c); * 0.001<p<0.05 (d,e).
Figure 5
Figure 5. Basal metabolic activity in V1.
(a, b) Representative images of basal metabolic activity acquired in all experimental groups at both 30 (a) and 180 DPI (b). The color-scale map corresponding to the average SUV of 18F-FDG uptake over the scanned area is shown on the left. Inset black boxes show the location of the analyzed average VOI in V1 (~1 mm3). (c, d) The quantitative analysis of the average SUV at 30 DPI (c) and 180 DPI (d), demonstrates a significant and persistent prosthesis-dependent increase in V1 basal metabolic activity. Mean (±sem) SUV values at 30 DPI were: RCS-rdy, 3.05 ± 0.156 (n=7); RCS, 1.66 ± 0.157 (n=13); RCS+Implant, 2.17 ± 0.125 (n=16); RCS+Substrate, 1.81 ± 0.130 (n=8). Mean (±sem) SUV values at 180 DPI were: RCS-rdy, 1.792 ± 0.127 (n=7); RCS, 1.381 ± 0.053 (n=11); RCS+Implant, 1.624 ± 0.046 (n=14); RCS+Substrate, 1.330 ± 0.07 (n=8). One-way ANOVA/post-hoc Tukey's multiple comparison test: * 0.0001<p<0.05 (c); * 0.01<p<0.05 (d).
Figure 6
Figure 6. Characterization of the prosthesis after long-term implantation.
(a) Optical image of a dissected retina with the prosthesis and its polymeric layer still in contact with the tissue. (b) Fluorescence image (excitation: 540 nm; emission: 605 nm) of the same prosthesis after removal of the tissue showing the preserved photoluminescence of the P3HT layer after in vivo implantation. (c, d) SEM image section view of a fixed retina where the prosthesis embedded in the tissue is clearly intact after 6 months of implantation; the magnified view of the area highlighted in yellow further confirms the complete confinement of the prosthesis in the subretinal space of the eye. (e, f) Representative, top-view SEM images of the sham, silk-only (left) and full polymer (right) devices explanted from the rat retina 6 months after implantation and freed from the retinal tissues. The smooth surface of the full device testifies the persistence of the polymeric layer. (g) Raman spectra of prosthetic implants, extracted from the subretinal space of RCS rats 6 months after implantation. The resonances in the range 1350-1500 cm-1 (highlighted in the inset) demonstrate the presence and the preserved conjugation of the P3HT polymeric chains (red trace). The PEDOT:PSS signature in rare P3HT-free areas of the same device is also shown (green trace), confirming the absence of irreversible chemical degradation after implantation. (h) Comparison between representative normalized surface potentials generated by implanted (red trace) and not implanted (black trace) devices upon green light stimulation (530 nm, 200 mW/mm2, 100 ms). Not implanted devices were sterilized and aged for the same amount of time at room temperature in the dark. The fast light-evoked capacitive peak at the light onset (t=0 ms) is preserved 10 months after implantation. The not-implanted device was kept in the dark at room temperature for the same period of time. Inset: schematics of the experimental set-up used to record the surface potential with a micropipette electrode micromanipulated in the very close proximity of the P3HT/electrolyte interface.

References

    1. Wright AF, Chakarova CF, Abd El-Aziz MM, Bhattacharya SS. Photoreceptor degeneration: genetic and mechanistic dissection of a complex trait. Nat Rev Genet. 2010;11:273–284. - PubMed
    1. Smith AJ, Bainbridge JW, Ali RR. Gene supplementation therapy for recessive forms of inherited retinal dystrophies. Gene Ther. 2012;19:154–161. - PubMed
    1. Hartong DT, Berson EL, Dryja TP. Retinitis pigmentosa. Lancet. 2006;368:1795–1809. - PubMed
    1. Frasson M, et al. Retinitis pigmentosa: rod photoreceptor rescue by a calcium-channel blocker in the rd mouse. Nat Med. 1999;5:1183–1187. - PubMed
    1. Leveillard T, Sahel JA. Rod-derived cone viability factor for treating blinding diseases: from clinic to redox signaling. Sci Transl Med. 2010;2:26ps16. - PMC - PubMed

Publication types

Substances