. 2017 Apr;18(4):442-455.
doi: 10.1038/ni.3694. Epub 2017 Feb 27.

Essential role for the transcription factor Bhlhe41 in regulating the development, self-renewal and BCR repertoire of B-1a cells

Affiliations

Essential role for the transcription factor Bhlhe41 in regulating the development, self-renewal and BCR repertoire of B-1a cells

Taras Kreslavsky et al. Nat Immunol. 2017 Apr.

Abstract

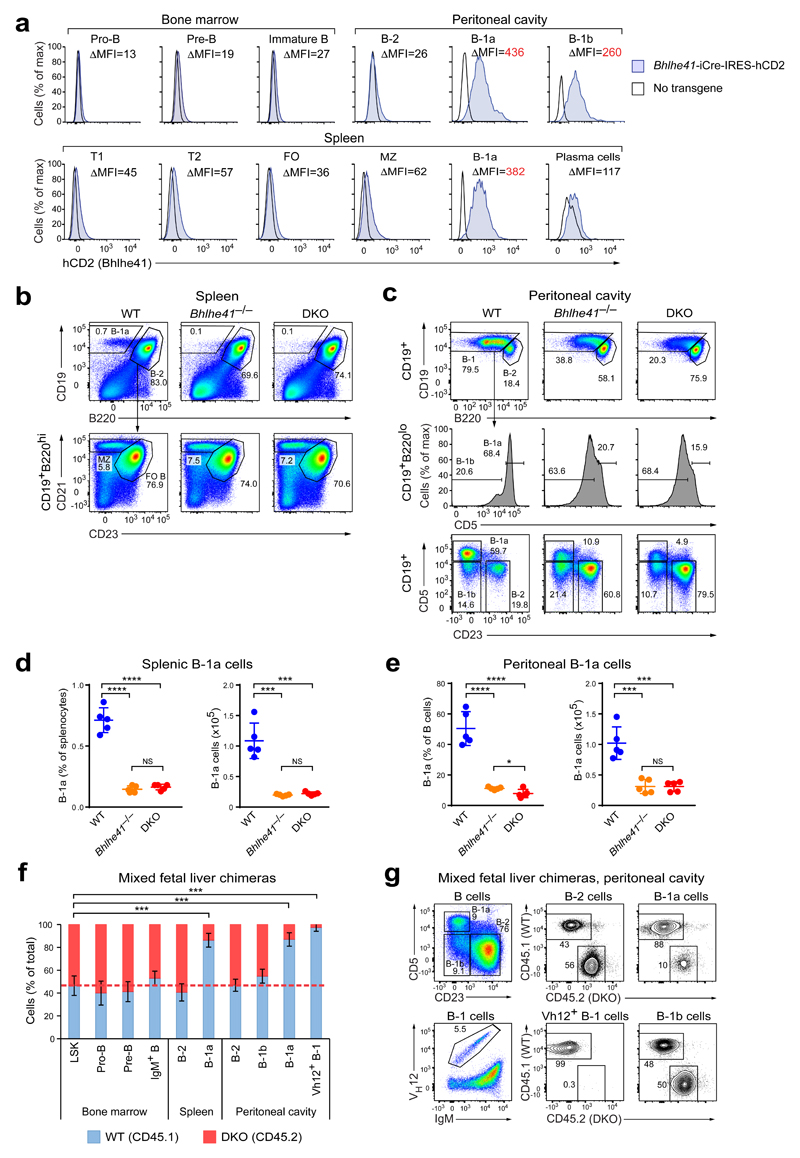
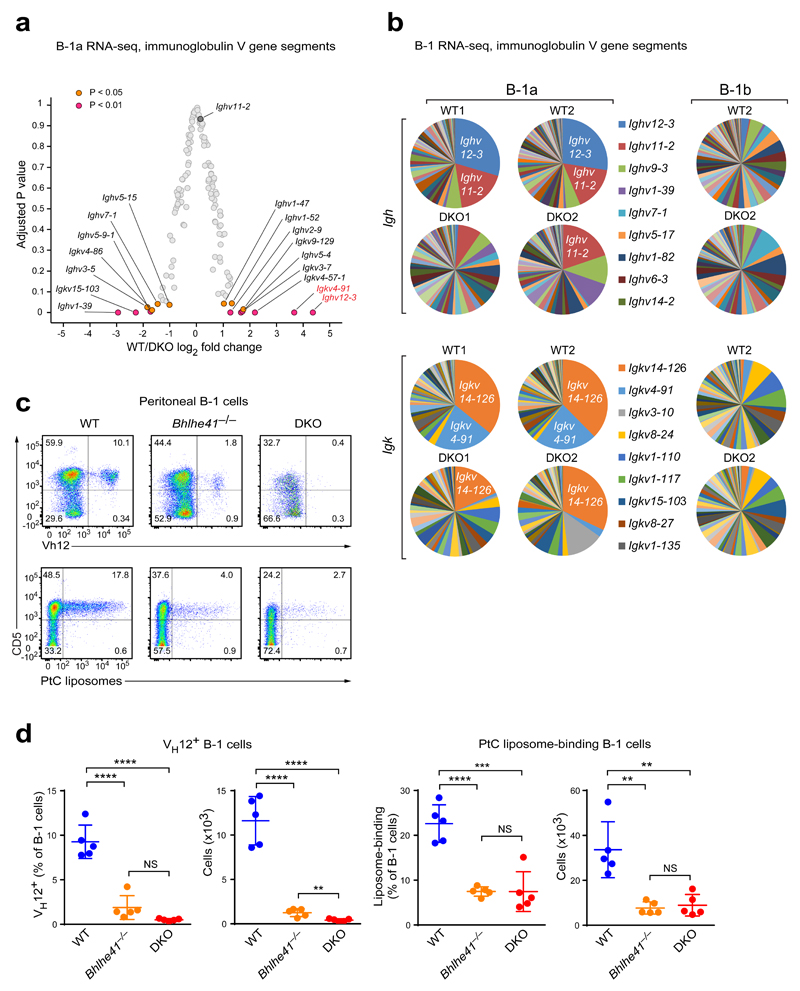
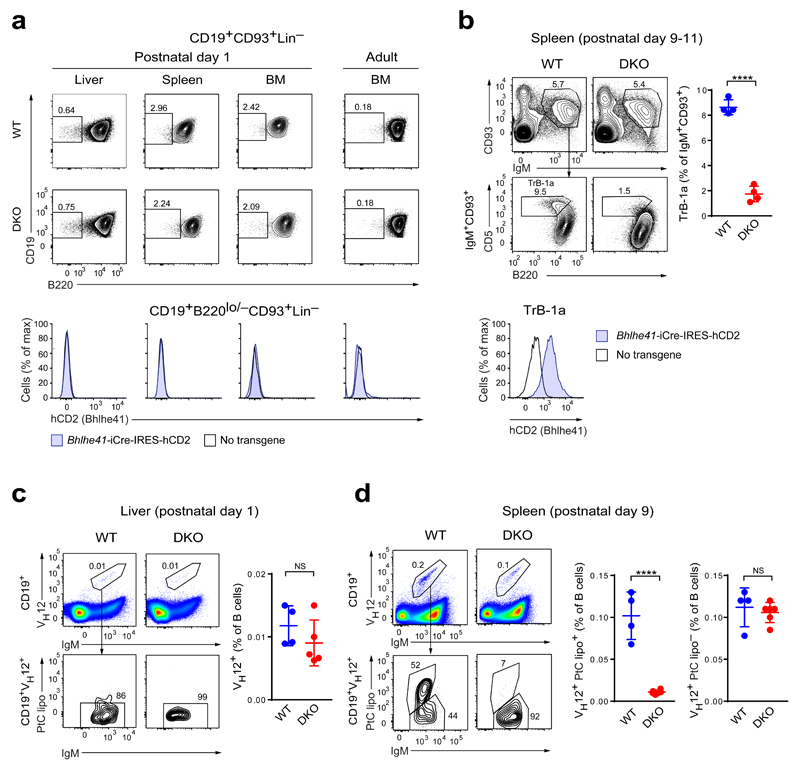
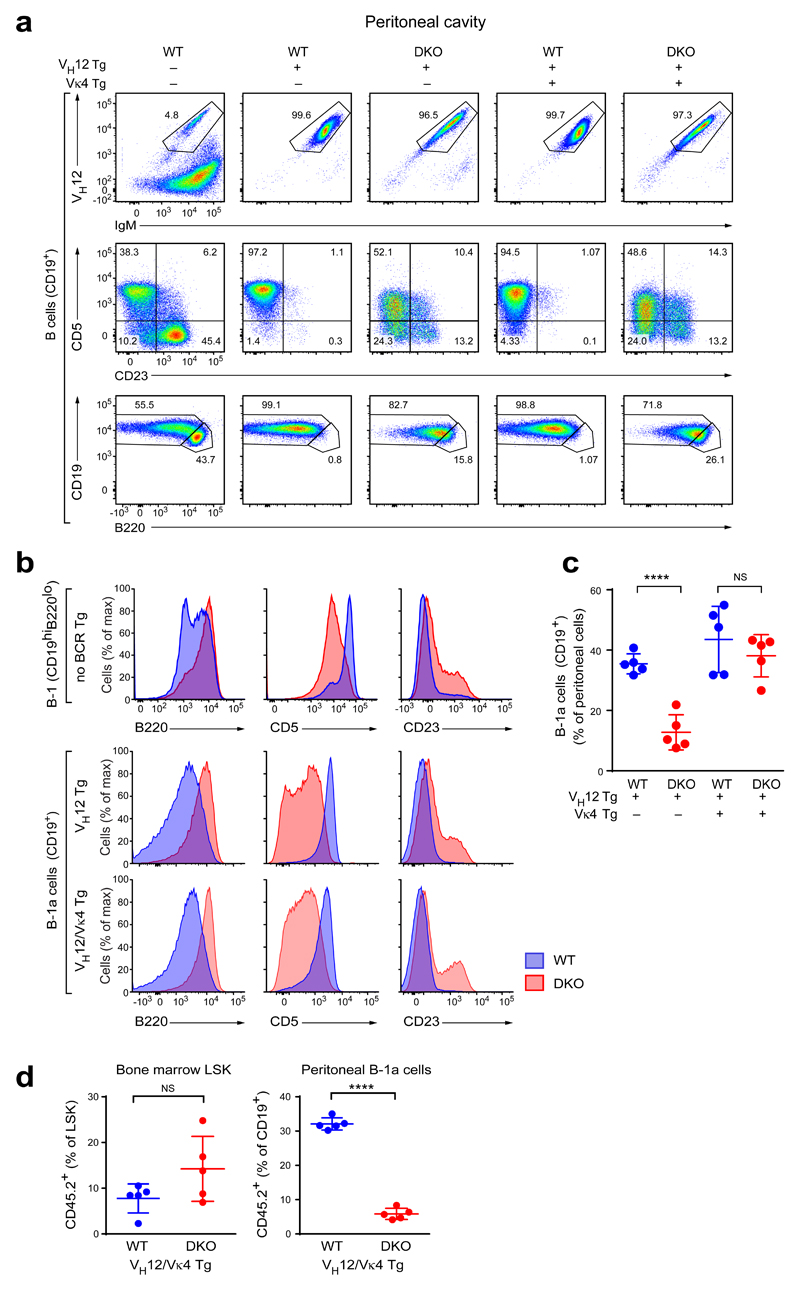
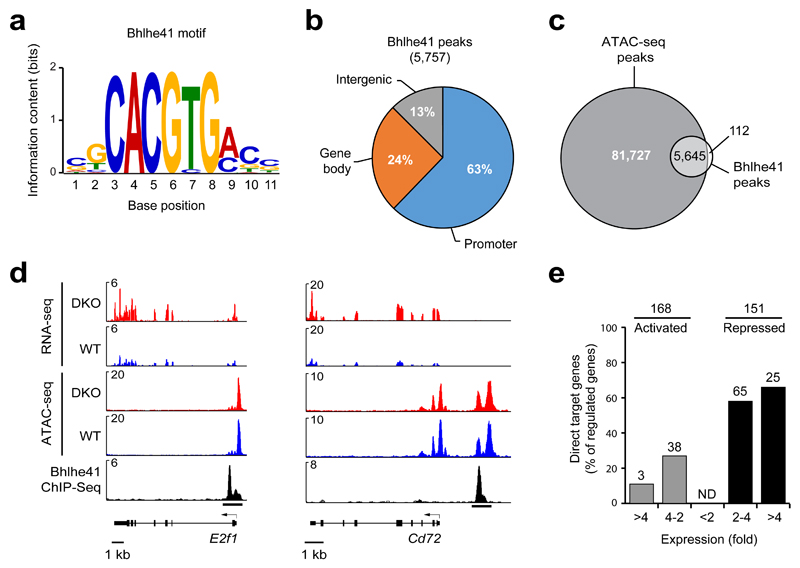
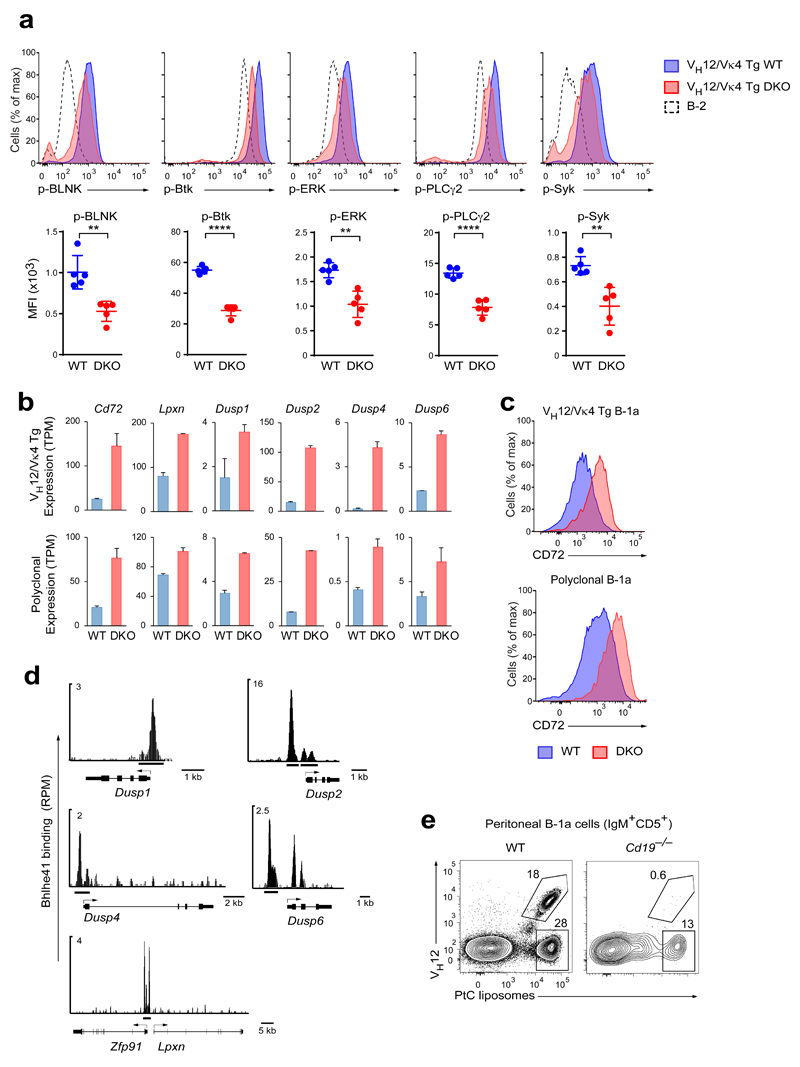
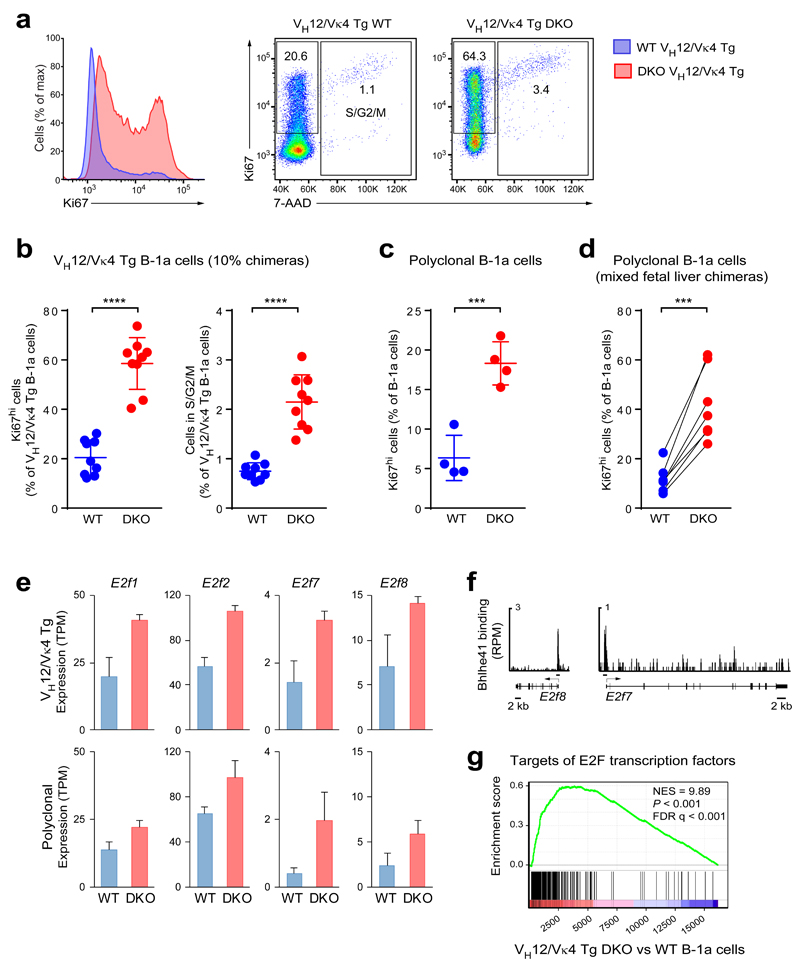
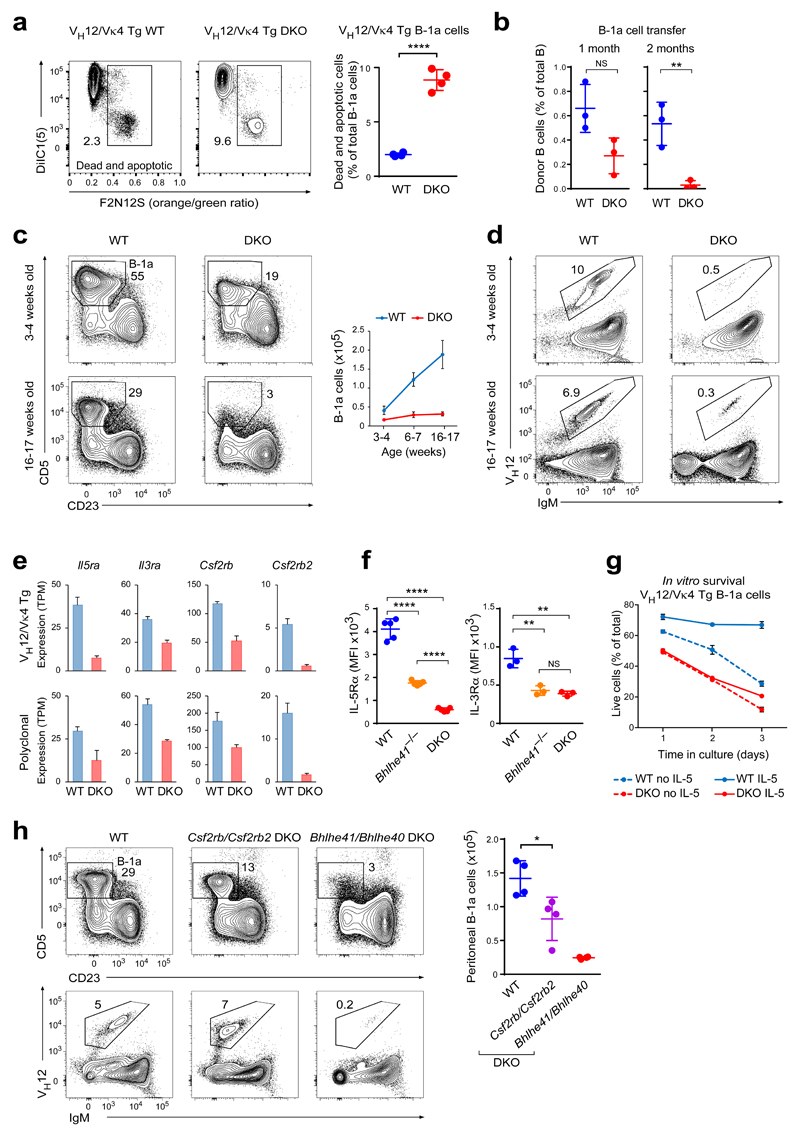
Innate-like B-1a cells provide a first line of defense against pathogens, yet little is known about their transcriptional control. Here we identified an essential role for the transcription factor Bhlhe41, with a lesser contribution by Bhlhe40, in controlling B-1a cell differentiation. Bhlhe41-/-Bhlhe40-/- B-1a cells were present at much lower abundance than were their wild-type counterparts. Mutant B-1a cells exhibited an abnormal cell-surface phenotype and altered B cell receptor (BCR) repertoire exemplified by loss of the phosphatidylcholine-specific VH12Vκ4 BCR. Expression of a pre-rearranged VH12Vκ4 BCR failed to 'rescue' the mutant phenotype and revealed enhanced proliferation accompanied by increased cell death. Bhlhe41 directly repressed the expression of cell-cycle regulators and inhibitors of BCR signaling while enabling pro-survival cytokine signaling. Thus, Bhlhe41 controls the development, BCR repertoire and self-renewal of B-1a cells.


Conflict of interest statement

Competing Financial Interests

The authors declare no competing financial interests.

Figures

Figure 1
Figure 1. B-1a cells depend on the transcription factors Bhlhe41 and Bhlhe40.
(a) Cells from Bhlhe41-iCre-IRES-hCD2 transgenic and wild-type mice were stained with antibodies against human CD2 and markers defining the indicated cell populations. The flow cytometric definition of all cell types is described in the Online Methods. Histograms comparing hCD2 expression of the indicated cell types are shown. The difference in the median fluorescence intensity (ΔMFI) between Bhlhe41-iCre-IRES-hCD2 transgenic and wild-type cells of the indicated cell populations is shown for the pair of wild-type and reporter mice displayed in the plot. One representative result of two independent experiments is shown, and six Bhlhe41-iCre-IRES-hCD2 transgenic mice were analyzed in total. (b-e) Distribution of B cell subsets among splenocytes (b,d) and peritoneal cells (c,e) from wild-type (WT), Bhlhe41–/– and Bhlhe41–/–Bhlhe40–/– (DKO) mice. Gating is applied as indicated. (b,d) The distribution of B-1a, MZ and FO B cells among splenocytes (b), and the quantification of splenic B-1a cells (d) are shown. (c) The distribution of B-1a, B-1b and B-2 cells in the peritoneal cavity was analyzed with two alternative gating strategies. Numbers refer to the percentage of cells in the indicated gates. (e) Quantification of peritoneal B-1a cells, which were defined as CD19+CD5+CD23 cells as shown in the bottom row of (c). Horizontal bars indicate mean value, error bars represent SD. NS P > 0.05, * P < 0.05, *** P < 0.001, **** P < 0.0001, as determined by the Student’s t-test. Five age-matched mice were analyzed per genotype. One representative result of five (c,e) and four (b,d) independent experiments is shown. (f,g) E14.5 fetal liver cells from DKO (CD45.2) and WT (CD45.1) embryos were mixed at a 1:1 ratio and injected into lethally irradiated Rag2–/– recipients. CD45.1 and CD45.2 expression was analyzed for the indicated cell populations 6 weeks after transfer. (f) Frequency of CD45.1+ (WT) and CD45.2+ (DKO) cells in the indicated bone marrow, splenic and peritoneal cell populations. Error bars represent SD, n = 6-7; *** P < 0.001 (Student’s t-test). One representative result of two independent experiments is shown. (g) Representative FACS plots showing the gating of the indicated peritoneal B cell subsets and the frequencies of CD45.1+ and CD45.2+ cells within these populations.
Figure 2
Figure 2. The residual DKO B-1a cells exhibit an altered BCR repertoire.
(a,b) Peritoneal B-1a cells were sorted from four wild-type and four DKO mice, and the sorted cells of each mouse were individually analyzed by RNA-seq. (a) Volcano plot showing expression changes (log2-transformed values; horizontal axis) between wild-type (WT) and DKO cells and adjusted P values (vertical axis) for V gene segments of the immunoglobulin heavy-chain (Igh) and κ light-chain (Igk) loci. (b) Pie charts showing the distribution of RNA-seq reads in V segments of the Igh and Igk genes for B-1a cells from two pairs of wild-type and DKO mice (left) and for B-1b cells from one wild-type and DKO mouse (right). The V genes are named according to the IMGT nomenclature. (c) Peritoneal cells from wild-type, Bhlhe41–/– and DKO mice were stained with antibodies against CD19, B220, CD5, IgM, and VH12 or with FITC-loaded PtC-containing liposomes. Expression of CD5 and the VH12 BCR, as well as binding of liposomes is shown for CD19+B220lo B-1 cells. (d) Frequencies and absolute numbers of VH12+ B-1 cells (left) and liposome-binding B-1 cells (right). Horizontal bars indicate mean value, error bars represent SD. NS P > 0.05, ** P < 0.01, *** P < 0.001, **** P < 0.0001, as determined by the Student’s t-test. Five age-matched mice were used per genotype. One representative result of four (VH12 staining) and two (liposome staining) independent experiments is shown.
Figure 3
Figure 3. Regulation of B-1a cell development by Bhlhe41 and Bhlhe40.
(a) Flow cytometric analysis of LinIgMCD93+CD19+B220lo/– B-1-specified progenitors in neonatal liver, spleen and bone marrow (BM) cells (postnatal day 1) as well as adult BM cells from wild-type (WT) and DKO mice (top and middle rows) or wild-type and Bhlhe41-iCre-IRES-hCD2 transgenic mice (bottom row). For gating strategy see Supplementary Fig. 3b. The frequency of B220lo/– cells among LinIgMCD93+CD19+ B cells (top and middle rows) and the expression of hCD2 by LinIgMCD93+CD19+B220lo/– cells are shown. One representative result of two independent experiments is shown. (b) Flow cytometric analysis of CD93+IgM+CD19+B220loCD5+ transitional B-1a cells (TrB-1a) in the neonatal spleen (postnatal day 9-11) from wild-type and DKO mice (top and middle rows) or wild-type and Bhlhe41-iCre-IRES-hCD2 transgenic mice (bottom row). A representative plots (left) and the frequency of transitional B-1a cells among CD93+IgM+ splenocytes (right) are shown. Horizontal bars indicate mean value, error bars represent SD. **** P < 0.0001, as determined by the Student’s t-test. Four mice were analyzed per genotype. The expression of hCD2 on transitional B-1a cells from Bhlhe41-iCre-IRES-hCD2 transgenic mice is shown for one representative result of two independent experiments. (c) Day-1 neonatal liver cells from wild-type and DKO mice were stained with antibodies against CD19, IgM, VH12 and with PtC-containing liposomes (lipo). The frequency of IgM+VH12+ cells among CD19+ B cells (top and right) and the liposome binding by CD19+IgM+VH12+ cells (bottom) are shown. Horizontal bars indicate mean value, error bars represent SD. NS P > 0.05, as determined by the Student’s t-test. One experiment was performed with 4 wild-type and 5 DKO mice. (d) Flow cytometric analysis of wild-type and DKO splenocytes at postnatal day 9, as described in (c). The frequencies of liposome-binding and non-binding CD19+IgM+VH12+ cells among CD19+ B cells are shown to the right. Horizontal bars indicate mean value, error bars represent SD. NS P > 0.05, **** P < 0.0001, as determined by the Student’s t-test. One representative analysis of 4 wild-type and 6 DKO mice of two independent experiments is shown.
Figure 4
Figure 4. Expression of pre-rearranged VH12 and Vκ4 transgenes fails to rescue the DKO phenotype.
(a) Peritoneal cells from mice of the indicated genotypes were stained with antibodies against VH12, IgM, CD5, CD23, CD19, and B220 and were analyzed by flow cytometry. All plots are gated on CD19+ cells. One representative result of four independent experiments is shown. (b) Histograms showing CD5, B220 and CD23 expression by non-transgenic peritoneal CD19hiB220lo B-1a cells (top) and VH12- and VH12/Vκ4-transgenic (middle and bottom) peritoneal B cells from wild-type (blue) and DKO (red) mice. Note that the non-transgenic and BCR-transgenic cells were analyzed in different experiments, and hence a direct comparison of the absolute values of marker expression is not possible. A representative result of four (VH12-transgenic and VH12/Vκ4-transgenic) and at least seven (polyclonal B-1a cells) independent experiments are shown. (c) Frequency of CD19+ B cells among all peritoneal cells in mice of the indicated genotypes. Horizontal bars indicate mean value, error bars represent SD. NS P > 0.05; **** P < 0.0001, Student’s t-test. Data are shown for five mice per genotype, which were analyzed in 4 independent experiments. (d) Lethally irradiated wild-type B6SJL mice (CD45.1) were injected with a 1:9 mixture of VH12/Vκ4 transgenic wild-type or DKO bone marrow cells (CD45.2) and non-transgenic wild-type bone marrow cells (CD45.1) depleted of T and NK cells. VH12/Vκ4 transgenic bone marrow cells were additionally depleted of VH12+ cells by flow cytometry sorting. The resulting “10% chimeras” were analyzed 6-8 weeks after bone marrow transfer. Frequencies of CD45.2+ cells among bone marrow LinSca1+Kit+ (LSK) cells and peritoneal B cells are shown. Horizontal bars indicate mean value, error bars represent SD. NS P > 0.05; **** P < 0.0001, Student’s t-test. Values for five mice per genotype are plotted. A representative result of two independent experiments is shown.
Figure 5
Figure 5. Identification of regulated Bhlhe41 target genes in B-1a cells.
(a) Consensus Bhlhe41-binding motif identified with an E-value of 1.3 x 10–120 by the de novo motif-discovery program MEME-ChIP. (b) Presence of Bhlhe41 peaks at the indicated gene regions. (c) Overlap of Bhlhe41 peaks with open chromatin regions, which were mapped by ATAC-seq. (d) Presence of open chromatin (ATAC-seq) and RNA transcripts (RNA-seq) at the repressed Bhlhe41 target genes E2f1 and Cd72 in VH12/Vκ4 transgenic wild-type and DKO B-1a cells. Bhlhe41 binding was determined by ChIP-seq analysis of VH12/Vκ4 transgenic Bhlhe41Tag/Tag B-1a cells. (e) Identification of regulated Bhlhe41 target genes in VH12/Vκ4 transgenic B-1a cell. The number (above bars) and frequency (vertical axis) of Bhlhe41 target genes is shown together with the indicated differences in mRNA expression (horizontal axis) in VH12/Vκ4 transgenic DKO B-1a cells relative to their expression in VH12/Vκ4 transgenic wild-type B-1a cells. The 168 activated and 151 repressed genes (without considering Bhlhe41 binding) were selected for an adjusted P value of < 0.05 and a TPM value (transcripts per million) of > 5 in one of the two cell types.
Figure 6
Figure 6. Decreased BCR signaling in VH12/Vκ4 transgenic DKO B-1a cells.
(a) The ex vivo phosphorylation status of the indicated BCR signaling components in VH12/Vκ4 transgenic wild-type and DKO B cells (10% chimeras) as well as in polyclonal B-2 cells was analyzed by flow cytometry. Representative FACS plots (top panels) and median fluorescence intensities (MFI) (bottom panels) are shown. Horizontal bars indicate mean value, and error bars represent SD. ** P < 0.01; **** P < 0.0001, as determined by the Student’s t-test. Five chimeras were used per group. One representative result of two independent experiments is shown. (b) Expression of the indicated negative regulators of BCR signaling in VH12/Vκ4 transgenic (top) and polyclonal (bottom) wild-type and DKO B-1a cells was determined by RNA-seq. TPM – transcripts per million. The data are from two independent RNA-seq experiments per cell type, and error bars indicate SEM. (c) Surface expression of CD72 on the indicated cell types. (d) Bhlhe41 binding (ChIP-seq) at the indicated gene loci that encode negative regulators of BCR signaling. (e) Binding of PtC-containing liposomes and expression of the VH12 BCR by B-1a cells from wild-type and Cd19–/– mice. Eight wild-type mice and seven Cd19–/– mice were analyzed in three independent experiments. For statistical analysis see Supplementary Fig. 6d.
Figure 7
Figure 7. DKO B-1a cells exhibit increased proliferation.
(a) Anti-Ki67 and 7-AAD staining of fixed and permeabilized peritoneal B cells from VH12/Vκ4 transgenic wild-type and DKO mice. Histograms of Ki67 expression (left) and dot plots showing Ki67 and 7-AAD staining (right) are shown. A representative result of two independent experiments is shown. (b) Quantification of Ki67hi B cells and B cells in the S/G2/M phases of the cell cycle in an experiment performed with 10% chimeras. Horizontal bars indicate mean value, and error bars represent SD. **** P < 0.0001, Student’s t-test. Nine chimeric mice were analyzed. One representative result of three independent experiments is shown. (c) Quantification of peritoneal Ki67hi B-1a cells in non-transgenic wild-type and DKO mice. *** P < 0.001, Student’s t-test. Four mice for each genotype were analyzed. One representative result of two independent experiments is shown. (d) Similar analysis of peritoneal B-1a cells from mixed fetal liver chimeras with non-transgenic wild-type and DKO cells (generated as described in the legend of Fig. 1f). Six chimeric mice were analyzed in one experiment. *** P < 0.001; Paired Student’s t-test. (e) Expression of the genes encoding the indicated E2F transcription factors in VH12/Vκ4 transgenic (top) and polyclonal (bottom) wild-type and DKO B-1a cells was determined by RNA-seq. TPM – transcripts per million. The data are from two independent RNA-seq experiments per cell type, and error bars indicate SEM. (f) Bhlhe41 binding (ChIP-seq) at the E2f7 and E2f8 loci. (g) Gene set enrichment analysis (GSEA) of E2F target genes (gene set “Hallmark_E2F_Targets”; MSigDB) as compared to the ranked log2-fold gene expression changes between VH12/Vκ4 transgenic DKO and wild-type B-1a cells.
Figure 8
Figure 8. Bhlhe41 and Bhlhe40 regulate B-1a cell self-renewal.
(a) Ex vivo cell death of VH12/Vκ4 transgenic wild-type and DKO B cells (10% chimeras) was determined by loss of plasma membrane asymmetry (F2N12S ratiometric die staining) and loss of mitochondrial membrane potential (DiIC1(5) staining). Representative flow cytometry plots (left) and the quantification of dead and apoptotic cells (right) are shown. Horizontal bars indicate mean value, and error bars show SD. **** P < 0.0001, Student’s t-test. Four chimeric mice were analyzed for each genotype. One representative result of two independent experiments is shown. (b) Equal numbers (105 cells) of sorted CD19+CD5+CD23 B-1a cells from wild-type and DKO mice (CD45.2) were transferred intraperitoneally into sublethally irradiated wild-type recipients (CD45.1). The frequency of donor B cells (CD19+CD45.1CD45.2+) among total peritoneal CD19+ B cells is shown for recipients analyzed at the indicated time after transfer. Three recipients were analyzed per group at each time point. Horizontal bars indicate mean value, and error bars show SD. NS P > 0.05; ** P < 0.01 as determined by the Student’s t-test. Horizontal bars indicate mean value, and error bars show SD. One representative result of two independent experiments is shown. (c) The frequencies and absolute numbers of peritoneal B-1a cells were analyzed by flow cytometry in wild-type and DKO mice at the indicated age. Representative plots gated on peritoneal CD19+ cells (left) and the quantification of B-1a cells (right) are shown for one experiment with 4 mice being analyzed per each group. Error bars indicate SD. (d) Representative flow cytometry plots showing IgM and VH12 expression on peritoneal B-1 cell from mice at the indicated age. (e) Expression of the genes encoding the indicated α- and β-chains of the IL-5, IL-3 and GM-CSF receptor family in VH12/Vκ4 transgenic (top) and polyclonal (bottom) wild-type and DKO B-1a cells, as determined by RNA-seq. TPM – transcripts per million. The data are from two independent RNA-seq experiments per cell type, and error bars indicate SEM. (f) Quantification of surface IL-5Rα and IL-3Rα expression on polyclonal B-1a cells of the indicated genotypes. Horizontal bars indicate mean value, error bars represent SD. ** P < 0.01; **** P < 0.0001, Student’s t-test. Five (IL-5Rα) and three (IL-3Rα) mice were analyzed per genotype. MFI – median fluorescence intensity. One representative result of two (IL-3Rα) and four (IL-5Rα) independent experiments is shown, respectively. (g) Peritoneal VH12/Vκ4 transgenic B-1a cells from bone marrow chimeras were sorted and incubated with or without IL-5 (10 ng/ml). Cultured cells were stained with 7-AAD at the indicated time points. The frequency of live cells (7-AAD-negative) at each time point is plotted. Three mice were analyzed per genotype. Error bars represent SD. One representative result of two independent experiments is shown. (h) Frequency and number of peritoneal B-1a cells and VH12+ B-1 cells in five-month-old wild-type, Csf2rb/Csf2rb2 mutant and Bhlhe41/Bhlhe40 mutant mice. Horizontal bars indicate mean value, error bars represent SD. * P < 0.05; Student’s t-test. Four mice were analyzed per genotype. One representative result of three independent experiments is shown.

Comment in

References

    1. Hayakawa K, Hardy RR, Parks DR, Herzenberg LA. The “Ly-1 B” cell subpopulation in normal immunodefective, and autoimmune mice. J Exp Med. 1983;157:202–218. - PMC - PubMed
    1. Baumgarth N. The double life of a B-1 cell: self-reactivity selects for protective effector functions. Nat Rev Immunol. 2011;11:34–46. - PubMed
    1. Montecino-Rodriguez E, Dorshkind K. B-1 B cell development in the fetus and adult. Immunity. 2012;36:13–21. - PMC - PubMed
    1. Casola S, et al. B cell receptor signal strength determines B cell fate. Nat Immunol. 2004;5:317–327. - PubMed
    1. Hardy RR, Hayakawa K. B cell development pathways. Annu Rev Immunol. 2001;19:595–621. - PubMed

Publication types

MeSH terms

Substances