. 2017:2017:2389753.
doi: 10.1155/2017/2389753. Epub 2017 Jan 30.

Allogeneic Adipose-Derived Mesenchymal Stromal Cells Ameliorate Experimental Autoimmune Encephalomyelitis by Regulating Self-Reactive T Cell Responses and Dendritic Cell Function

Affiliations

Allogeneic Adipose-Derived Mesenchymal Stromal Cells Ameliorate Experimental Autoimmune Encephalomyelitis by Regulating Self-Reactive T Cell Responses and Dendritic Cell Function

Per Anderson et al. Stem Cells Int. 2017.

Abstract

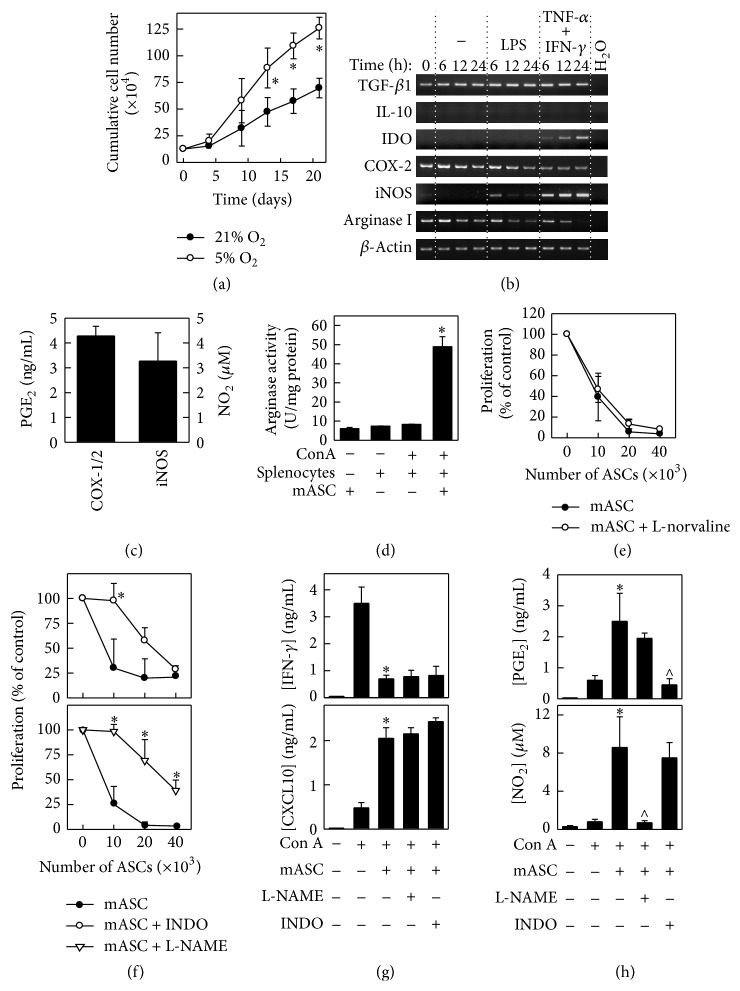
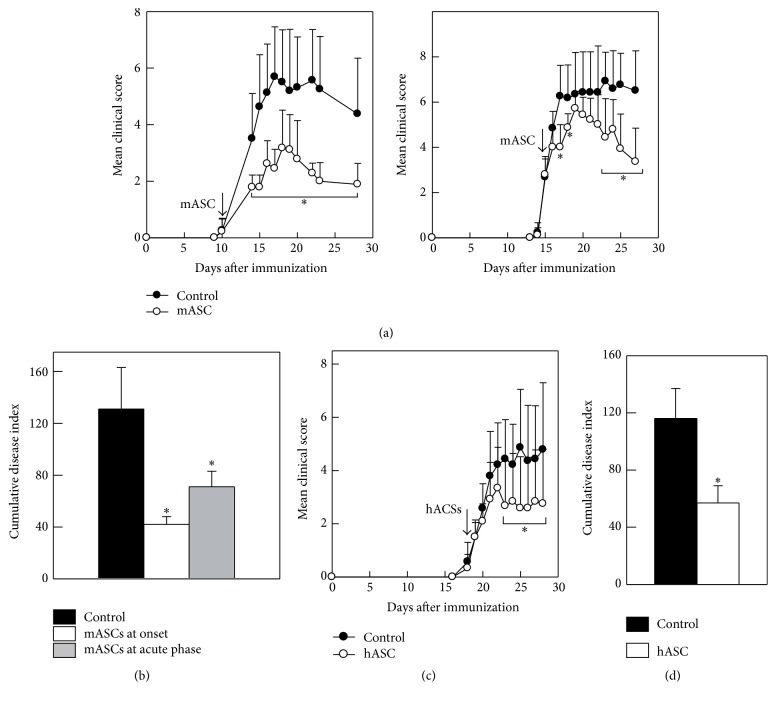
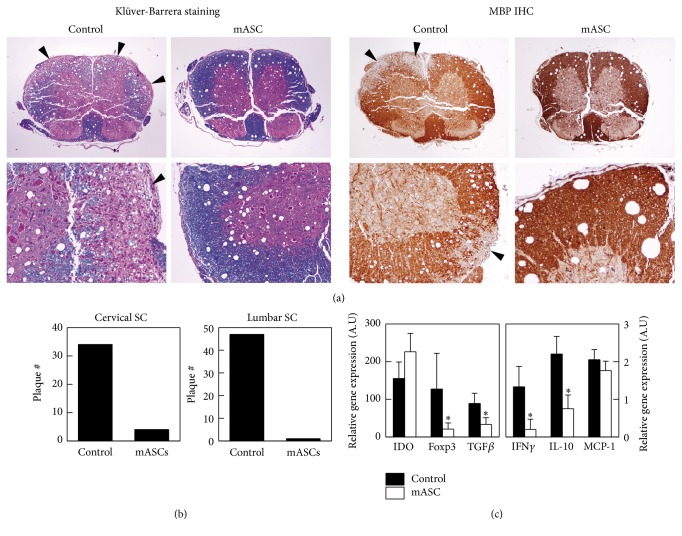
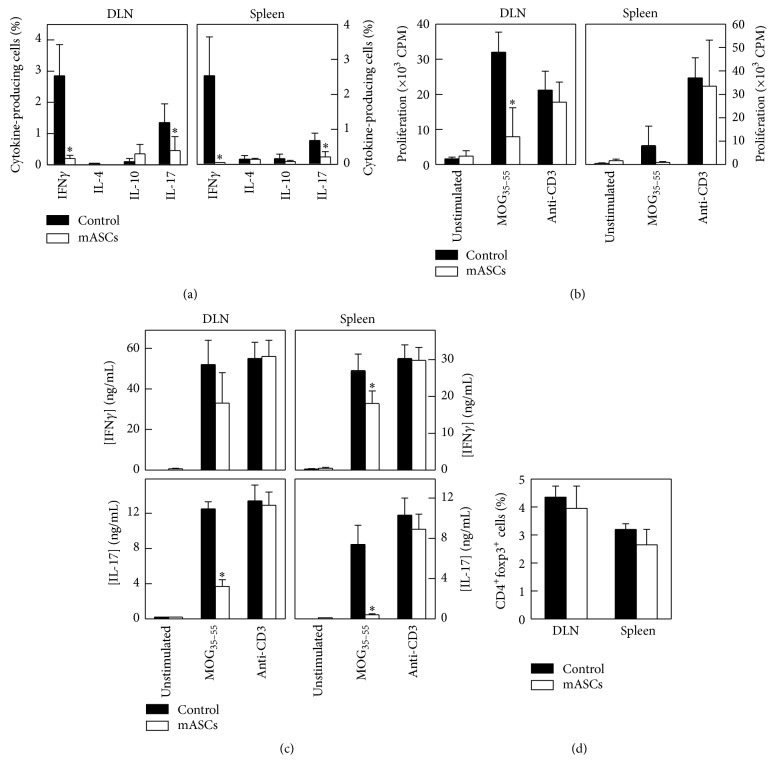
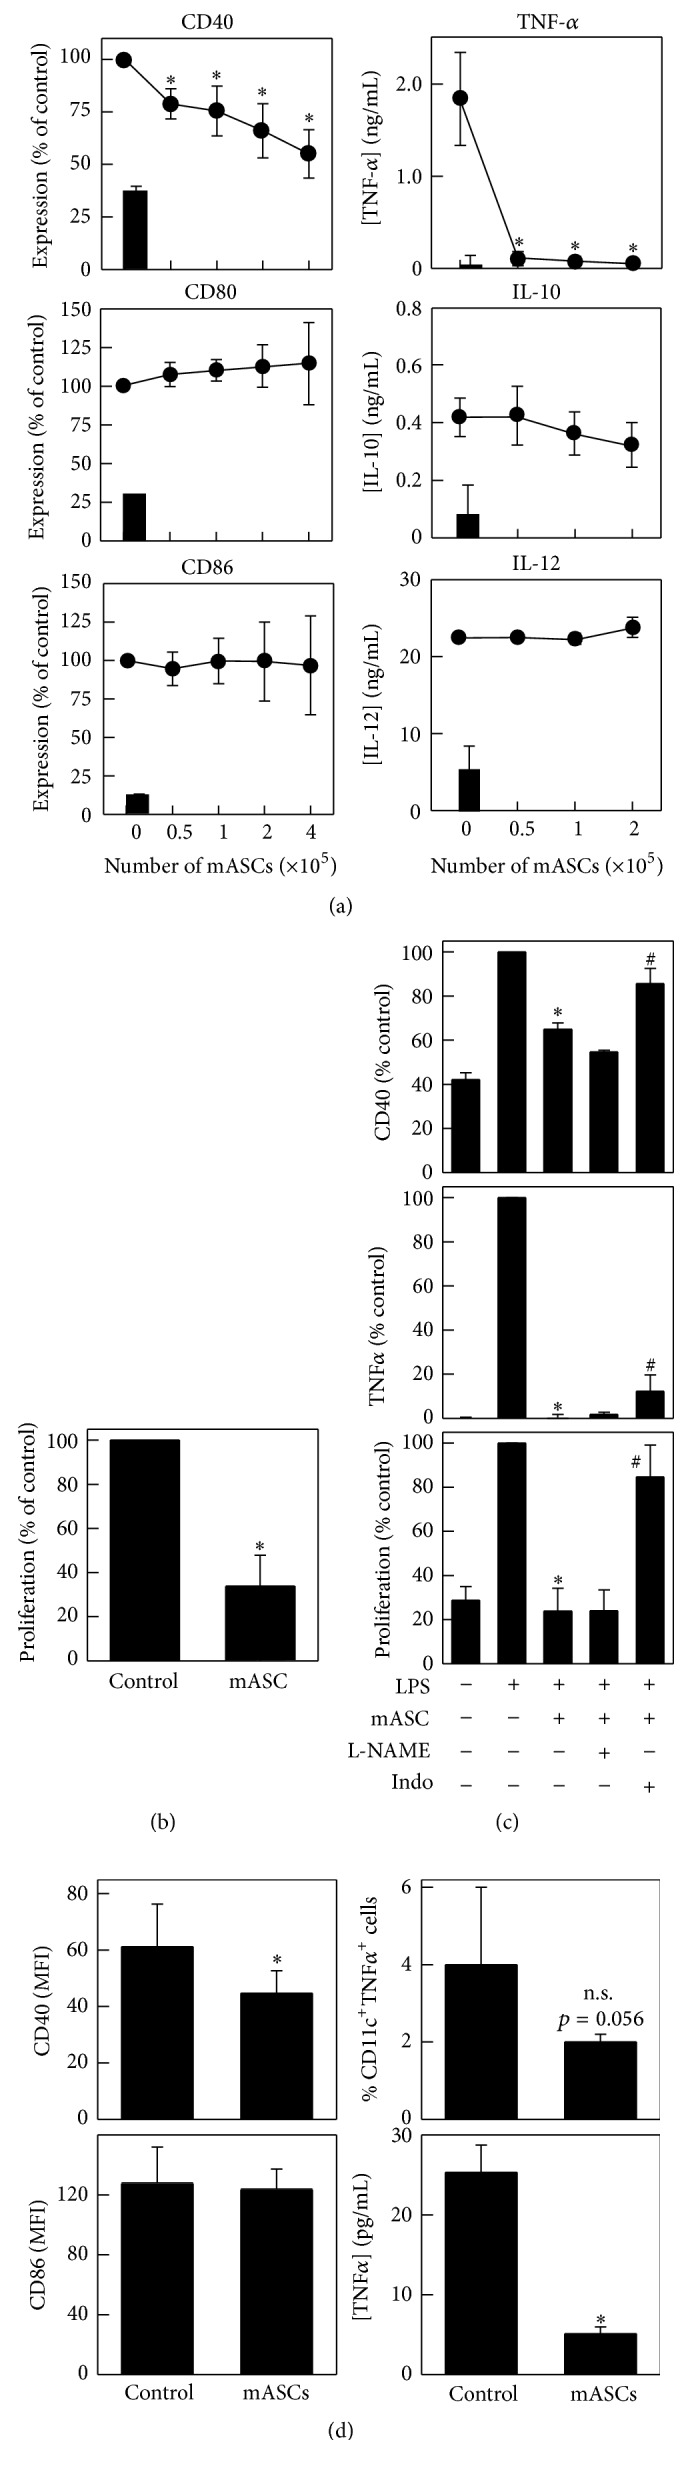
Multipotent mesenchymal stromal cells (MSCs) have emerged as a promising therapy for autoimmune diseases, including multiple sclerosis (MS). Administration of MSCs to MS patients has proven safe with signs of immunomodulation but their therapeutic efficacy remains low. The aim of the current study has been to further characterize the immunomodulatory mechanisms of adipose tissue-derived MSCs (ASCs) in vitro and in vivo using the EAE model of chronic brain inflammation in mice. We found that murine ASCs (mASCs) suppress T cell proliferation in vitro via inducible nitric oxide synthase (iNOS) and cyclooxygenase- (COX-) 1/2 activities. mASCs also prevented the lipopolysaccharide- (LPS-) induced maturation of dendritic cells (DCs) in vitro. The addition of the COX-1/2 inhibitor indomethacin, but not the iNOS inhibitor L-NAME, reversed the block in DC maturation implicating prostaglandin (PG) E2 in this process. In vivo, early administration of murine and human ASCs (hASCs) ameliorated myelin oligodendrocyte protein- (MOG35-55-) induced EAE in C57Bl/6 mice. Mechanistic studies showed that mASCs suppressed the function of autoantigen-specific T cells and also decreased the frequency of activated (CD11c+CD40high and CD11c+TNF-α+) DCs in draining lymph nodes (DLNs). In summary, these data suggest that mASCs reduce EAE severity, in part, through the impairment of DC and T cell function.


Conflict of interest statement

No competing financial interests exist

Figures

Figure 1
Figure 1
mASCs expanded in hypoxia maintain their immunosuppressive activities. (a) Proliferative response of mASCs expanded in normoxia (21% O2) or in hypoxia (5% O2). mASCs were seeded at 5000 cells/cm2 in T25 flasks and counted at different time points when reaching 70–80% of confluence. Data are shown as mean (SD) of one representative experiment out of three. p < 0.05 versus 21% O2. ((b) and (c)) Immune phenotypic characterization of mASCs. mASCs were expanded under hypoxic conditions and then cultured with medium (unstimulated) or stimulated with LPS (1 μg/mL) or TNF-α (10 ng/mL) and IFN-γ (10 ng/mL) for different time points (24 hours for NO2 determination). Gene expression of different immune markers was analyzed using semiquantitative PCR. iNOS activity was measured in TNF-α/IFN-γ-stimulated mASCs by the detection of NO2 in culture supernatants using Griess assay. COX-1/2 activity was determined by measuring the PGE2 levels in culture supernatants from unstimulated mASCs. (d) Arginase activity is induced in mASC: splenocyte cocultures. Splenocytes were cultured with or without mASCs and stimulated with ConA for 3 days. Defined quantities of cell lysates were then subjected to an in vitro arginase activity assay. Data are shown as mean (SEM) of 3 independent experiments. p < 0.05 versus splenocytes + ConA. ((e), (f), and (g)) mASCs suppress T cell proliferation in vitro via iNOS and COX-1/2 but not arginase activity. Splenocytes (106 cells/mL) were stimulated with ConA (2.5 μg/mL) in the presence of different numbers of mitomycin C-treated mASCs (ratio 20 : 1 for IFN-γ and CXCL10 determination). ((e) and (f)) The iNOS inhibitor L-NAME (1 mM), the COX-1/2 inhibitor indomethacin (20 μM), and the arginase inhibitor L-norvaline (10 mM) were added to cultures when indicated. After 3 days, cell proliferation was measured by [3H]-thymidine incorporation and (g) IFN-γ and CXCL10 contents in the supernatants were determined by ELISA. Data are shown as mean (SEM) of 3 independent experiments. p < 0.05 versus mASC in (f) and p < 0.05 versus ConA in (g). (h) iNOS and COX-2 activities are increased in mASC: splenocyte cocultures. ConA-stimulated splenocytes (106 cells/mL) were cultured with mitomycin C-treated mASCs (ratio 20 : 1) in the presence of L-NAME or indomethacin for 3 days and the PGE2 and NO2 contents measured in the culture supernatants. Results are shown as mean (SEM) of 3 separate experiments. p < 0.05 versus ConA; p < 0.05 versus mASC + ConA.
Figure 2
Figure 2
Allogeneic and xenogeneic ASC reduce EAE severity. Chronic progressive EAE was induced in C57Bl/6 mice by immunization with MOG35-55. Animals were injected intraperitoneally with PBS (control) or with hypoxia-expanded allogeneic mASCs (106 cells/mouse) either at the onset of EAE (day 11 after immunization) when the mean clinical score was 0.25 in the control group (n = 8 mice) and 0.22 in the mASC-treated group (n = 9 mice) or at the acute phase of EAE (day 15 after immunization) when the mean clinical score was 2.7 in the control group (n = 6 mice) and 2.8 in the mASC-treated group (n = 7 mice). (a) Clinical symptoms were scored daily in the group treated at onset (left panel) and at the acute phase of EAE (right panel). (b) Cumulative disease index is the sum of daily clinical scores observed between days 20 and 40. Results are shown as mean (SD). p < 0.05 versus control. (c) Human ASCs ameliorate EAE. Mice with MOG-induced EAE were intraperitoneally injected with PBS (control, n = 7) or with hASCs expanded in hypoxia (106 cells/mouse, n = 6 mice) during the acute phase of the disease (arrow) when the mean clinical score was 1.5 in both groups. Clinical symptoms were scored daily. (d) Cumulative disease index is the sum of daily clinical scores observed between days 20 and 40. Results are shown as mean (SD). p < 0.05 versus control.
Figure 3
Figure 3
Allogeneic mASCs reduce demyelinization and inflammatory infiltration in the central nervous system during EAE progression. Mice with MOG-induced EAE were intraperitoneally injected with PBS (control, n = 4) or with mASCs expanded in hypoxia (106 cells/mouse, n = 4) after the onset of the clinical symptoms, and spinal cords were obtained at the peak of the disease 7 days later. ((a) and (b)) Transverse sections of cervical and lumbar regions of spinal cord were randomly analyzed for the presence of inflammatory infiltrates and plaques of demyelinization using the Klüver-Barrera staining (left panels) and anti-myelin basic protein immunohistochemistry (right panels). Arrows point to areas of demyelinization. (c) Gene expression of different inflammatory markers was determined by PCR in mRNAs isolated from the spinal cords. Results are shown as mean (SD) of 4 mice per group. p < 0.05 versus control.
Figure 4
Figure 4
Allogeneic mASCs inhibit MOG-specific immune responses but do not induce foxp3+ Tregs. mASCs were injected intraperitoneally in MOG-induced EAE mice after the onset of the clinical symptoms and spleens and DLNs were isolated at the peak of the disease. Untreated EAE mice were used as controls. (a) The percentages of cytokine-producing cells in spleen and DLNs were determined by intracellular flow cytometry as described in Materials and Methods. ((b) and (c)) DLN and spleen cells were cultured with medium (unstimulated) or stimulated with MOG35-55 (50 μg/mL) or anti-CD3 (1 μg/mL, used as unspecific stimulation). Proliferation was measured after 3 days by [3H]-thymidine incorporation (b). The content of cytokines was determined in culture supernatants after 48 hours (c). (d) The percentages of CD4+Foxp3+ T cells in spleen and DLNs were determined by flow cytometry. Results are shown as mean (SD) from 4 mice per group. p < 0.05 versus control.
Figure 5
Figure 5
mASCs inhibit the maturation/activation of dendritic cells in vitro and in vivo. (a) mASCs inhibit the maturation of DCs in vitro. Bone marrow-derived DCs from C57BL/6 mice (4 × 10⁵ cells/well) were matured/activated with LPS (1 μg/mL) in the absence or presence of different numbers of mASCs. After 48 hours, nonadherent or loosely adherent cells were harvested (>95% CD11c+ DCs) and analyzed for surface expression of CD40, CD80, and CD86, and the culture supernatants were analyzed for TNF-α, IL-10, and IL-12 content by ELISA. Data for nonstimulated immature DCs are shown as black bars. Results are shown as mean (SEM) of 3 (CD40, CD80, and CD86 FACS and IL-12 ELISA) or 4 (IL-10 and TNF-α ELISA) independent experiments. p < 0.05 versus control (no mASCs). (b) mASC-treated DCs show impaired costimulatory activity on T cells. C57Bl/6 DCs (4 × 10⁵ cells) were LPS-matured in the absence (control) or presence of mASCs (2 × 10⁵ cells) for 48 hours and then added to allogeneic BALB/c splenocytes (used as responders). The proliferation in the MLR was measured by [3H]-thymidine incorporation. Results are shown as mean (SEM) of 3 independent experiments. p < 0.05 versus control. (c) COX-1/2 but not iNOS activity is partly responsible for the effect of mASCs on DC maturation. C57Bl/6 DCs (4 × 10⁵ cells) were LPS-matured in the absence or presence of mASCs (2 × 10⁵ cells) and L-NAME (1 mM) or indomethacin (20 μM) for 48 hours. Expression of CD40 was determined in CD11c+ cells by flow cytometry (5 independent experiments) and the levels of TNF-α in culture supernatants were measured by ELISA (3 independent experiments). The costimulatory activity of the mASC-treated DCs was determined in a MLR using BALB/c splenocytes as responders (4 independent experiments). Results are expressed as percentage of values found with control samples treated with LPS alone in the absence of mASCs and shown as mean (SEM) of the independent experiments. p < 0.05 versus control; #p < 0.05 versus mASCs. (d) mASC treatment impairs DC function in DLNs of EAE mice. C57BL/6 mice with initial EAE symptoms (scores 1-2) were injected intraperitoneally with allogeneic mASCs (106 cells/mouse) isolated from BALB/c mice. After 7 days, DLN cells from untreated (mean score 4.6 (1.0)) and mASC-treated mice (mean score 2.1 (1.0)) were analyzed for the expression of surface CD11c, CD40 (n = 8 mice/group), and CD86 (n = 5 mice/group) and intracellular TNF-α (n = 4 mice/group) by flow cytometry as described in Materials and Methods. CD11c+ DCs were purified by magnetic separation from DLNs from untreated (control) or mASC-treated mice (n = 4 mice/group), restimulated (2.5 × 10⁵ cells/mL) with LPS (1 μg/mL) for 24 hours, and the TNF-α levels in supernatants are determined by ELISA (lower right panel). Results are shown as mean (SD). p < 0.05.

References

    1. Crisan M., Yap S., Casteilla L., et al. A perivascular origin for mesenchymal stem cells in multiple human organs. Cell Stem Cell. 2008;3(3):301–313. doi: 10.1016/j.stem.2008.07.003. - DOI - PubMed
    1. Méndez-Ferrer S., Michurina T. V., Ferraro F., et al. Mesenchymal and haematopoietic stem cells form a unique bone marrow niche. Nature. 2010;466(7308):829–834. doi: 10.1038/nature09262. - DOI - PMC - PubMed
    1. Nombela-Arrieta C., Ritz J., Silberstein L. E. The elusive nature and function of mesenchymal stem cells. Nature Reviews Molecular Cell Biology. 2011;12(2):126–131. doi: 10.1038/nrm3049. - DOI - PMC - PubMed
    1. Dominici M., Le Blanc K., Mueller I., et al. Minimal criteria for defining multipotent mesenchymal stromal cells. The International Society for Cellular Therapy position statement. Cytotherapy. 2006;8(4):315–317. doi: 10.1080/14653240600855905. - DOI - PubMed
    1. Russell K. C., Phinney D. G., Lacey M. R., Barrilleaux B. L., Meyertholen K. E., O'Connor K. C. In vitro high-capacity assay to quantify the clonal heterogeneity in trilineage potential of mesenchymal stem cells reveals a complex hierarchy of lineage commitment. Stem Cells. 2010;28(4):788–798. doi: 10.1002/stem.312. - DOI - PubMed