. 2017 Feb 27:3:17013.
doi: 10.1038/cddiscovery.2017.13. eCollection 2017.

MPP+ induces necrostatin-1- and ferrostatin-1-sensitive necrotic death of neuronal SH-SY5Y cells

Affiliations

MPP+ induces necrostatin-1- and ferrostatin-1-sensitive necrotic death of neuronal SH-SY5Y cells

Keisuke Ito et al. Cell Death Discov. .

Abstract

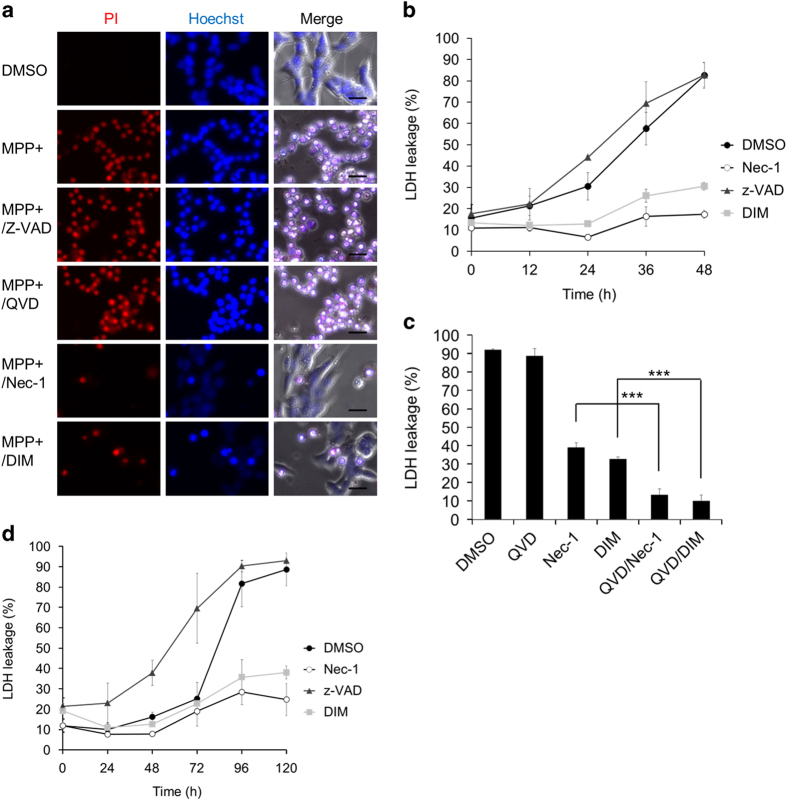
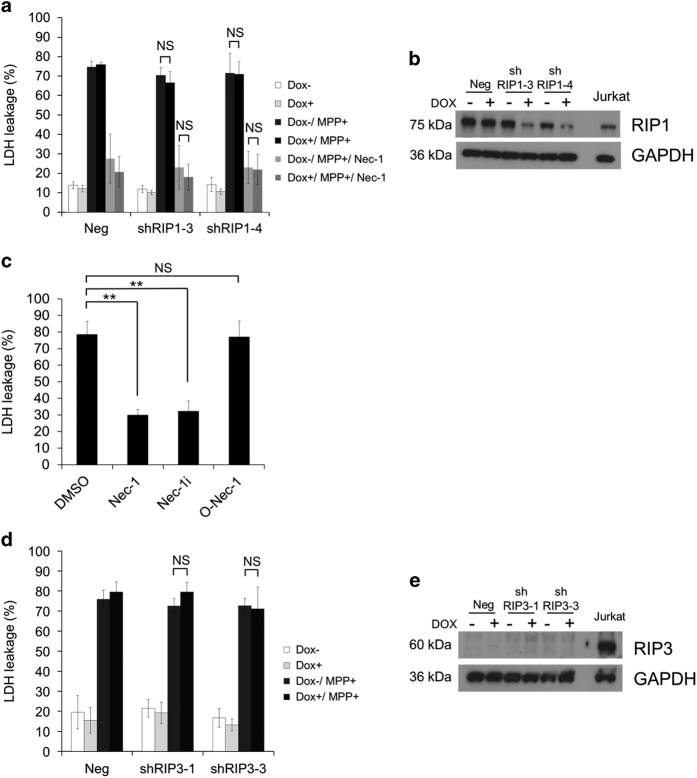
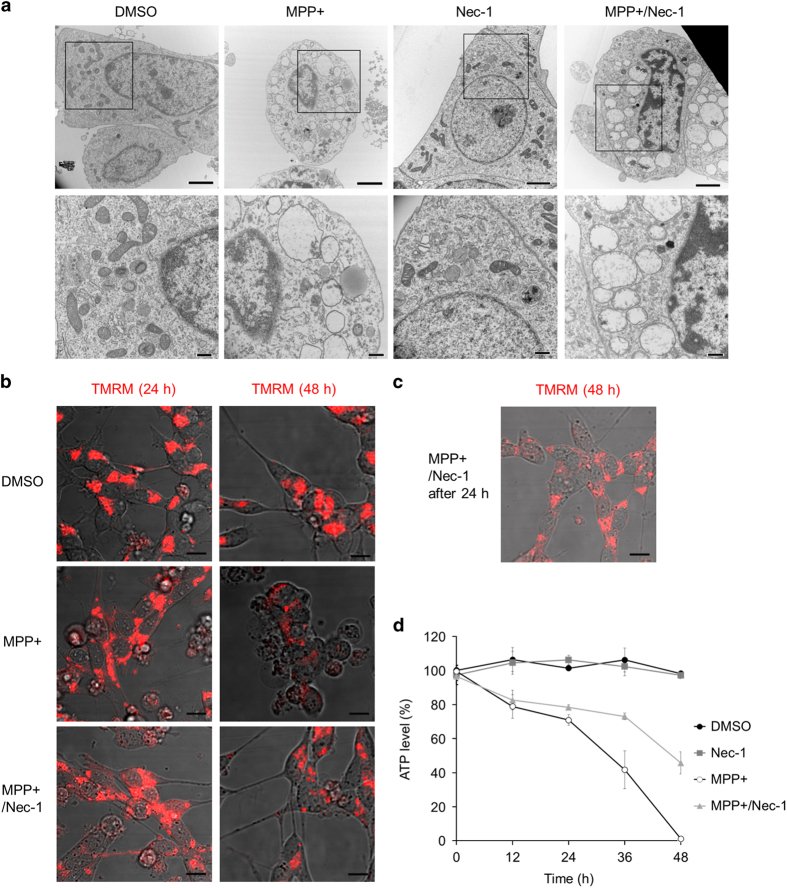
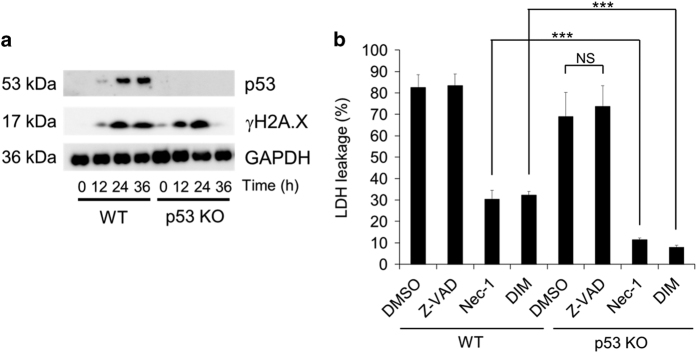
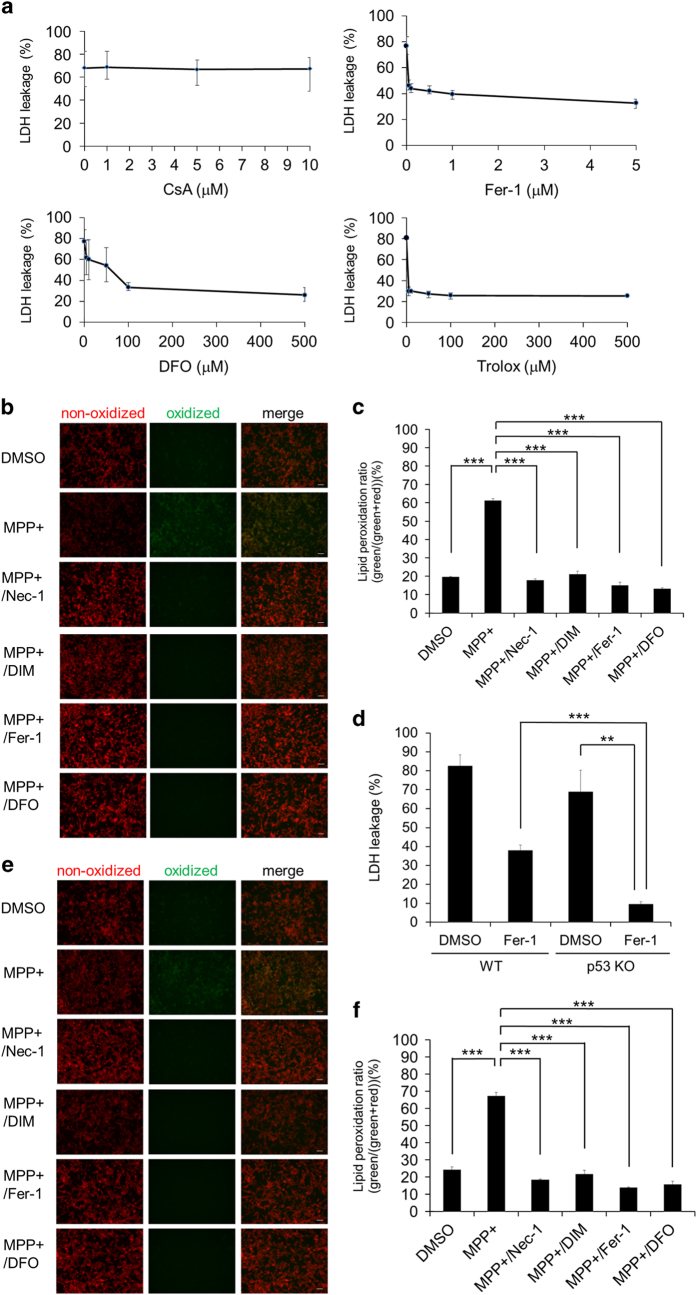
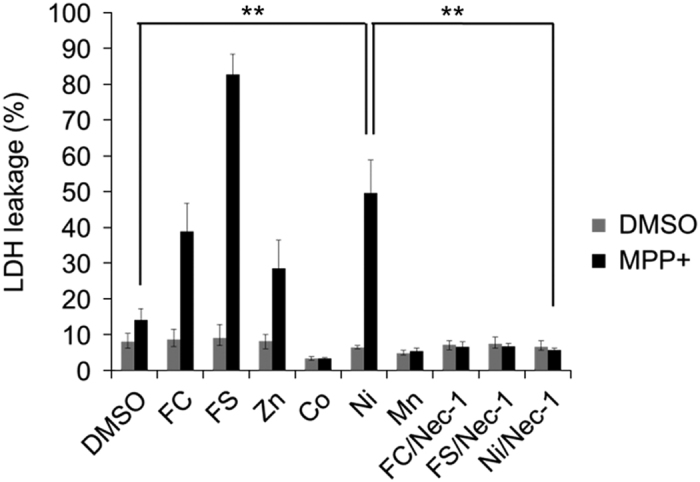
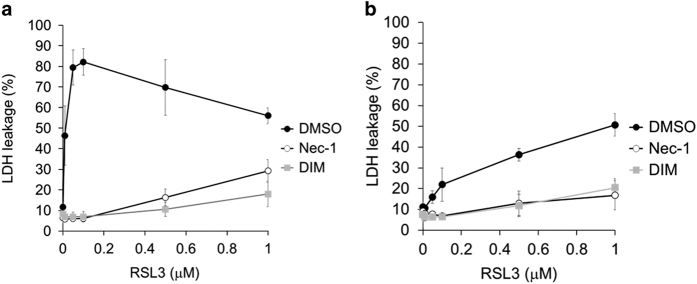
Regulation of cell death is potentially a powerful treatment modality for intractable diseases such as neurodegenerative diseases. Although there have been many reports about the possible involvement of various types of cell death in neurodegenerative diseases, it is still unclear exactly how neurons die in patients with these diseases, thus treatment strategies based on cell death regulation have not been established yet. To obtain some insight into the mechanisms of cell death involved in neurodegenerative diseases, we studied the effect of 1-methyl-4-phenylpyridinium (MPP+) on the human neuroblastoma cell line SH-SY5Y (a widely used model of Parkinson's disease). We found that MPP+ predominantly induced non-apoptotic death of neuronally differentiated SH-SY5Y cells. This cell death was strongly inhibited by necrostatin-1 (Nec-1), a necroptosis inhibitor, and by an indole-containing compound (3,3'-diindolylmethane: DIM). However, it occurred independently of receptor-interacting serine/threonine-protein kinase 1/3 (RIP1/RIP3), indicating that this form of cell death was not necroptosis. MPP+-induced cell death was also inhibited by several inhibitors of ferroptosis, including ferrostatin-1 (Fer-1). Although MPP+-induced death and ferroptosis shared some features, such as occurrence of lipid peroxidation and inhibition by Fer-1, MPP+-induced death seemed to be distinct from ferroptosis because MPP+-induced death (but not ferroptosis) was inhibited by Nec-1, was independent of p53, and was accompanied by ATP depletion and mitochondrial swelling. Further investigation of MPP+-induced non-apoptotic cell death may be useful for understanding the mechanisms of neuronal loss and for treatment of neurodegenerative diseases such as Parkinson's disease.


Conflict of interest statement

The authors declare no conflict of interest.

Figures

Figure 1
Figure 1
MPP+ induces non-apoptotic cell death, which is inhibited by Nec-1 and DIM. Neuronal SH-SY5Y cells were pretreated with inhibitors 30 min before the addition of MPP+ or rotenone. The inhibitors were Z-VAD-FMK (Z-VAD, 50 μM), QVD-OPh (QVD, 10 μM), Nec-1 (20 μM), and DIM (20 μM). (a) Cells were treated with MPP+ (5 mM) for 48 h and stained by adding PI (1 μg/ml)/Hoechst 33342 (1 μg/ml) to the culture medium. Scale bar=20 μm. (b and c) Cells were treated with MPP+ (5 mM) for the indicated time (b) or 48 h (c) with inhibitors or dimethyl sulfoxide (DMSO) (control). Cell death was calculated from lactate dehydrogenase (LDH) leakage. (d) Cells were treated with rotenone (100 nM) for the indicated time. Cell death was calculated from LDH leakage. Data are shown as the mean±S.D. of three independent experiments. ***P<0.001.
Figure 2
Figure 2
MPP+-induced cell death is not dependent on necroptosis. (a and b) After treatment of SH-SY5Y cells with RA, RIP1 short hairpin RNA (shRNA) was induced by incubation with Dox (2 μg/ml) for 5 days in the presence of BDNF. (a) Dox-treated neuronal cells were incubated with MPP+ (5 mM) for 48 h in the presence or absence of Nec-1 (20 μM). Cell death was calculated from lactate dehydrogenase (LDH) leakage. (b) RIP1 and glyceraldehyde 3-phosphate dehydrogenase (GAPDH) were detected by western blotting. The extreme right lane is Jurkat cell lysate (positive control). (c) Cells were treated with MPP+ in the presence of Nec-1 or its derivatives (20 μM each) for 48 h. Cell death was calculated from LDH leakage. (d and e) After treatment of SH-SY5Y cells with RA, RIP3 shRNA was induced by incubation with Dox (2 μg/ml) for 5 days in the presence of BDNF. (d) Dox-treated neuronal cells were incubated with MPP+ (5 mM) for 48 h. Cell death was calculated from LDH leakage. (e) RIP3 and GAPDH were detected by western blotting. The extreme right lane is Jurkat cell lysate (positive control). Data are shown as the mean±S.D. of three independent experiments. NS, not significant; **P<0.01.
Figure 3
Figure 3
Changes of morphology and mitochondrial membrane potential during MPP+-induced cell death. (a) Neuronal SH-SY5Y cells were treated with MPP+ (5 mM) or dimethyl sulfoxide (DMSO) (control) for 40 h in the presence or absence of Nec-1 (20 μM) and subjected to transmission electron microscopy. Scale bar=2 μm (upper photos) or 500 nm (lower photos). (b) Representative TMRM staining to assess the mitochondrial membrane potential in neuronal SH-SY5Y cells. Cells were treated with MPP+ (5 mM) or DMSO (control) in the presence or absence of Nec-1 (20 μM) for 24 h (left) or 48 h (right), stained with TMRM (250 nM), and subjected to confocal fluorescence microscopy. Scale bar=10 μm. (c) Cells were treated with MPP+ (5 mM) for 48 h and Nec-1 (20 μM) was added after 24 h treatment of MPP+. Scale bar=10 μm. (d) Cells were treated with or without MPP+ (5 mM) in the presence or absence of Nec-1 (20 μM). ATP was measured by the CellTiter-Glo cell viability assay at the indicated time. Data are shown as the mean±S.D. of three independent experiments.
Figure 4
Figure 4
MPP+ induces p53-independent cell death, which is blocked by Nec-1 and DIM. (a) Lysates were obtained from WT and p53-deficient neuronal SH-SY5Y cells, which were treated with MPP+ (5 mM) for the indicated time. Then, p53, γH2A.X, and GAPDH were detected by western blotting. (b) WT and p53-deficient neuronal SH-SY5Y cells were treated with MPP+ (5 mM) in the presence of Z-VAD (50 μM), Nec-1 (20 μM), DIM (20 μM), or dimethyl sulfoxide (DMSO) (control) for 48 h. Cell death was calculated from lactate dehydrogenase (LDH) leakage. Data are shown as the mean±S.D. of three independent experiments. NS, not significant; ***P<0.001.
Figure 5
Figure 5
MPP+-induced cell death is inhibited by ferroptosis inhibitors, but not by CsA. (a) Neuronal SH-SY5Y cells were treated for 48 h with MPP+ (5 mM) in the presence of a CypD-dependent cell death inhibitor (CsA, upper left), ferroptosis inhibitors (Fer-1, upper right; DFO, lower left; Trolox, lower right) at the indicated concentrations. Cell death was calculated from lactate dehydrogenase (LDH) leakage. (b) Representative C11-BODIPY staining of lipids in the membrane of WT neuronal SH-SY5Y cells. Red signals indicate non-oxidized lipids and green signals indicate oxidized lipids. Cells were treated with MPP+ (5 mM) in the presence of Nec-1 (20 μM), DIM (20 μM), Fer-1 (2 μM), DFO (100 μM), or dimethyl sulfoxide (DMSO) (control) for 48 h, and subjected to fluorescence microscopy. Scale bar=50 μm. (c) Red and green signals in (b) were quantified by using the Image J software. The lipid peroxidation ratio was calculated as follows: mean value for green signals/(mean value for red signals+mean value for green signals). Each cell field was selected by the minimum error algorithm. (d) WT and p53-deficient neuronal SH-SY5Y cells were treated with MPP+ in the presence or absence of Fer-1 (2 μM) for 48 h. Cell death was calculated from LDH leakage. (e) Representative C11-BODIPY staining of lipids in membrane of p53-deficient neuronal SH-SY5Y cells. Red signals and green signals indicate non-oxidized and oxidized lipids, respectively. Cells were treated with MPP+ (5 mM) in the presence of Nec-1 (20 μM), DIM (20 μM), Fer-1 (2 μM), DFO (100 μM), or DMSO (control) for 48 h, and subjected to fluorescence microscopy. Scale bar=50 μm. (f) Red and green signals in (e) were quantified by using the Image J software. The lipid peroxidation ratio was calculated as follows: mean value for green signals/(mean value for red signals+mean value for green signals). Each cell field was selected by the minimum error algorithm. Data are shown as the mean±S.D. of three independent experiments. **P<0.01; ***P<0.001.
Figure 6
Figure 6
MPP+-induced cell death is enhanced by metal ions. Viability of p53-deficient neuronal SH-SY5Y cells incubated for 48 h with or without MPP+ (0.1 mM) in the presence of Nec-1 (20 μM) or various metal ions (25 μM), including Fe3+ derived from FC, Fe2+ from ferrous sulfate (FS), Zn2+ from zinc nitrate hexahydrate (Zn), Co2+ from cobalt chloride hexahydrate (Co), Ni2+ from nickel sulfate hexahydrate (Ni) and Mn2+ from manganese chloride (Mn). Cell death was calculated from LDH leakage. Data are shown as the mean±S.D. of three independent experiments. **P<0.01.
Figure 7
Figure 7
Analysis of RSL3-induced death of neuronal SH-SY5Y cells. (a) WT neuronal SH-SY5Y cells and (b) p53-deficient neuronal SH-SY5Y cells were incubated for 72 h with RSL3 at the indicated concentrations in the presence of Nec-1 (20 μM), DIM (20 μM), or dimethyl sulfoxide (DMSO) (control). Cell death was calculated from LDH leakage. Data are shown as the mean±S.D. of three independent experiments.

References

    1. Friedlander RM. Apoptosis and caspases in neurodegenerative diseases. N Engl J Med 2003; 348: 1365–1375. - PubMed
    1. Mattson MP. Apoptosis in neurodegenerative disorders. Nat Rev Mol Cell Biol 2000; 1: 120–130. - PubMed
    1. Vila M, Przedborski S. Targeting programmed cell death in neurodegenerative diseases. Nat Rev Neurosci 2003; 4: 365–375. - PubMed
    1. Vandenabeele P, Vanden Berghe T, Festjens N. Caspase inhibitors promote alternative cell death pathways. Sci STKE 2006; 2006: pe44. - PubMed
    1. Shimizu S, Kanaseki T, Mizushima N, Mizuta T, Arakawa-Kobayashi S, Thompson CB et al. Role of Bcl-2 family proteins in a non-apoptotic programmed cell death dependent on autophagy genes. Nat Cell Biol 2004; 6: 1221–1228. - PubMed