. 2017 Mar 2:7:43097.
doi: 10.1038/srep43097.

Salvianolic acid B inhibits mitochondrial dysfunction by up-regulating mortalin

Affiliations

Salvianolic acid B inhibits mitochondrial dysfunction by up-regulating mortalin

Yunxia Liu et al. Sci Rep. .

Abstract

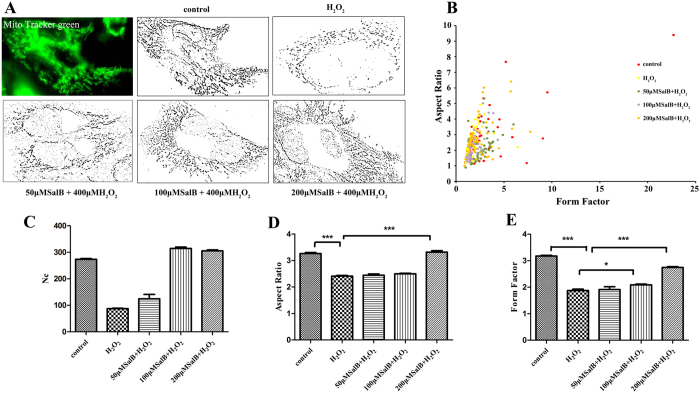
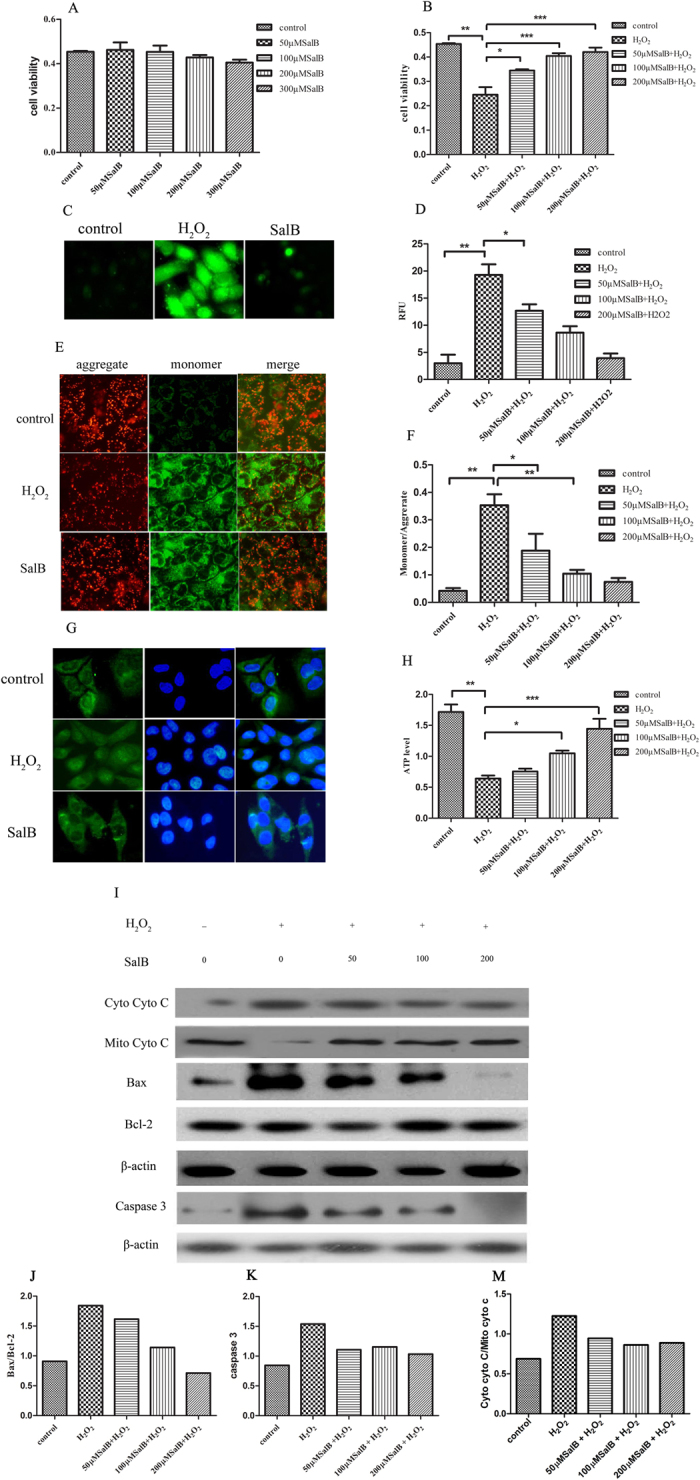
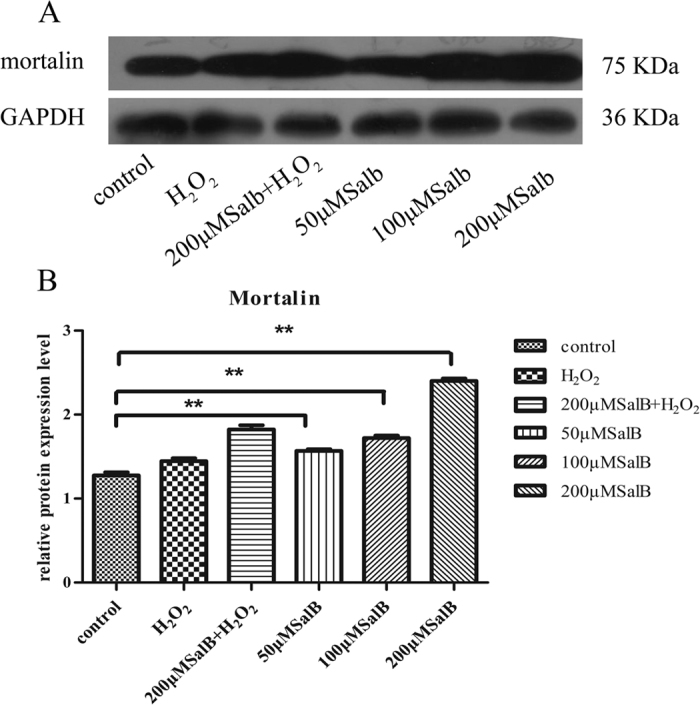
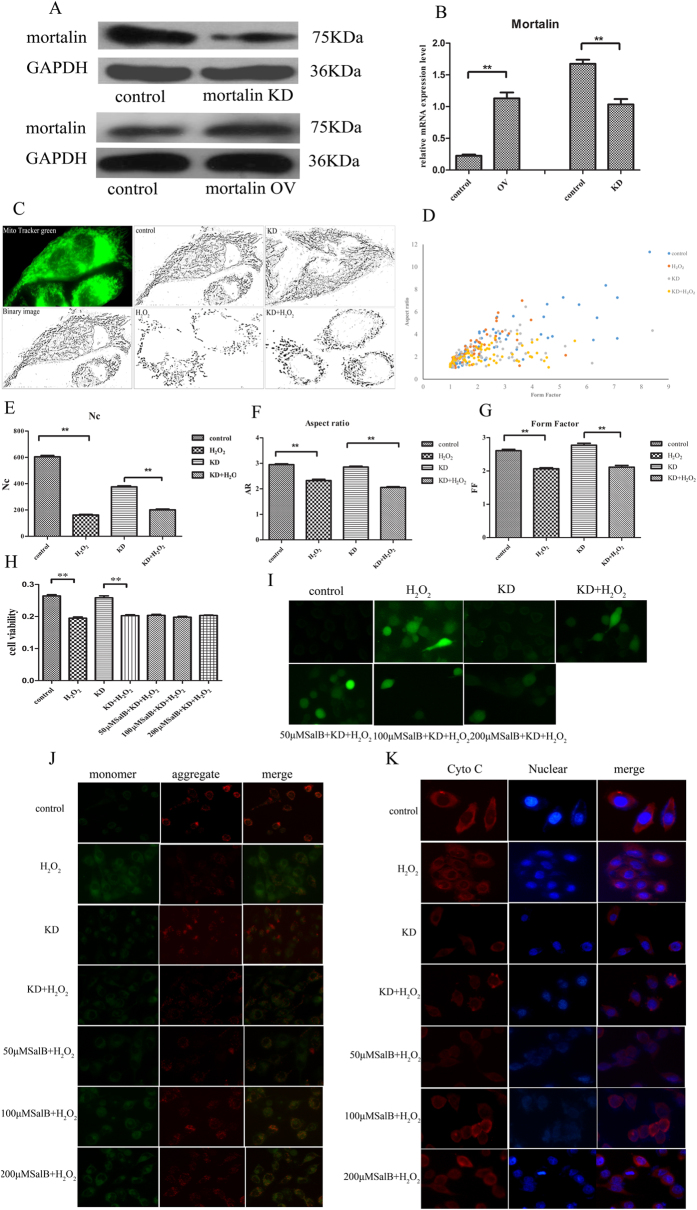
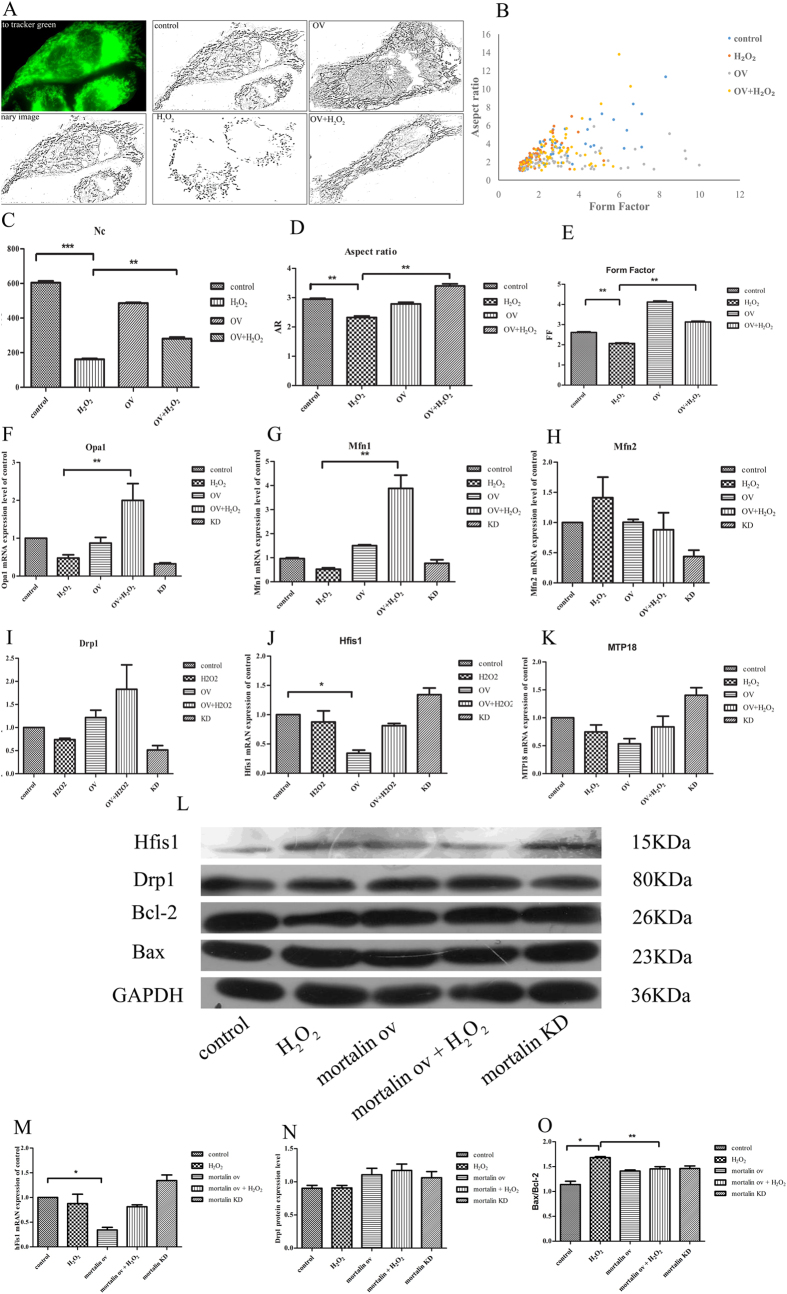
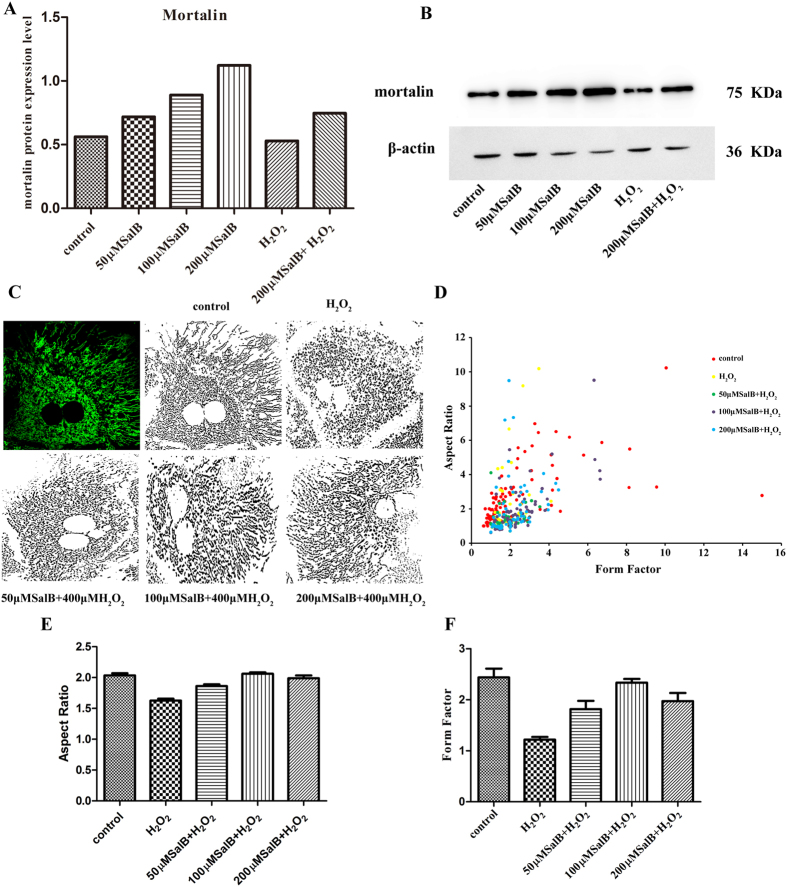
Salvianolic acid B is an antioxidative ingredient derived from Radix Salviae miltiorrhizae that has been widely used to treat liver diseases. However, the therapeutic mechanism underlying Salvianolic acid B has remained largely unknown. Our studies verified that Salvianolic acid B efficiently blocked mitochondrial deformation and dysfunction induced by H2O2 in the human hepatocyte cell line HL7702. Mortalin, a mitochondrial molecular chaperone, maintains mitochondrial morphology stabilization and function integrity. Previous results showed that mortalin overexpression has been observed in hematoma carcinoma cells and that mortalin maintains mitochondrial homeostasis and antagonizes oxidative stress damage. We found that Salvianolic acid B significantly up-regulated mortalin protein expression levels. In addition, Salvianolic acid B lost the function of preventing mitochondrial deformation and dysfunction induced by oxidative stress under mortalin knockdown conditions. We further found that mortalin overexpression increases the mRNA expression of mitofusin-related factor Mfn1 and mitofission-related factor hFis1. In conclusion, Salvianolic acid B maintains the mitochondrial structure stabilization and functional integrity by up-regulating mortalin, which may be associated with increased mitofusin factor Mfn1 and reduced mitofission factor hFis1.


Conflict of interest statement

The authors declare no competing financial interests.

Figures

Figure 1
Figure 1. SalB inhibit mitochondrial deformation induced by H2O2.
(A) Mitochondria from HL-7702 cells in the presence or absence of SalB were labeled with the mitochondrial-specific dye MTG for 30 min at 37 °C and viewed by fluorescence microscopy. Cells grown in normal medium exhibit long, tubular mitochondria; cells treated with H2O2 exhibit short, fragment mitochondria. SalB prevent H2O2-induced fragmentation and exhibit long, tubular mitochondria. (B) The graph depicts FF versus AR values for individual mitochondrion. Mitochondria of cells grown in normal medium have increased FF and AR values corresponding to long, tubular mitochondria. Fragmented mitochondria have reduced FF and AR values, n = 50 mitochondria. (C) The mitochondrial number of cells grown in H2O2 is significantly decreased compared with normal cells. (D,E) As mitochondrial morphological parameters, AR and FF were quantified by Image software. Images from a total of 15 individual cells were analyzed through three independent experiments. *P < 0.05 versus H2O2-treated control.
Figure 2
Figure 2. Effects of SalB on H2O2-induced mitochondrial dysfunction.
(A,B) Cells were treated without or with SalB (50, 100, 200 μM) for 2 h followed by incubation with 400 μM H2O2 for an additional 2 h. After this incubation, cell viability was determined using the MTT assay. Data are expressed as the percentage (%) of the control values as the means ± SEM (n = 6) of representative experiments. (C,D) ROS of 7702 cells pre-incubated by 200 μMSalB for 2 h in the absence or presence of H2O2 (400 μM) were evaluated by the oxidation of H2DCF-DA to DCF. Intracellular ROS were determined by fluorescence microscopy (20×) and flow cytometry. (E,F) Mitochondrial membrane potential was detected by fluorescence microscopy (20×) and flow cytometry using JC-1. (G) Immunofluorescence analyses of cellular cytochrome c location as imaged by fluorescence microscope (20×).(H) Cellular ATP levels were measured using firefly luciferase. (I) Immunoblot shows mitochondrial cytochrome c release to the cytosol induced by H2O2. However, SalB effectively inhibited cytochrome c release from mitochondria. Immunoblot with cell extracts from 7702 cells pretreated with SalB for 2 h prior to exposure to H2O2. The blot shows Bax, Bcl-2 and caspase 3 protein expression levels. The results are expressed as the means ± SEM from three independent experiments (*P < 0.05; **P < 0.01; ***P < 0.001). (J,K) Quantitative results from Western blots. β-actin was used as a loading control.
Figure 3
Figure 3. SalB up-regulates mortalin protein expression.
(A) Immunoblot analysis. SalB increased mortalin expression levels compared with the control. GAPDH was used to normalize protein loading. A representative image of three experiments is presented. Full-length blots are presented in Supplementary Figure 2. (B) Quantity one software analysis of mortalin protein levels. Data are presented as the means ± SEM (n = 3, *P < 0.05).
Figure 4
Figure 4. Mortalin knockdown blocks the protective effects of SalB on mitochondria.
(A) Cells were infected with lentivirus shRNA and transfected with a mortalin-overexpression plasmid. Mortalin protein levels in the knockdown group were remarkably decreased, and mortalin protein levels in the overexpression group were increased. GAPDH was used as an internal control to normalize protein loading. Full-length blots are presented in Supplementary Figure 3. (B) Real-time PCR analysis. Mortalin mRNA expression levels in the knockdown group were significantly decreased, and mortalin mRNA expression in the overexpression group was notably increased (n = 3, ***P < 0.001). Data are normalized as a percentage of the control group and represented as the means ± SEM. (C) Mitochondria from control and mortalin knockdown 7702 cells were labeled with the mitochondrial-specific dye MTG for 30 min at 37 °C and viewed with a fluorescence microscope. Cells grown in normal medium exhibit long, tubular mitochondria. Cells treated with H2O2 exhibit short, fragmented mitochondria. Mortalin knockdown promotes mitochondrial truncation and fragmentation under H2O2 treatment. (D) The number of mitochondria in cells grown in H2O2 is significantly decreased compared with normal cells; mortalin knockdown decrease Nc with or without H2O2. (E,F) As mitochondrial morphological parameters, AR and FF were quantified by ImageJ software. Images from total 15 individual cells were analyzed through three independent experiments. *P < 0.05 versus H2O2-treated control. (G) The graph depicts FF and AR values for individual mitochondrion. Mitochondria of cells grown in normal medium have increased FF and AR values corresponding to long, tubular mitochondria. Fragmented mitochondria have reduced FF and AR values. n = 50 mitochondria. (H) Mortalin-knockdown cells were treated without or with SalB (50, 100, 200 μM) for 2 h followed by treatment with 400 μM H2O2 for an additional 2 h. After this incubation, cell viability was determined by the MTT assay. Data are expressed as the percentage (%) of control values, which are means ± SEM (n = 6) of representative experiments. (I) Cellular ROS were measured by a fluorescence microscope using H2DCF-DA dye. (J) Mitochondrial membrane potential was determined using JC-1 dye. (K) Immunofluorescence analysis of cellular cytochrome c location.
Figure 5
Figure 5. Effects of mortalin overexpression on mitochondrial fission and fusion.
(A) Mitochondria from control and mortalin-overexpression HL-7702 cells were labeled with the mitochondrial-specific dye MTG for 30 min at 37 °C and viewed with a fluorescence microscope. Cells grown in normal medium exhibit long, tubular mitochondria. Cells treated with H2O2 exhibit short, fragmented mitochondria. Mortalin overexpression inhibited mitochondrial truncation and fragmentation under H2O2 treatment. (B) The number of mitochondria in cells grown in H2O2 is significantly decreased compared with normal cells. (C,D) As mitochondrial morphological parameters, AR and FF were quantified by ImageJ software. Images from 15 individual cells were analyzed inthree independent experiments. *P < 0.05 versus H2O2-treated control. (E) The graph presents FF and AR values for individual mitochondrion. Mitochondria of cells grown in normal medium have increased FF and AR values corresponding to long, tubular mitochondria. Fragmented mitochondria have reduced FF and AR values. n = 50 mitochondria. (FK) Real time PCR was used to analysis mitochondrial fusion factors Mfn1, Mfn2, and Opa1 and mitochondrial fission factors hFis1, Drp1 and MTP18. These factors were normalized to GAPDH mRNA expression. Three independent experiments are presented. Data are normalized as a percentage of the control group and represent means ± SEM, *P < 0.05 versus control group, n = 3. (L) Western blot analysis of hFis1, Mfn2, Bax, Bcl-2 levels in HL-7702 cell treatment with different concentration of SalB, SalB increased hFis1 protein level and inhibited Mfn2 protein expression. Full-length blots are presented in Supplementary Figure 4. (MO) Quantitative results from Western blots. GAPDH was used as a loading control (*P < 0.05; **P < 0.01).
Figure 6
Figure 6. SalB banlances mitochondrial fusion-fission through up-regulate mortalin in primary hepatocyte.
(A) Western blot analysis showed the expression of mortalin was higher in SalB treated groups compare to control group. β-actin was used to normalize protein loading. The representative of three experiments was shown. Full-length blots are presented in Supplementary Figure 5. (B) Quantitative results from Western blots (n = 3, *P < 0.05). (C) Confocal fluorescence microscope (60×) images showed that treatment with H2O2 induced mitochondrial fission, while pretreatment with 50, 100, 200 μM SalB can inhibit mitochondrial structure instability induced by H2O2. (D) The values of FF versus AR for individual mitochondrion, n = 50. (E,F) AR and FF were mitochondrial morphological parameters, treatment with SalB augmented AR and FF values, which means increased number of long tubular mitochondria. Images from a total of 15 individual cells were analyzed through three independent experiments, *P < 0.05.

References

    1. Sanchez-Valle V., Chavez-Tapia N. C., Uribe M. & Mendez-Sanchez N. Role of oxidative stress and molecular changes in liver fibrosis: a review. Curr Med Chem. 19, 4850–4860 (2012). - PubMed
    1. Mormone E., George J. & Nieto N. Molecular pathogenesis of hepatic fibrosis and current therapeutic approaches. Chem Biol Interact. 193, 225–231 (2011). - PMC - PubMed
    1. Tian L. L. et al.. Salvianolic acid B, an antioxidant from Salvia miltiorrhiza, prevents 6-hydroxydopamine induced apoptosis in SH-SY5Y cells. Int J Biochem Cell Biol. 40, 409–422 (2008). - PubMed
    1. Friedman S. L. Liver fibrosis - from bench to bedside. J Hepatol. 38, S38–S53 (2003). - PubMed
    1. Cui L. et al.. Salvianolic Acid B Prevents Bone Loss in Prednisone-Treated Rats through Stimulation of Osteogenesis and Bone Marrow Angiogenesis. PloS One 7, e34647, doi: 10.1371/journal.pone.0034647 (2012). - DOI - PMC - PubMed

Publication types