. 2017 Mar 2:8:14613.
doi: 10.1038/ncomms14613.

Evolution of complexity in the zebrafish synapse proteome

Affiliations

Evolution of complexity in the zebrafish synapse proteome

Àlex Bayés et al. Nat Commun. .

Abstract

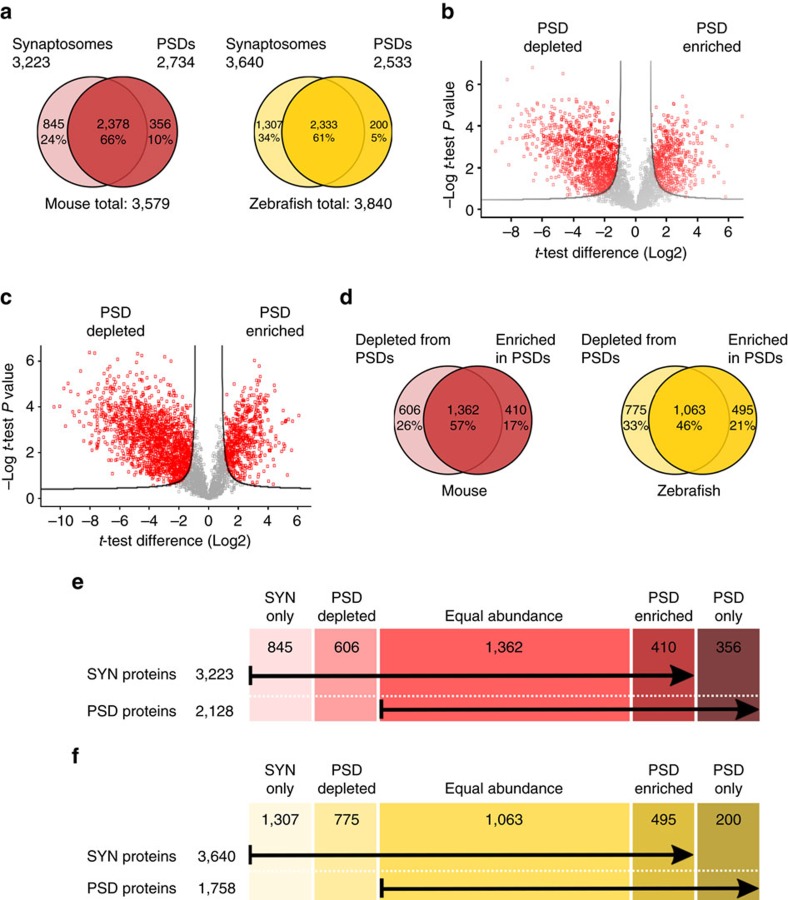
The proteome of human brain synapses is highly complex and is mutated in over 130 diseases. This complexity arose from two whole-genome duplications early in the vertebrate lineage. Zebrafish are used in modelling human diseases; however, its synapse proteome is uncharacterized, and whether the teleost-specific genome duplication (TSGD) influenced complexity is unknown. We report the characterization of the proteomes and ultrastructure of central synapses in zebrafish and analyse the importance of the TSGD. While the TSGD increases overall synapse proteome complexity, the postsynaptic density (PSD) proteome of zebrafish has lower complexity than mammals. A highly conserved set of ∼1,000 proteins is shared across vertebrates. PSD ultrastructural features are also conserved. Lineage-specific proteome differences indicate that vertebrate species evolved distinct synapse types and functions. The data sets are a resource for a wide range of studies and have important implications for the use of zebrafish in modelling human synaptic diseases.


Conflict of interest statement

The authors declare no competing financial interests.

Figures

Figure 1
Figure 1. Transmission electron microscopy of zebrafish asymmetric synapses in four different brain areas.
(a) Evolutionary tree of the vertebrate lineage with timescale in million years (my). The occurrence of the two WGD events common to all vertebrates (2R-WGD) and specific to teleosts (TSGD) are indicated by blue lines. (b) Schematic representation of the zebrafish brain with the four regions studied (CC, cerebellar corpus; O, olfactory bulb; OT, optic tectum; T, telencephalon) and of an excitatory synapse. Synaptosomes are formed by the axon terminal and the dendritic spine, which are separated from their corresponding neurons during tissue processing. The location of the PSD is also indicated. (c) Asymmetric synapse from the olfactory bulb. A red asterisk and a red arrow indicate the location of presynaptic vesicles and the PSD, respectively. Scale bar, 200 nm. (d) An asymmetric dendrodendritic synapse of the olfactory bulb (framed by a red dotted square) is shown. Asterisks indicate pre- and post-synaptic vesicles. The PSD is indicated by a red arrow. Scale bar, 500 nm. (e) Asymmetric synapses from the telencephalon. Red asterisks and arrows indicate the location of presynaptic vesicles and PSDs, respectively. The area corresponding to postsynaptic spine-like structures is filled with pink. Scale bar, 500 nm. (f) Asymmetric synapses from the optic tectum. Red asterisks and arrows indicate the location of presynaptic vesicles and the PSD, respectively. Red arrowheads indicate microtubule location within thin dendritic-like projection. The area of a thin dendritic-like projection, where synapses are formed, is filled with purple. Scale bar, 500 nm. (g) Flat (standard) asymmetric synapse from the cerebellar corpus. A red asterisk and a red arrow indicate the location of presynaptic vesicles and the PSD, respectively. Scale bar, 500 nm. (h) Asymmetric synapse from the medial part of the cerebellar corpus showing the extent at which the presynaptic element (highlighted in purple) surrounds the dendritic spine. Scale bar, 200 nm. (i) Micrograph displaying the morphology of most abundant asymmetric synapses from the cerebellar corpus. Red asterisks and arrows indicate the location of presynaptic vesicles and the PSD, respectively. Scale bar, 500 nm.
Figure 2
Figure 2. Mouse and zebrafish synaptic proteome.
(a) Venn diagrams of mouse (red) and zebrafish (yellow) proteins identified in synaptosomal and PSD preparations, indicating the percentage of proteins found in both fractions. The total number of proteins identified in each species is also indicated. (b,c) Volcano plots showing quantitative enrichment and depletion of proteins between synaptosomes and postsynaptic densities purified from mouse (b) and zebrafish brain (c). Enriched or depleted proteins were identified from statistical analysis of triplicate PSD and synaptosome data sets for each species using t-testing and a Permutation-based false discovery rate of 0.05. (d) Venn diagrams of mouse (red) and zebrafish (yellow) proteins found depleted or enriched in the PSD when compared with the synaptosomal fraction. The percentage of proteins found with equal abundance at the synaptosomal and PSD fraction is also indicated. (e) Scheme indicating the number of mouse synaptosomal and PSD proteins found only in one of the two fractions, depleted or enriched at the PSD or found in equal abundance in both fractions. (f) Scheme indicating the number of zebrafish synaptosomal and PSD proteins found only in one of the two fractions, depleted or enriched at the PSD or found in equal abundance in both fractions.
Figure 3
Figure 3. Expansion and retention of synaptic proteins after teleost-specific whole-genome duplication.
(a) Cumulative frequency plot of proteins found per Ensemble Family among mouse, zebrafish and mouse orthologues of zebrafish SYN proteins. Kruskal–Wallis test was used to calculate significance between distributions (**P<0.01 and ***P<0.0001). (b) Cumulative frequency plot of proteins found per Ensembl Family among mouse, zebrafish and mouse orthologues of zebrafish PSD proteins. Kruskal–Wallis test was used to calculate significance between distributions (**P<0.01 and ***P<0.0001). (c) Distribution of orthology types between zebrafish and mouse. For each protein in the proteome, the corresponding gene was identified and orthologous genes between species were determined using the biomaRt bioconductor package. For each gene the zebrafish:mouse ratio of orthologues was determined and characterized as 1:1, 1:many, many:1, many:many or was unique to mouse or zebrafish. (d) Density of proteome by orthologue ratio (zebrafish:mouse). Statistically significant comparisons between pairs of distributions (two-tailed Kolmogorov–Smirnov test applied to distributions) are shown. ***P<0.001 and *P<0.05; nonsignificant comparisons are not shown. (e) A heatmap representation of homologue ratio between mouse and each species for key synaptic gene families. For each gene family and species the homologues of mouse genes were identified using the biomaRt bioconductor package. Colours represent the relative expansion (yellow–green) or reduction (red) of gene families compared to the size seen in mouse. Orange represents a 1:1 ratio where family size is equal in mouse and other species. Dendrograms show the similarity of species and gene families.
Figure 4
Figure 4. Functional similarity between mouse and zebrafish synaptic proteomes.
(a) Fraction of mouse (red) and zebrafish (yellow) synaptic proteins annotated to IPA cell location categories. (b) Fraction of mouse (red) and zebrafish (yellow) synaptic proteins annotated to IPA molecular function categories. (c) Overlap between Biological Process and Molecular Function GO-slim terms and PANTHER Protein Classes enriched in mouse and zebrafish. Top row shows data for synaptosomes and bottom row for PSD proteomes. The exact percentage of overlap is indicated. (d) Cumulative frequency distribution plots of individual protein innovation index (number of unique domain types per protein) for each proteome in mouse. Statistically significant comparisons between pairs of distributions (two-tailed Kolmogorov–Smirnov test applied to distributions) are shown at the legend. ***P<0.001, **P<0.01, *P<0.05; nonsignificant comparisons are not shown. (e) Cumulative frequency distribution plots of individual protein innovation index (number of unique domain types per protein) for each proteome in zebrafish. Statistically significant comparisons between pairs of distributions (two-tailed Kolmogorov–Smirnov test applied to distributions) are shown at the legend. ***P<0.001, **P<0.01, *P<0.05; nonsignificant comparisons are not shown.
Figure 5
Figure 5. Differential expression of PSD proteins involved in intracellular vesicle biogenesis between mouse and zebrafish.
For each protein the mouse orthologue gene name is given. Proteomic data are provided for both species. For proteomic data, a white square denotes that we did not detect that protein, a blue square identifies proteins found in synaptosomes but not in PSDs and a red square identifies proteins found at the PSD. The average mRNA expression (mean transcripts per million (TPM) from four whole-brain biological replicates) was determined for each gene (for TPMs of individual samples, see Supplementary Fig. 10). For mRNA-sequencing data, a white box denotes a mean expression of <1 TPM, a pale green box <10 TPM and dark green >10 TPM. (a) Proteins involved in vesicle fusion with membranes, including SNARE complex proteins: Syntaxins, Vamps and SNAPs, syntaxin-binding proteins (Sec1/Munc18) and Synaptotagmins. (b) Proteins form the HOPS complex involved in membrane vesicle tethering to membranes. (c) Proteins involved in membrane bending/budding and scission to form vesicles, including proteins from ESCRT complexes (ESCRT I, II, III and Vps4-Vta1/ALIX), Dynamins and small GTPases from the Rab family.
Figure 6
Figure 6. Conservation of the core vertebrate PSD machinery.
(a) Pie chart of main GO-Slim Molecular Function categories enriched among vPSD proteins. (b) Box plots for the percentage of protein identity since the last common ancestor between zebrafish and mouse of zebrafish PSD proteins, PSD components found in both species (vPSD), Zf-sPSD and a zebrafish brain proteome. Distributions compared using the Mann–Whitney U-test (***P<0.001). (c) Box plots for the percentage of protein identity since the last common ancestor between zebrafish and mouse of mouse PSD proteins, PSD components found in both species (vPSD), Mm-sPSD and a mouse brain proteome. Distributions compared using the Mann–Whitney U-test (***P<0.001). (d) Percentage of protein identity for individual proteins found only in zebrafish PSD (yellow), in both species PSD (white) and only in mouse PSD (red). Red lines represent the median percentage of protein identity for two zebrafish (a (ref. 29) and b (ref. 28)) and a mouse (c (ref. 26)) whole-brain proteomes.

References

    1. Bayés A. & Grant S. G. N. Neuroproteomics: understanding the molecular organization and complexity of the brain. Nat. Rev. Neurosci. 10, 635–646 (2009). - PubMed
    1. Nithianantharajah J. et al.. Synaptic scaffold evolution generated components of vertebrate cognitive complexity. Nat. Neurosci. 16, 16–24 (2013). - PMC - PubMed
    1. Ryan T. J. et al.. Evolution of GluN2A/B cytoplasmic domains diversified vertebrate synaptic plasticity and behavior. Nat. Neurosci. 16, 25–32 (2013). - PMC - PubMed
    1. Dieterich D. C. & Kreutz M. R. Proteomics of the synapse—a quantitative approach to neuronal plasticity. Mol. Cell Proteomics 15, 368–381 (2015). - PMC - PubMed
    1. Bayés A. et al.. Characterization of the proteome, diseases and evolution of the human postsynaptic density. Nat. Neurosci. 14, 19–21 (2011). - PMC - PubMed

Publication types

MeSH terms