. 2017 Mar 2:7:43522.
doi: 10.1038/srep43522.

A proliferative probiotic Bifidobacterium strain in the gut ameliorates progression of metabolic disorders via microbiota modulation and acetate elevation

Affiliations

A proliferative probiotic Bifidobacterium strain in the gut ameliorates progression of metabolic disorders via microbiota modulation and acetate elevation

Ryo Aoki et al. Sci Rep. .

Abstract

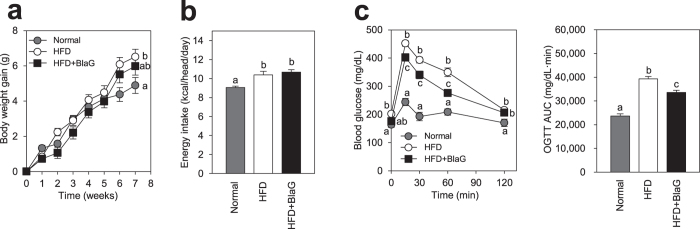
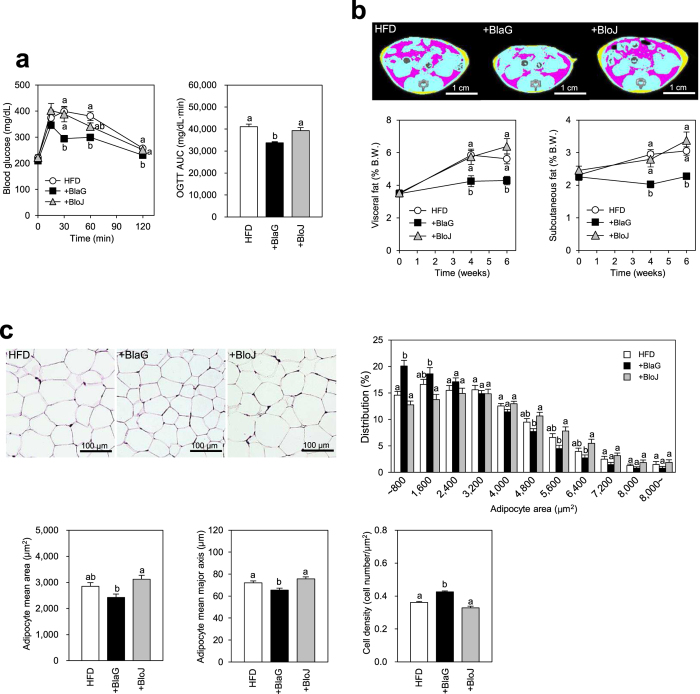
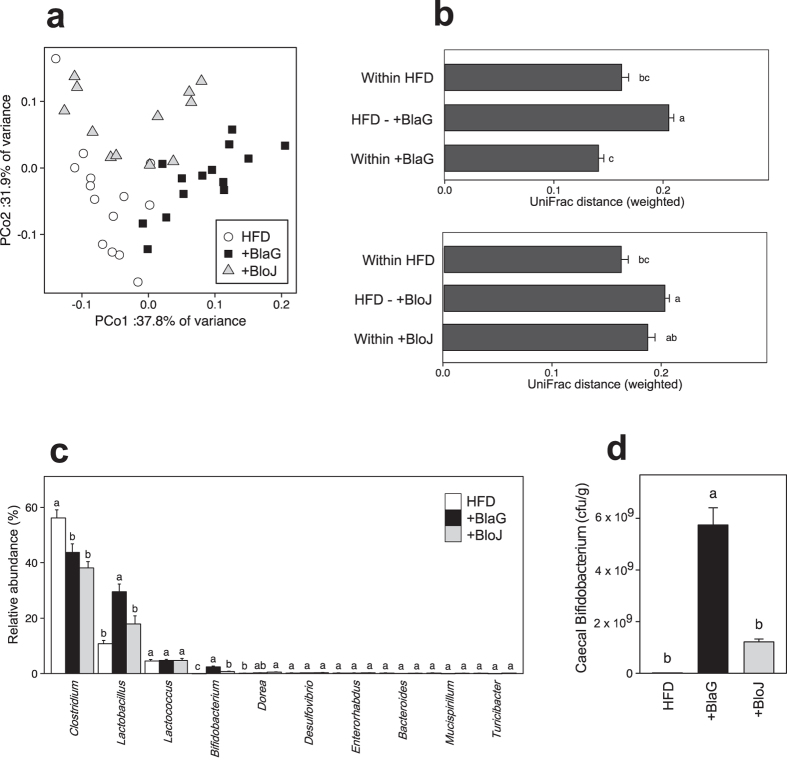
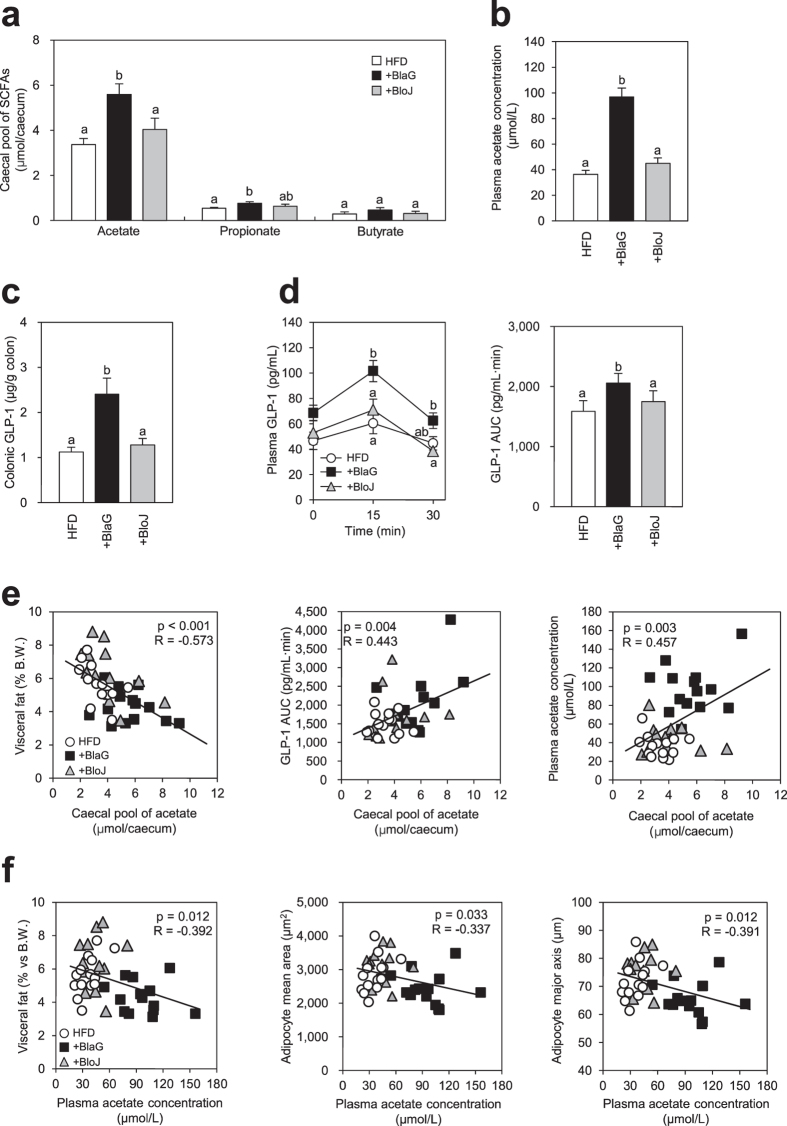
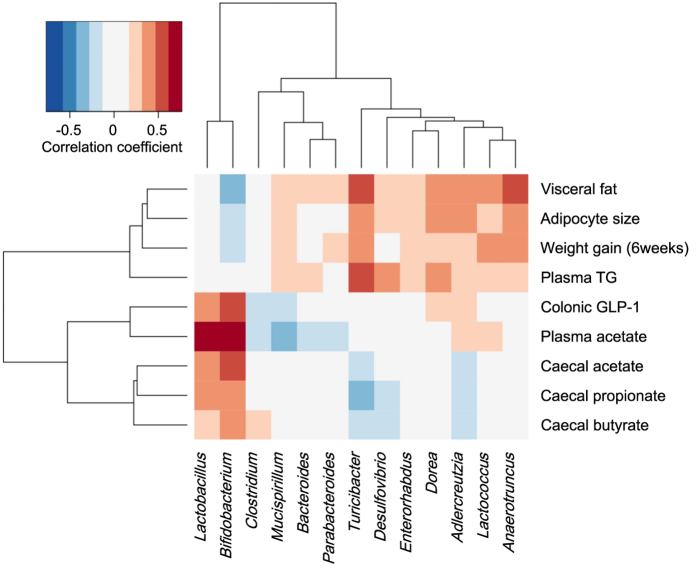
The gut microbiota is an important contributor to the worldwide prevalence of metabolic syndrome (MS), which includes obesity and diabetes. The anti-MS effects exerted by Bifidobacterium animalis ssp. lactis GCL2505 (BlaG), a highly proliferative Bifidobacterium strain in the gut, and B. longum ssp. longum JCM1217T (BloJ) were comparatively examined. BlaG treatment reduced visceral fat accumulation and improved glucose tolerance, whereas BloJ had no effect on these parameters. Gut microbial analysis revealed that BlaG exerted stronger effects on the overall bacterial structure of the gut microbiota than BloJ, including enrichment of the genus Bifidobacterium. The levels of acetate and glucagon-like peptide-1 were increased by BlaG treatment in both the gut and plasma, but not by BloJ treatment. Correlation analysis suggested that the elevation of gut acetate levels by BlaG treatment plays a pivotal role in the BlaG-induced anti-MS effects. These findings indicated that BlaG, a highly viable and proliferative probiotic, improves metabolic disorders by modulating gut microbiota, which results in the elevation of SCFAs, especially acetate.


Conflict of interest statement

The authors declare no competing financial interests.

Figures

Figure 1
Figure 1. Bifidobacterium animalis ssp. lactis GCL2505 (BlaG) treatment improved glucose tolerance in mice fed a high-fat diet (Experiment 1).
(a) Body weight gain. (b) Daily energy intake. (c) Blood glucose levels and the area under the curve after oral glucose challenge (2 g/kg body weight) at 6 weeks of the BlaG treatment. Data represent the mean ± SEM. Statistical analyses were performed using the Tukey–Kramer multiple comparison test. Different letters next to bars indicate a significant difference (P < 0.05).
Figure 2
Figure 2. Comparison of the BlaG treatment and Bifidobacterium longum JCM1217T (BloJ) treatment to improve glucose tolerance and body fat accumulation in HFD mice (Experiment 2).
(a) Blood glucose levels and the area under the curve after oral glucose challenge (2 g/kg body weight) after the bifidobacteria treatment for 6 weeks. (b) Representative computed tomography (CT) images after 6 weeks of probiotic treatments and serial assessment of CT-estimated proportions of visceral and subcutaneous fat weight to body weight after 0–6 weeks of probiotic treatment. The pink and yellow areas in CT images represent the visceral and subcutaneous fat, respectively. (c) Representative epididymal fat tissue staining, cell area distribution, mean area, mean major axis, and cell density of epididymal adipocytes after 7 weeks of bifidobacteria treatments. Data represent the mean ± SEM. Statistical analyses were performed using the Tukey–Kramer multiple comparison test. Different letters next to bars indicate a significant difference (P < 0.05).
Figure 3
Figure 3. Analysis of the microbiota in the contents of the caecum.
(a) Principal coordinate analysis plot generated using a weighted UniFrac metric. The two components explained 69.7% of the variance. (b) Weighted UniFrac distance metric in the HFD-fed control, the BlaG-treated, and the BloJ-treated groups. (c) Bacterial composition at the genus level in the samples. For genus-level assignment of 16 S reads (16 S rRNA gene V1–V2 region), a 94% sequence identity threshold was applied. The vertical axis represents the relative abundance (%) of each genus in the microbiota. (d) The number of Bifidobacterium in caecal samples quantified by quantitative polymerase chain reaction. Data represent the mean ± SEM. Tukey–Kramer multiple comparison test was used. Different letters next to bars indicate a significant difference (P < 0.05).
Figure 4
Figure 4. Effect of bifidobacteria treatment on short-chain fatty acid (SCFA) levels, glucagon-like peptide-1 (GLP-1) secretion, and the correlation between the two variables.
(a) SCFA levels in the caecum after 7 weeks of probiotic treatments. (b) Plasma acetate concentration. (c) Colonic GLP-1 levels measured using enzyme-linked immunosorbent assay. (d) Plasma GLP-1 levels and the area under the curve 0–30 min after oral glucose challenge in mice fed a high-fat diet with 6 weeks of probiotic treatments. (e) Correlation analysis between caecal acetate levels and visceral fat accumulation, plasma acetate levels and GLP-1 levels. (f) Correlation analysis between plasma acetate levels and visceral fat accumulation and adipocyte size. Pearson’s R correlation and corresponding P value are presented. Data represent the mean ± SEM. Tukey–Kramer multiple comparison test was used to assess the differences between the groups. Different letters next to bars indicate a significant difference (P < 0.05).
Figure 5
Figure 5. Correlation between the relative abundance of genera and metabolic parameters in mice.
Pearson’s correlation coefficients are represented by colour ranging from blue (negative correlation, −1) to red (positive correlation, 1). Data on genus reads used for the analysis represented 73.7% of the total reads of microbiota.

References

    1. Ley R. E., Turnbaugh P. J., Klein S. & Gordon J. I. Microbial ecology: Human gut microbes associated with obesity. Nature 444, 1022–1023 (2006). - PubMed
    1. Cani P. D. et al. Metabolic endotoxemia initiates obesity and insulin resistance. Diabetes 56, 1761–1772 (2007). - PubMed
    1. Cani P. D. et al. Changes in gut microbiota control metabolic endotoxemia-induced inflammation in high-fat diet-induced obesity and diabetes in mice. Diabetes 57, 1470–1481 (2008). - PubMed
    1. Cani P. D. et al. Changes in gut microbiota control inflammation in obese mice through a mechanism involving GLP-2-driven improvement of gut permeability. Gut 58, 1091–1103 (2009). - PMC - PubMed
    1. Neyrinck A. M. et al. Wheat-derived arabinoxylan oligosaccharides with prebiotic effect increase satietogenic gut peptides and reduce metabolic endotoxemia in diet-induced obese mice. Nutr. Diabetes 2, e28 (2012). - PMC - PubMed