

Altered gene expression and repressed markers of autophagy in skeletal muscle of insulin resistant patients with type 2 diabetes
- PMID: 28252104
- PMCID: PMC5333153
- DOI: 10.1038/srep43775
Altered gene expression and repressed markers of autophagy in skeletal muscle of insulin resistant patients with type 2 diabetes
Abstract
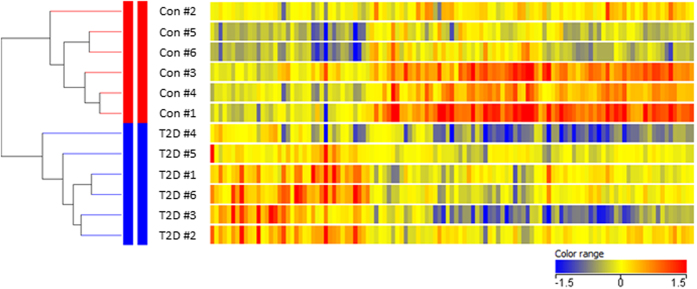
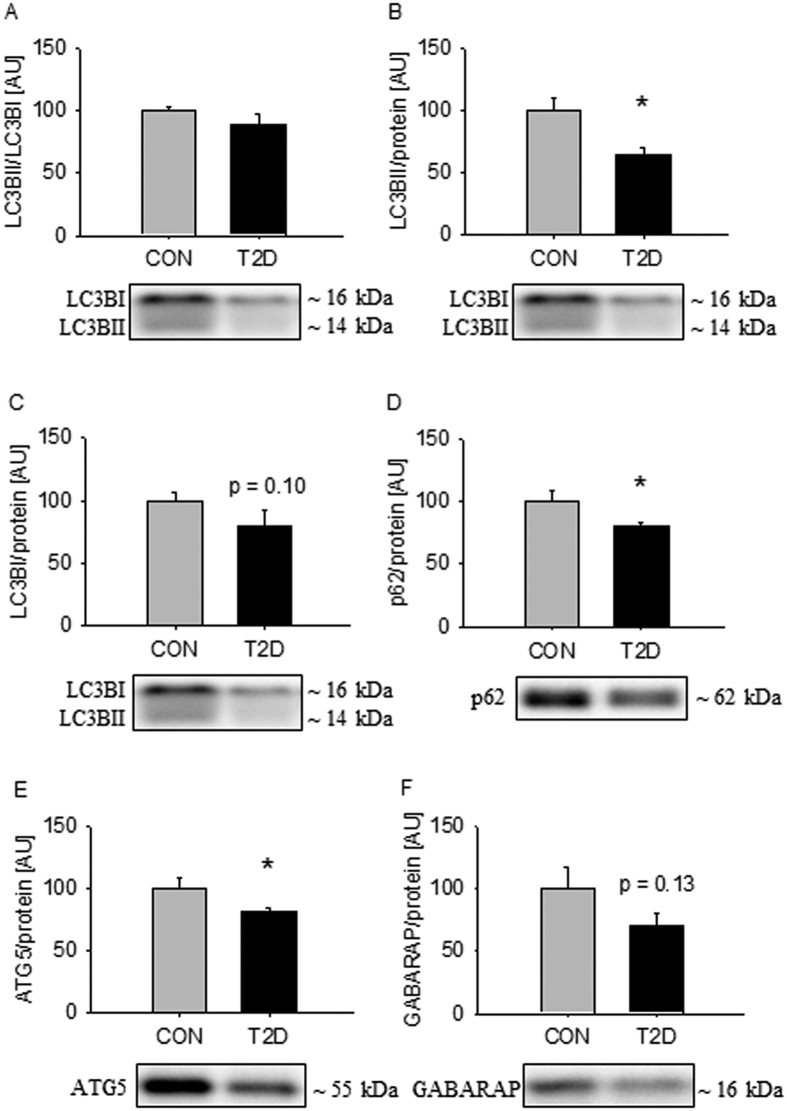
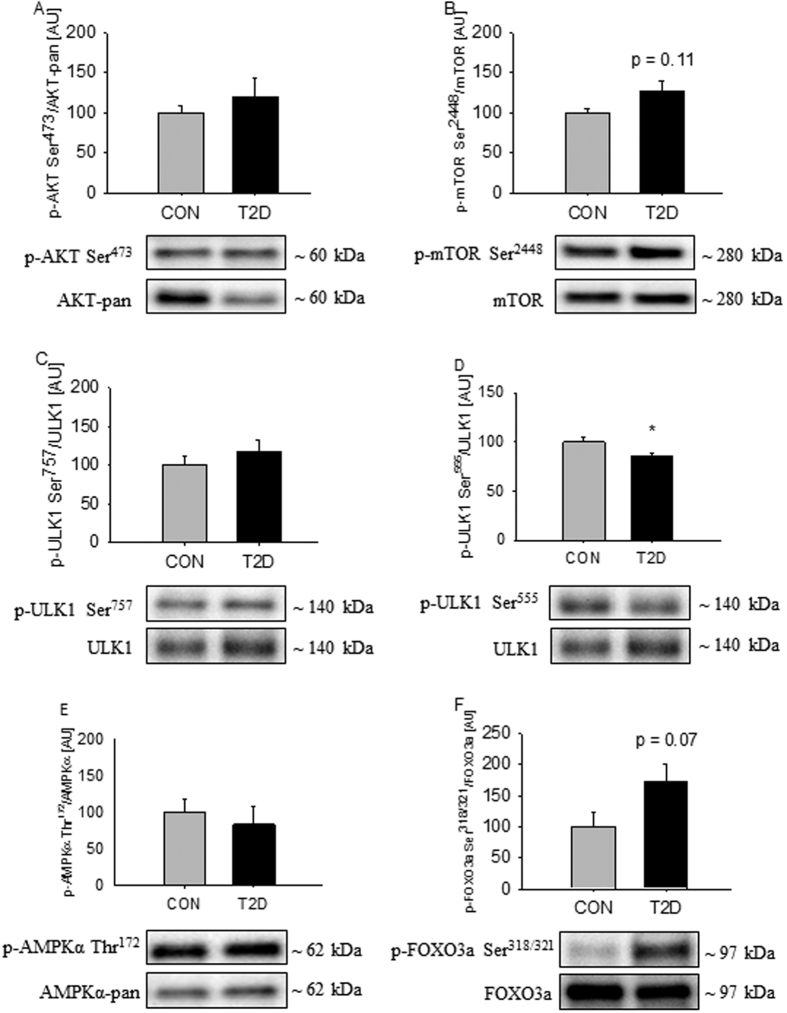
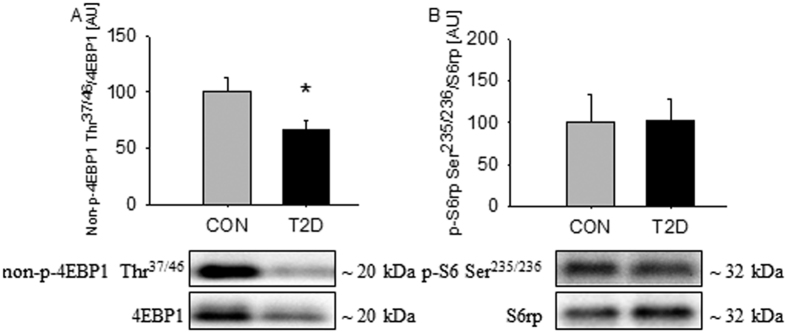
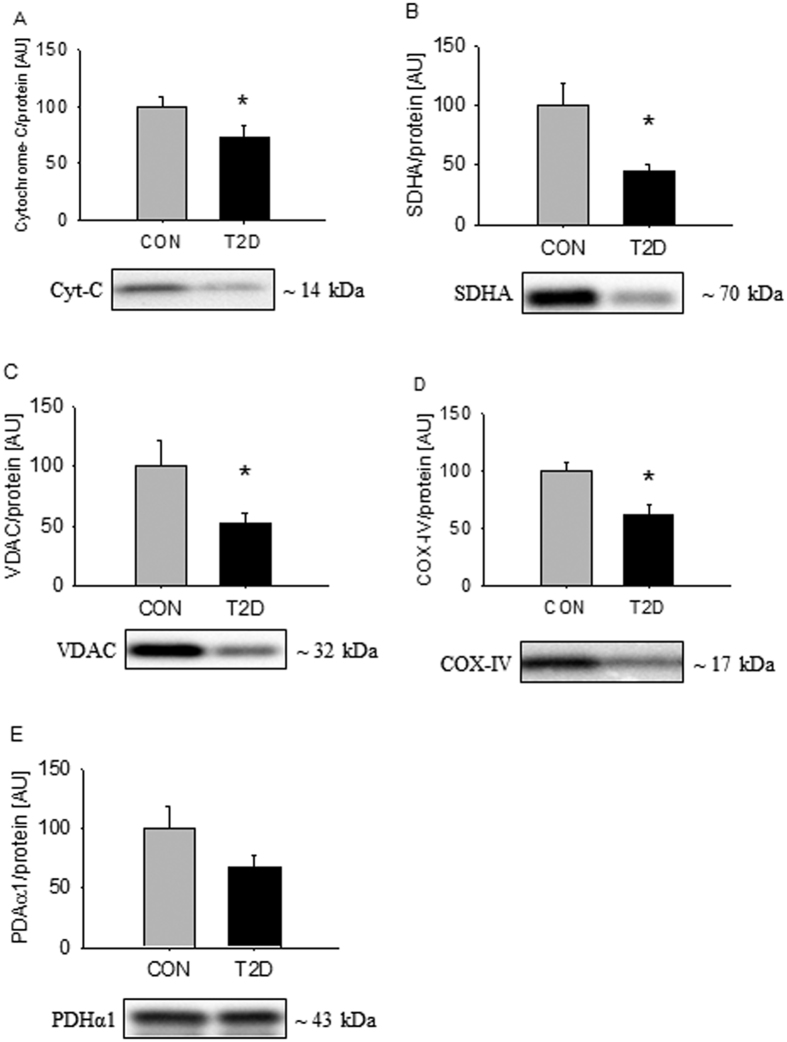
This case-control study was designed to investigate the gene expression profile in skeletal muscle from severely insulin resistant patients with long-standing type 2 diabetes (T2D), and to determine associated signaling pathways. Gene expression profiles were examined by whole transcriptome, strand-specific RNA-sequencing and associated signaling was determined by western blot. We identified 117 differentially expressed gene transcripts. Ingenuity Pathway Analysis related these differences to abnormal muscle morphology and mitochondrial dysfunction. Despite a ~5-fold difference in plasma insulin, we did not observe any difference in phosphorylation of AKT or AS160, although other insulin-sensitive cascades, as mTOR/4EBP1, had retained their sensitivity. Autophagy-related gene (ATG14, RB1CC1/FIP200, GABARAPL1, SQSTM1/p62, and WIPI1) and protein (LC3BII, SQSTM1/p62 and ATG5) expression were decreased in skeletal muscle from the patients, and this was associated with a trend to increased phosphorylation of the insulin-sensitive regulatory transcription factor FOXO3a. These data show that gene expression is highly altered and related to mitochondrial dysfunction and abnormal morphology in skeletal muscle from severely insulin resistant patients with T2D, and that this is associated with decreased expression of autophagy-related genes and proteins. We speculate that prolonged treatment with high doses of insulin may suppress autophagy thereby generating a vicious cycle maintaining insulin resistance.
Conflict of interest statement
The authors declare no competing financial interests.
Figures
Similar articles
-
Markers of autophagy are adapted to hyperglycaemia in skeletal muscle in type 2 diabetes.Diabetologia. 2015 Sep;58(9):2087-95. doi: 10.1007/s00125-015-3654-0. Epub 2015 Jun 7. Diabetologia. 2015. PMID: 26048236
-
Intact initiation of autophagy and mitochondrial fission by acute exercise in skeletal muscle of patients with Type 2 diabetes.Clin Sci (Lond). 2017 Jan 1;131(1):37-47. doi: 10.1042/CS20160736. Epub 2016 Nov 11. Clin Sci (Lond). 2017. PMID: 27837193
-
Regulation of Akt-mTOR, ubiquitin-proteasome and autophagy-lysosome pathways in response to formoterol administration in rat skeletal muscle.Int J Biochem Cell Biol. 2013 Nov;45(11):2444-55. doi: 10.1016/j.biocel.2013.07.019. Epub 2013 Aug 2. Int J Biochem Cell Biol. 2013. PMID: 23916784
-
Metabolism and insulin signaling in common metabolic disorders and inherited insulin resistance.Dan Med J. 2014 Jul;61(7):B4890. Dan Med J. 2014. PMID: 25123125 Review.
-
Skeletal Muscle Insulin Resistance as a Precursor to Diabetes: Beyond Glucoregulation.Curr Diabetes Rev. 2018;14(2):113-128. doi: 10.2174/1573399813666161122123636. Curr Diabetes Rev. 2018. PMID: 27875947 Review.
Cited by
-
Interactive contribution of hyperinsulinemia, hyperglycemia, and mammalian target of rapamycin signaling to valvular interstitial cell differentiation and matrix remodeling.Front Cardiovasc Med. 2022 Oct 31;9:942430. doi: 10.3389/fcvm.2022.942430. eCollection 2022. Front Cardiovasc Med. 2022. PMID: 36386326 Free PMC article.
-
Autophagy, apoptosis, and mitochondria: molecular integration and physiological relevance in skeletal muscle.Am J Physiol Cell Physiol. 2019 Jul 1;317(1):C111-C130. doi: 10.1152/ajpcell.00261.2018. Epub 2019 Apr 24. Am J Physiol Cell Physiol. 2019. PMID: 31017800 Free PMC article.
-
Roles of Autophagy in Oxidative Stress.Int J Mol Sci. 2020 May 6;21(9):3289. doi: 10.3390/ijms21093289. Int J Mol Sci. 2020. PMID: 32384691 Free PMC article. Review.
-
Key considerations for investigating and interpreting autophagy in skeletal muscle.Autophagy. 2024 Oct;20(10):2121-2132. doi: 10.1080/15548627.2024.2373676. Epub 2024 Jul 15. Autophagy. 2024. PMID: 39007805 Free PMC article. Review.
-
Ablation of dynamin-related protein 1 promotes diabetes-induced synaptic injury in the hippocampus.Cell Death Dis. 2021 May 5;12(5):445. doi: 10.1038/s41419-021-03723-7. Cell Death Dis. 2021. PMID: 33953167 Free PMC article.
References
Publication types
MeSH terms
Substances
LinkOut - more resources
Full Text Sources
Other Literature Sources
Medical
Molecular Biology Databases
Research Materials
Miscellaneous
