. 2017 Mar 2:7:43509.
doi: 10.1038/srep43509.

A pharmacological approach in newly established retinal vein occlusion model

Affiliations

A pharmacological approach in newly established retinal vein occlusion model

Shinichiro Fuma et al. Sci Rep. .

Abstract

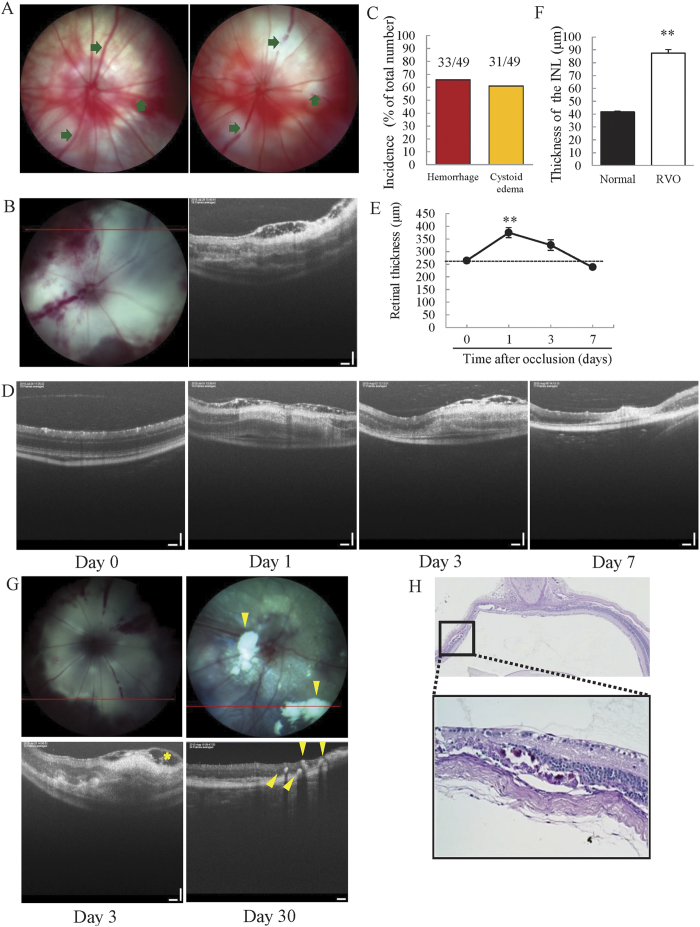
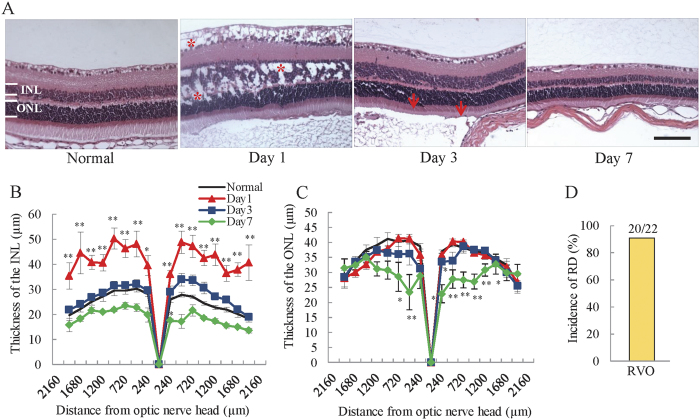
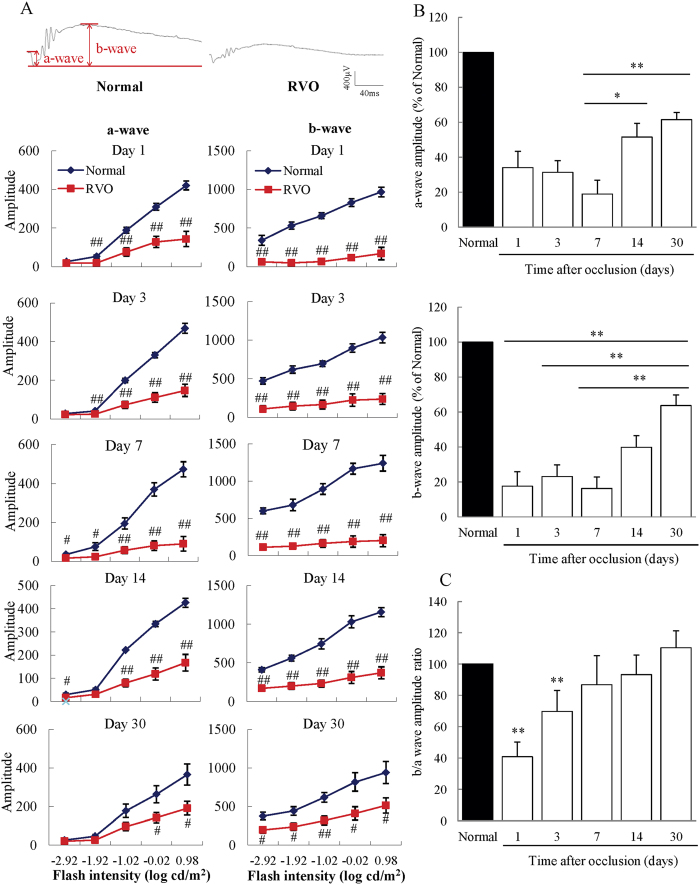
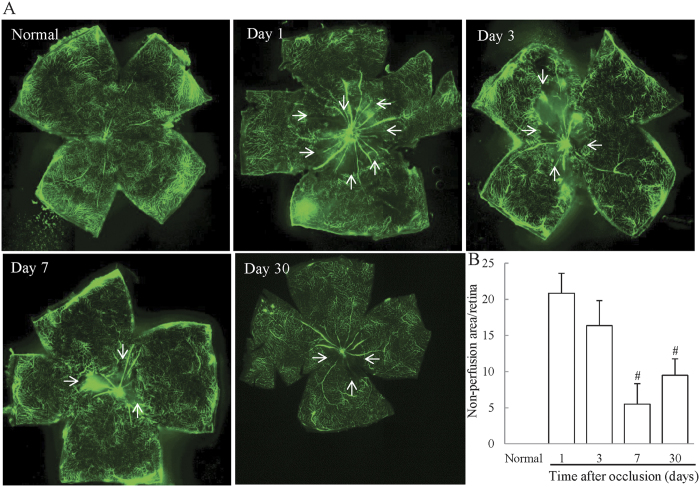
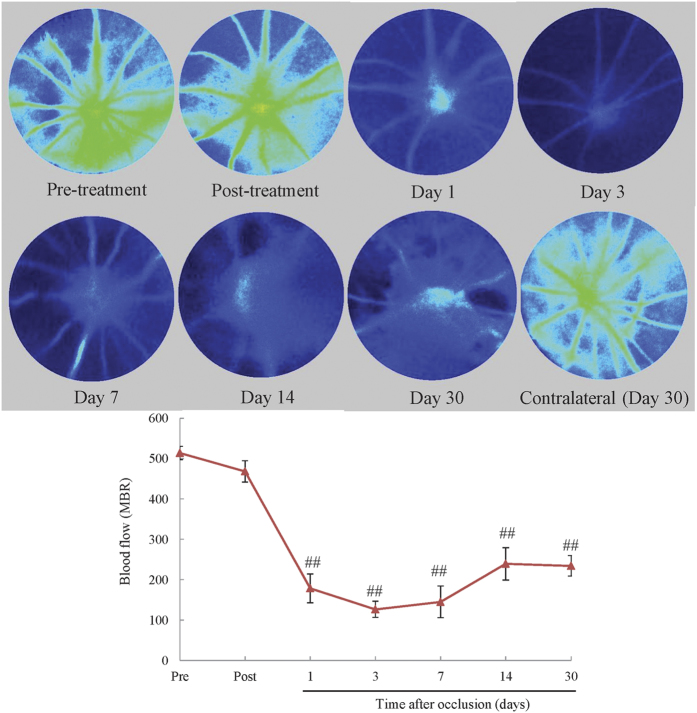
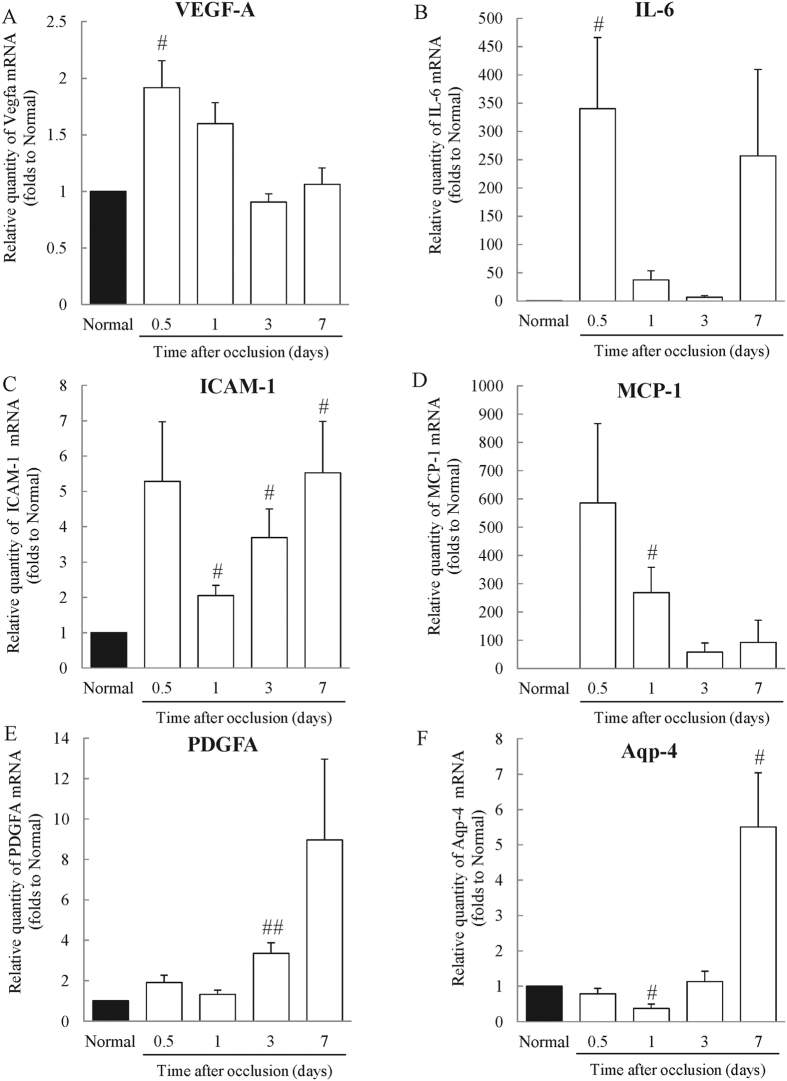
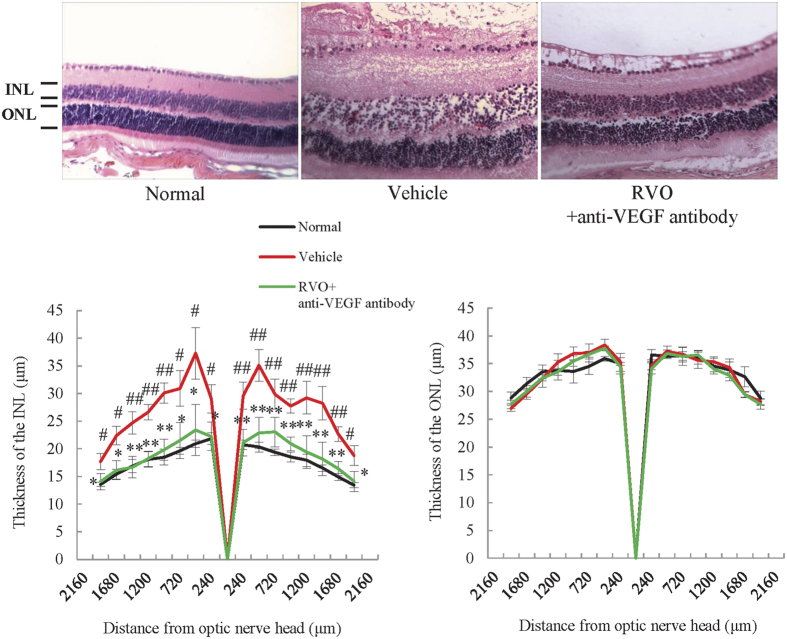
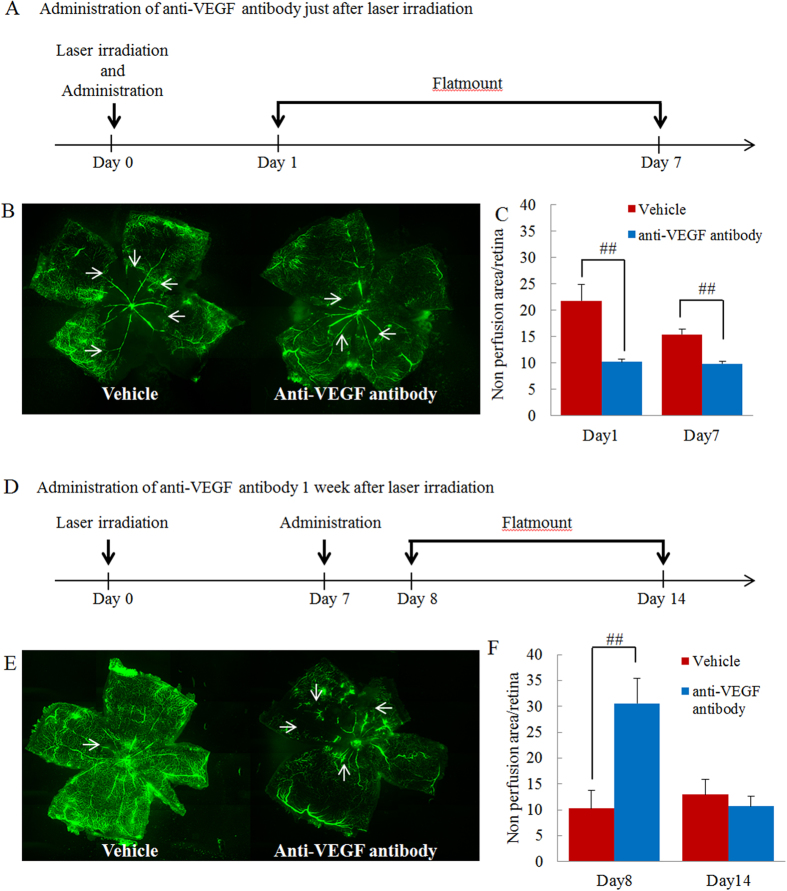
The mechanism underlying the effects of anti-vascular endothelial growth factor (VEGF) antibody in retinal vein occlusion (RVO) treatment is poorly understood, partly due to the lack of RVO animal models that mimic clinical pathology. The aims of this study were to establish a suitable RVO model, clarify the pathogenic mechanisms, and evaluate the effects of anti-VEGF antibody in the model. Mouse retinal veins were occluded by laser photocoagulation after rose bengal injection. Reduction of the b/a wave amplitude ratio, retinal nonperfusion, cystoid edema, and hard exudates were observed after occlusion, and expression of RVO-related genes was altered. Administration of anti-VEGF antibody immediately, or 7 days, after occlusion resulted in reduction and increase of the nonperfused area, respectively. We conclude that the present model will be useful for clarification of the pathogenic mechanisms, and that the timing of anti-VEGF antibody administration is important for the successful amelioration of retinal nonperfusion.


Conflict of interest statement

This investigation was supported by funding from Novartis K.K. (Tokyo, Japan).

Figures

Figure 1
Figure 1. Both retinal haemorrhage and cystoid edema were observed in the experimental mouse model of RVO.
(A) Images of a non-laser irradiated retina (left) and a retina after laser irradiation (right). The arrows indicate occluded sites. (B) Fundus photography image (left) and OCT image (right), taken 3 days after photocoagulation. Haemorrhage and cystoid edema were observed (n = 49). (C) The incidences of haemorrhage and cystoid edema were 65.8% and 60.9%, respectively. (D) OCT images taken 0, 1, 3, and 7 days after photocoagulation. Cystoid edema was observed on days 1 and 3. (E) The plot below illustrates quantitative retinal thickness data. Retinal thickness was significantly increased on day 1 compared to day 0 and gradually recovered over the course of the experiment. Data are expressed as means ± S.E.M (n = 4–7). ##P < 0.01 vs. day 0 (Dunnett’s test). (F) Quantitative analysis of INL thickness 1 day after occlusion. INL thickness was significantly increased 1 day after occlusion. Data are expressed as means ± S.E.M (n = 4–7). ##P < 0.01 vs. day 0 (Student’s t-test). (G) RVO mice have white flecks (fundus photography) and hyper-reflective dots (OCT) in the INL and OPL. Hyper-reflective dots were present in the same areas where severe edema developed. Arrow head indicates hard exudates. (H) PAS-positive deposits were located in the INL and OPL. Scale bar represents 50 μm.
Figure 2
Figure 2. Edema was located mainly in the inner layer of the retina.
(A) Representative images of H&E-stained retinas. Asterisk (*) indicates cystoid edema. Scale bar = 50 μm. Cystoid edema was observed 1 day after photocoagulation in the INL and ONL. Plots below illustrate quantitative INL (B) and ONL (C) thickness data. The thickness of the INL was dramatically increased 1 day after occlusion, gradually recovering in a time-dependent manner. ONL thickness was significantly decreased on day 7, and there was no change on days 1 and 3. The data are expressed as means ± S.E.M. (n = 3–7). ##P < 0.01, #P < 0.05 vs. untreated control (Dunnett’s test). INL; inner nuclear layer; ONL; outer nuclear layer. (D) The incidence of retinal detachment (arrow) was approximately 90.9% (20/22).
Figure 3
Figure 3. Significantly decreased b/a wave amplitude ratios in the RVO model.
(A) From days 1 to 30, both the a- and b-waves were dramatically decreased in RVO mice compared to untreated controls. Data are expressed as means ± S.E.M. (n = 3–7). ##P < 0.01, #P < 0.05 vs. untreated controls (Student’s t-test). (B) The decreased a-wave amplitude recovered significantly on days 14 and 30, compared to those on day 7. Moreover, the reduced b-wave amplitude recovered on day 30 compared to days 1, 3, and 7. Data are expressed as means ± S.E.M. **P < 0.01, *P < 0.05 (one-way ANOVA followed by Bonferroni’s post hoc comparison test). (C) The b/a wave amplitude ratio was significantly decreased on days 1 and 3 compared to untreated controls. The decreased b/a wave ratio recovered gradually and returned to a normal level by day 30. Data are expressed as means ± S.E.M. **P < 0.01, *P < 0.05 vs. untreated controls (Student’s t-test).
Figure 4
Figure 4. Retinal nonperfusion in the RVO model mouse.
(A) Representative images of flat-mounted retinas in untreated and RVO mice on days 1, 3, 7, and 30. Arrows = boundary of non-perfused area (B) Evaluation of the area of retinal nonperfusion using ImageJ software, demonstrating the development of retinal nonperfusion on days 1, 3, 7, and 30 after occlusion. The nonperfused areas on days 7 and 30 were significantly reduced compared to those on day1. Data are expressed as means ± S.E.M. (n = 4–6). *P < 0.05 vs RVO mice on day1 (one-way ANOVA followed by Bonferroni’s post hoc comparison test).
Figure 5
Figure 5. The reduction of blood flow persisted until day 30.
Blood flow was measured by LSFG before and immediately after occlusion, and on days 1, 3, 7, 14, and 30 to verify the duration of the reduction of blood flow. Blood flow was significantly reduced compared to the pre-treatment group 1, 3, 7, 14, and 30 days after occlusion. The data are expressed as means ± S.E.M. (n = 5–8). ##P < 0.01 vs pre-treatment group (Dunnett’s test).
Figure 6
Figure 6. Expression of retinal vein occlusion-related genes in the RVO model.
The expression of RVO-related and inflammatory genes were evaluated by real-time PCR analysis 0.5 (12 h), 1, 3, and 7 days after occlusion and in untreated mice. (A) The expression level of Vegfa mRNA was significantly increased 12 h after occlusion, but unchanged compared to untreated mice after 3 and 7 days. (B) The expression level of Il6 mRNA was remarkably increased 12 h after occlusion. On days 1, 3 and 7, there was no statistically significant difference in expression levels compared to untreated controls. (C) The expression level of Icam1 mRNA was significantly augmented on days 1, 3, and 7. (D) The expression level of Mcp-1 was remarkably increased, to approximately 260 times that of untreated controls. Twelve hours after photocoagulation, the difference was not statistically significant. (E) The expression level of Pdgfa mRNA was increased to three times or more that of untreated mice. (F) The expression level of Aqp4 was decreased on day 1; however, it was increased to approximately five times that of untreated mice by day 7. Data are expressed as means ± S.E.M. (n = 3–5). ##P < 0.01, #P < 0.05 vs. Normal (Student’s t-test).
Figure 7
Figure 7. Anti-VEGF antibody ameliorated cystoid and swelling edema in the INL.
Representative images of H&E-stained retinas from untreated, RVO, and RVO + anti-VEGF antibody treated groups on day 1. Plots below illustrate quantitative INL and ONL thickness data. The thickness of the INL was dramatically increased 1 day after occlusion and this was prevented by the treatment with anti-VEGF antibody. ONL thickness was not changed by laser irradiation or treatment with anti-VEGF antibody. Data are expressed as means ± S.E.M. (n = 4–5). *P < 0.05 (one-way ANOVA followed by Bonferroni’s post hoc comparison test).
Figure 8
Figure 8. Anti-VEGF antibody prevented progression of retinal nonperfusion when administered in the early phase after occlusion but aggravated nonperfusion when administered in the late phase.
(A) Protocol of early phase administration. Anti-VEGF antibody was intravitreally administered immediately after occlusion. Sampling was performed 1 and 7 days after administration. (B) Representative images of flat-mounted retinas (vehicle and anti-VEGF antibody treated groups). (C) Illustration of quantitative retinal nonperfusion area data. Nonperfused areas were reduced 1 and 7 days after occlusion. Data are expressed as means ± S.E.M. (n = 4–8). ##P < 0.01 (Student’s t-test). (D) Protocol of late phase administration. Anti-VEGF antibody was administrated intravitreally 7 days after occlusion. Sampling was performed 1 and 7 days after administration. (E) Representative images of flat-mounted retinas (vehicle and anti-VEGF antibody treated groups). (F) Quantitative illustration of retinal nonperfusion area data. The nonperfusion area was increased by anti-VEGF antibody 1 day after administration but was unchanged 7 days after administration. Data are expressed as means ± S.E.M. (n = 4–5). ##P < 0.01 (Student’s t-test).

Similar articles

Cited by

References

    1. Bunce C., Xing W. & Wormald R. Causes of blind and partial sight certifications in England and Wales: April 2007–March 2008. Eye 24, 1692–1699 (2010). - PubMed
    1. Rogers S. et al.. The prevalence of retinal vein occlusion: pooled data from population studies from the United States, Europe, Asia, and Australia. Ophthalmology 117, 313–319 e311 (2011). - PMC - PubMed
    1. Sakimoto S. et al.. Relationship between grades of macular perfusion and foveal thickness in branch retinal vein occlusion. Clinical ophthalmology 7, 39–45 (2013). - PMC - PubMed
    1. Jaissle G. B. et al.. Predictive factors for functional improvement after intravitreal bevacizumab therapy for macular edema due to branch retinal vein occlusion. Graefe’s archive for clinical and experimental ophthalmology = Albrecht von Graefes Archiv fur klinische und experimentelle Ophthalmologie 249, 183–192 (2011). - PMC - PubMed
    1. Campochiaro P. A. et al.. Ranibizumab for macular edema following branch retinal vein occlusion: six-month primary end point results of a phase III study. Ophthalmology 117, 1102–1112 e1101 (2010). - PubMed

Publication types

MeSH terms