. 2017 Mar 2;15(3):e2000797.
doi: 10.1371/journal.pbio.2000797. eCollection 2017 Mar.

Empirical assessment of published effect sizes and power in the recent cognitive neuroscience and psychology literature

Affiliations

Empirical assessment of published effect sizes and power in the recent cognitive neuroscience and psychology literature

Denes Szucs et al. PLoS Biol. .

Erratum in

Abstract

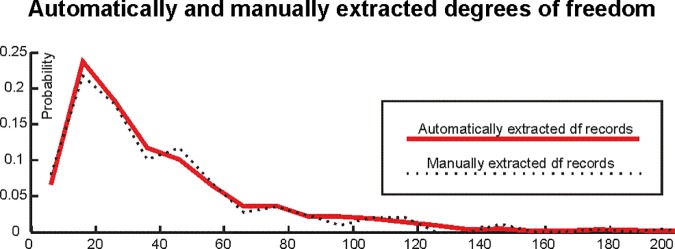
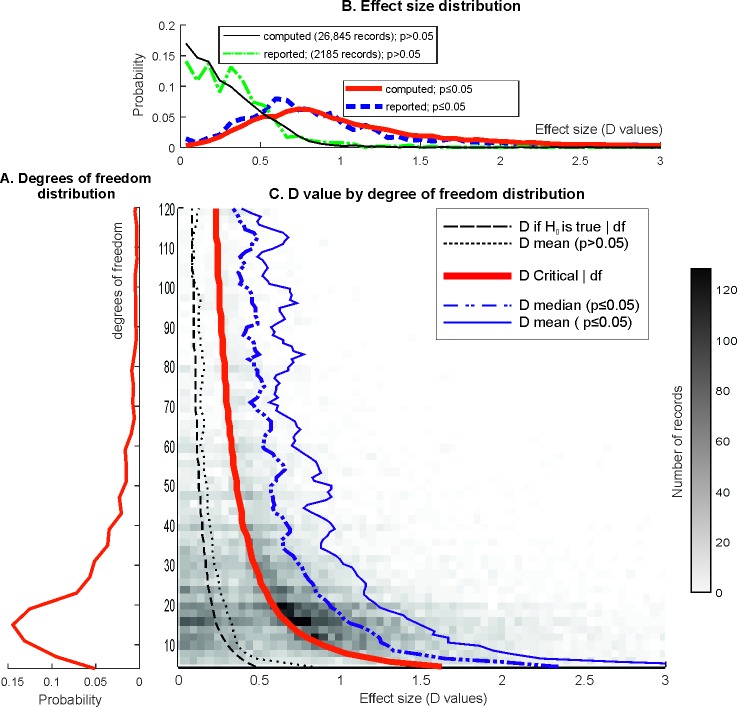
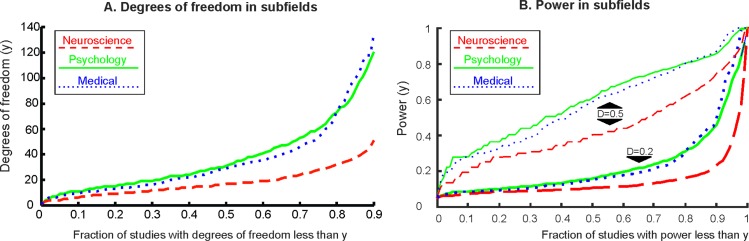
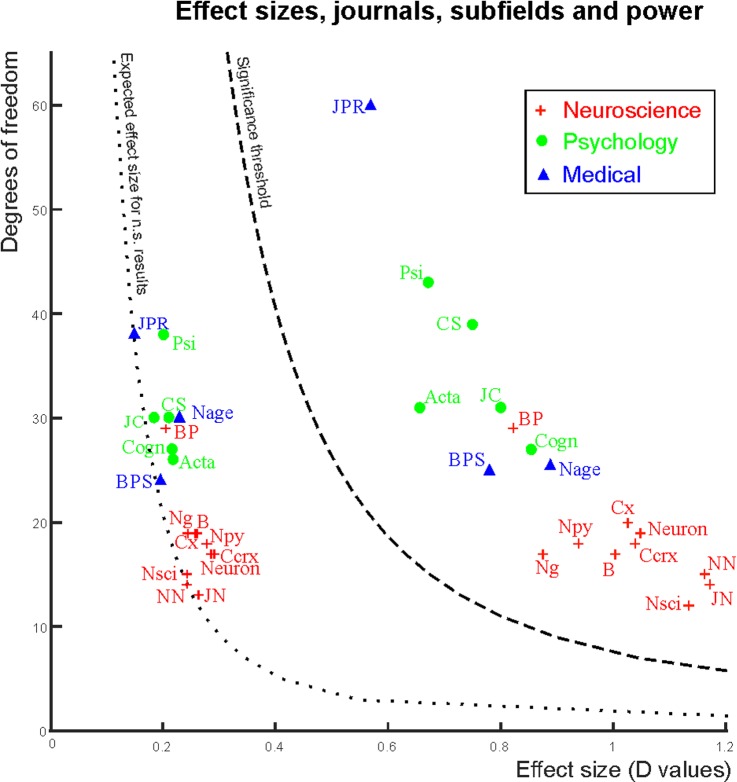
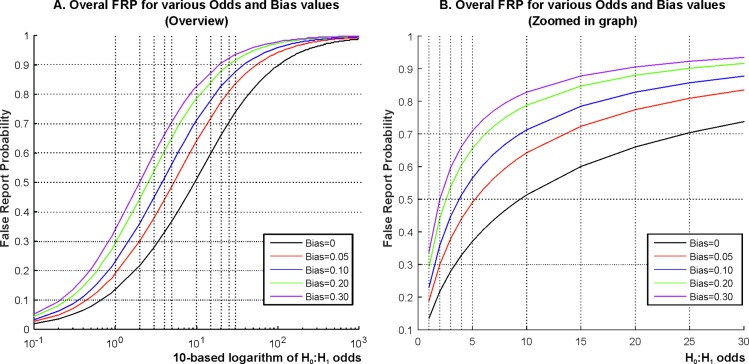
We have empirically assessed the distribution of published effect sizes and estimated power by analyzing 26,841 statistical records from 3,801 cognitive neuroscience and psychology papers published recently. The reported median effect size was D = 0.93 (interquartile range: 0.64-1.46) for nominally statistically significant results and D = 0.24 (0.11-0.42) for nonsignificant results. Median power to detect small, medium, and large effects was 0.12, 0.44, and 0.73, reflecting no improvement through the past half-century. This is so because sample sizes have remained small. Assuming similar true effect sizes in both disciplines, power was lower in cognitive neuroscience than in psychology. Journal impact factors negatively correlated with power. Assuming a realistic range of prior probabilities for null hypotheses, false report probability is likely to exceed 50% for the whole literature. In light of our findings, the recently reported low replication success in psychology is realistic, and worse performance may be expected for cognitive neuroscience.


Conflict of interest statement

The authors have declared that no competing interests exist.

Figures

Fig 1
Fig 1. The distribution of automatically and manually extracted degrees of freedom records (“df records”).
Note that the distributions are close to overlapping.
Fig 2
Fig 2. Degrees of freedom and effect size (D-value) distribution in the literature.
The histograms are zoomed in for better visibility, but all data were used in calculations. (A) Extracted df distribution in all 26,841 records. (The distributions were nearly overlapping for statistically significant and nonsignificant results.) (B) The distribution of D-values in statistically significant (p ≤ 0.05) and nonsignificant (p > 0.05) records in the whole data set (“computed”) and in the subset of data with D-value reports (“reported”). (C) The bivariate distribution of D-values and degrees of freedom in the whole data set. The density of statistical records is color coded, as shown by the calibration bar on the right. Curves in the figure are described in a left-to-right order. The leftmost dashed curve shows the expected value of effect sizes if the null hypothesis is true. The dotted curve shows the mean effect size from nonsignificant records in the data (the median was nearly the same). The middle thick continuous red curve denotes the significance threshold with p ≤ α where α = 0.05, in terms of D-values. The dotted-dashed blue curve and the rightmost continuous thin blue curve show the median and mean effect sizes only for statistically significant effect sizes, for various degrees of freedom.
Fig 3
Fig 3. The cumulative distribution of degrees of freedom and power.
(A) The cumulative distribution of degrees of freedom in subfields. (i.e., the fraction of records with at least a certain level of degrees of freedom by science subfield.) (B) The cumulative distribution of power in subfields. The top three lines denote power for an effect size of D = 0.5. The bottom three lines denote power for an effect size of D = 0.2. Power is not shown for effect size of D = 0.8.
Fig 4
Fig 4. Power in journals and subfields.
Median effect sizes and degrees of freedom in the journals analyzed. Red crosses denote cognitive neuroscience journals. Green circles denote psychology journals. Blue triangles denote medically oriented journals. Journal markers to the left of the significance threshold show medians for statistically nonsignificant records (range of medians: d = 0.15–0.29). Journal markers to the right of the significance threshold show medians for statistically significant records (range of medians: d = 0.57–1.17). Journal abbreviations: Neuroscience: Nature Neuroscience (NN), Neuron, Brain (B), The Journal of Neuroscience (JN), Cerebral Cortex (Ccrx), NeuroImage (Ng), Cortex (Cx), Biological Psychology (BP), Neuropsychologia (NPy), Neuroscience (NSci). Psychology: Psychological Science (Psi), Cognitive Science (CS), Cognition (Cogn), Acta Psychologica (Acta), Journal of Experimental Child Psychology (JC). Medically oriented journals: Biological Psychiatry (BPS), Journal of Psychiatric Research (JPR), Neurobiology of Ageing (Nage).
Fig 5
Fig 5. Lower estimates of FRP for various H0:H1 odds and bias values.
(A) FRP for a wide range (0.1–1,000) of H0:H1 odds on a 10-based logarithmic scale (horizontal axis). (B) FRP for the 1–30 range. The dotted vertical lines denote the same H0:H1 odds in both panels for easier comparison (H0:H1 odds of 1, 2, 3, 4, 5, 10, 15, 20, 25, and 30). Note that the vertical axis begins at 0.1 in Panel B for better visibility. FRP is provided for a range of bias values. For example, bias = 0.1 means that 10% of results that would be reported as statistically nonsignificant in the absence of bias will be now reported as statistically significant. See further elaboration on bias in the text.

Similar articles

Cited by

References

    1. Nosek BA, Alter G, Banks GC, Borsboom D, Bowman SD, Breckler SJ et al. Promoting an open research culture. Science. June 2015b; 26;348(6242):1422–5 - PMC - PubMed
    1. Nosek et al. Estimating the reproducibility of psychological science. Science. 2015a; 349, 943. - PubMed
    1. Ioannidis JPA. How to make more published research true. PLoS Medicine. 2014; 11(10): e1001747 10.1371/journal.pmed.1001747 - DOI - PMC - PubMed
    1. Ioannidis JPA. Greenland S, Hlatky MA, Khoury MJ, Macleod MR, Moher D, Schulz KF, Tibshirani R. Increasing value and reducing waste and research design, conduct and analysis. Lancet, 2014; 383, 166–175. 10.1016/S0140-6736(13)62227-8 - DOI - PMC - PubMed
    1. Ioannidis JPA. Why most published research findings are false. PLoS Medicine. 2005; 2(8), e124 10.1371/journal.pmed.0020124 - DOI - PMC - PubMed

Publication types

MeSH terms

LinkOut - more resources