Multiband multi-echo imaging of simultaneous oxygenation and flow timeseries for resting state connectivity
- PMID: 28253268
- PMCID: PMC5333818
- DOI: 10.1371/journal.pone.0169253
Multiband multi-echo imaging of simultaneous oxygenation and flow timeseries for resting state connectivity
Abstract
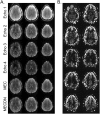
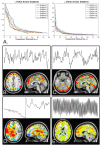
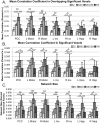
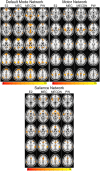
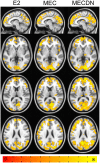
A novel sequence has been introduced that combines multiband imaging with a multi-echo acquisition for simultaneous high spatial resolution pseudo-continuous arterial spin labeling (ASL) and blood-oxygenation-level dependent (BOLD) echo-planar imaging (MBME ASL/BOLD). Resting-state connectivity in healthy adult subjects was assessed using this sequence. Four echoes were acquired with a multiband acceleration of four, in order to increase spatial resolution, shorten repetition time, and reduce slice-timing effects on the ASL signal. In addition, by acquiring four echoes, advanced multi-echo independent component analysis (ME-ICA) denoising could be employed to increase the signal-to-noise ratio (SNR) and BOLD sensitivity. Seed-based and dual-regression approaches were utilized to analyze functional connectivity. Cerebral blood flow (CBF) and BOLD coupling was also evaluated by correlating the perfusion-weighted timeseries with the BOLD timeseries. These metrics were compared between single echo (E2), multi-echo combined (MEC), multi-echo combined and denoised (MECDN), and perfusion-weighted (PW) timeseries. Temporal SNR increased for the MECDN data compared to the MEC and E2 data. Connectivity also increased, in terms of correlation strength and network size, for the MECDN compared to the MEC and E2 datasets. CBF and BOLD coupling was increased in major resting-state networks, and that correlation was strongest for the MECDN datasets. These results indicate our novel MBME ASL/BOLD sequence, which collects simultaneous high-resolution ASL/BOLD data, could be a powerful tool for detecting functional connectivity and dynamic neurovascular coupling during the resting state. The collection of more than two echoes facilitates the use of ME-ICA denoising to greatly improve the quality of resting state functional connectivity MRI.
Conflict of interest statement
Figures



Similar articles
-
Multiband multi-echo simultaneous ASL/BOLD for task-induced functional MRI.PLoS One. 2018 Feb 1;13(2):e0190427. doi: 10.1371/journal.pone.0190427. eCollection 2018. PLoS One. 2018. PMID: 29389985 Free PMC article.
-
Resting state BOLD-perfusion coupling patterns using multiband multi-echo pseudo-continuous arterial spin label imaging.Sci Rep. 2025 Jan 15;15(1):2108. doi: 10.1038/s41598-024-81305-1. Sci Rep. 2025. PMID: 39814790 Free PMC article.
-
Improved resting state functional connectivity sensitivity and reproducibility using a multiband multi-echo acquisition.Neuroimage. 2021 Jan 15;225:117461. doi: 10.1016/j.neuroimage.2020.117461. Epub 2020 Oct 16. Neuroimage. 2021. PMID: 33069864 Free PMC article.
-
Characterizing Resting-State Brain Function Using Arterial Spin Labeling.Brain Connect. 2015 Nov;5(9):527-42. doi: 10.1089/brain.2015.0344. Epub 2015 Oct 6. Brain Connect. 2015. PMID: 26106930 Free PMC article. Review.
-
Multi-echo fMRI: A review of applications in fMRI denoising and analysis of BOLD signals.Neuroimage. 2017 Jul 1;154:59-80. doi: 10.1016/j.neuroimage.2017.03.033. Epub 2017 Mar 29. Neuroimage. 2017. PMID: 28363836 Review.
Cited by
-
Does higher sampling rate (multiband + SENSE) improve group statistics - An example from social neuroscience block design at 3T.Neuroimage. 2020 Jun;213:116731. doi: 10.1016/j.neuroimage.2020.116731. Epub 2020 Mar 12. Neuroimage. 2020. PMID: 32173409 Free PMC article.
-
Changes in cerebrovascular reactivity within functional networks in older adults with long-COVID.Front Neurol. 2025 Mar 26;16:1504573. doi: 10.3389/fneur.2025.1504573. eCollection 2025. Front Neurol. 2025. PMID: 40206293 Free PMC article.
-
Contribution of the multi-echo approach in accelerated functional magnetic resonance imaging multiband acquisition.Hum Brain Mapp. 2022 Feb 15;43(3):955-973. doi: 10.1002/hbm.25698. Epub 2021 Oct 30. Hum Brain Mapp. 2022. PMID: 34716738 Free PMC article.
-
Molecular-enriched functional connectivity in the human brain using multiband multi-echo simultaneous ASL/BOLD fMRI.Sci Rep. 2023 Jul 20;13(1):11751. doi: 10.1038/s41598-023-38573-0. Sci Rep. 2023. PMID: 37474568 Free PMC article.
-
Using multiband multi-echo imaging to improve the robustness and repeatability of co-activation pattern analysis for dynamic functional connectivity.Neuroimage. 2021 Nov;243:118555. doi: 10.1016/j.neuroimage.2021.118555. Epub 2021 Sep 4. Neuroimage. 2021. PMID: 34492293 Free PMC article.
References
-
- Biswal B, Yetkin FZ, Haughton VM, Hyde JS. Functional connectivity in the motor cortex of resting human brain using echo-planar MRI. Magn Reson Med. 1995;34(4):537–41. - PubMed
-
- Buxton RB, Uludag K, Dubowitz DJ, Liu TT. Modeling the hemodynamic response to brain activation. Neuroimage. 2004;23 Suppl 1:S220–33. - PubMed
MeSH terms
Substances
LinkOut - more resources
Full Text Sources
Other Literature Sources
Medical
Miscellaneous

