. 2017 Mar 2;12(3):e0172765.
doi: 10.1371/journal.pone.0172765. eCollection 2017.

Combinatorial effects of quercetin and sex-steroids on fluid and electrolytes' (Na+, Cl-, HCO3-) secretory mechanisms in the uterus of ovariectomised female Sprague-Dawley rats

Affiliations

Combinatorial effects of quercetin and sex-steroids on fluid and electrolytes' (Na+, Cl-, HCO3-) secretory mechanisms in the uterus of ovariectomised female Sprague-Dawley rats

Huma Shahzad et al. PLoS One. .

Abstract

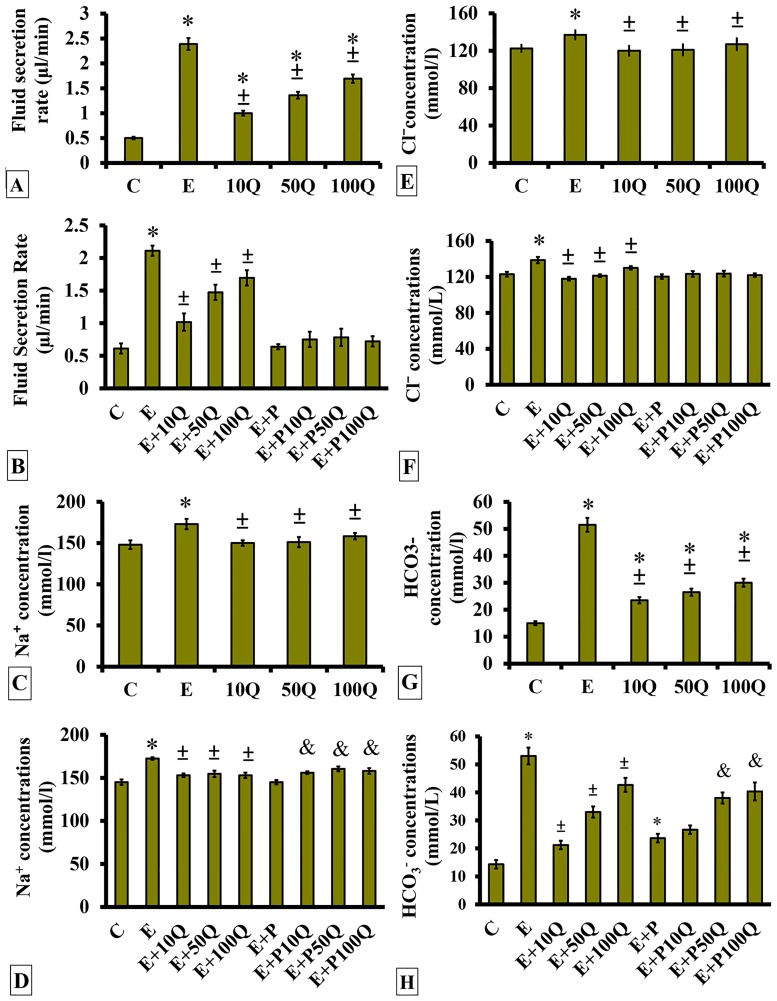
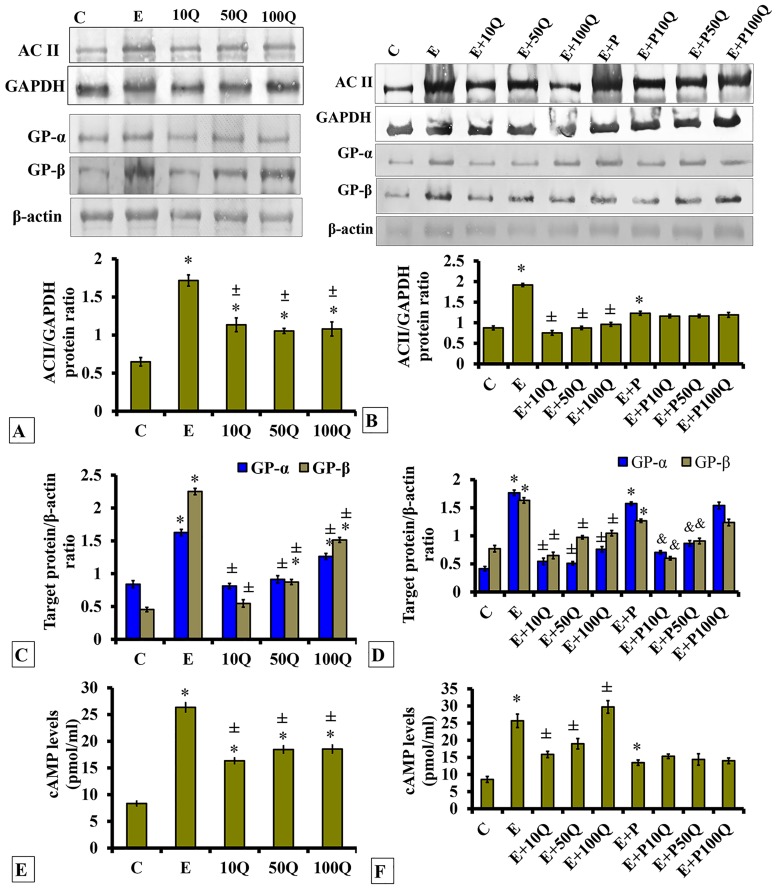
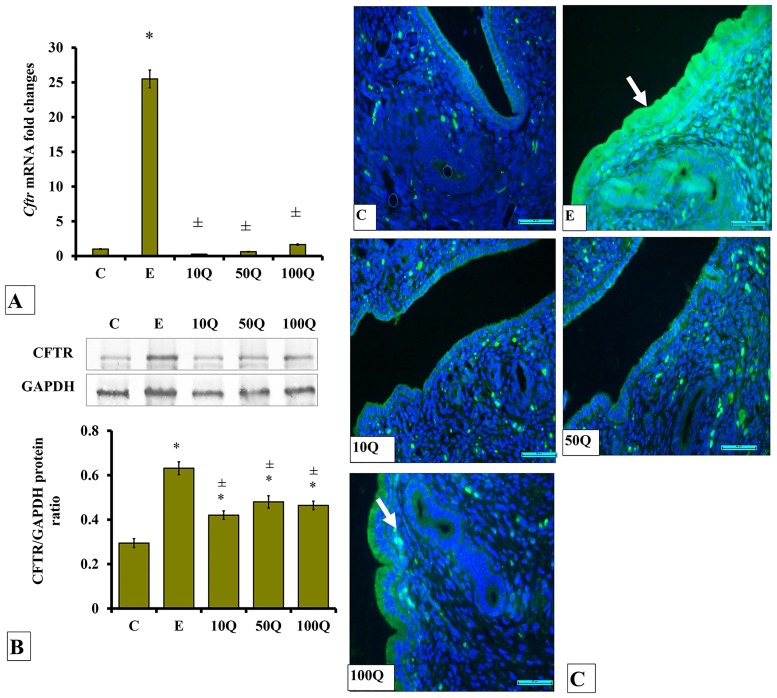
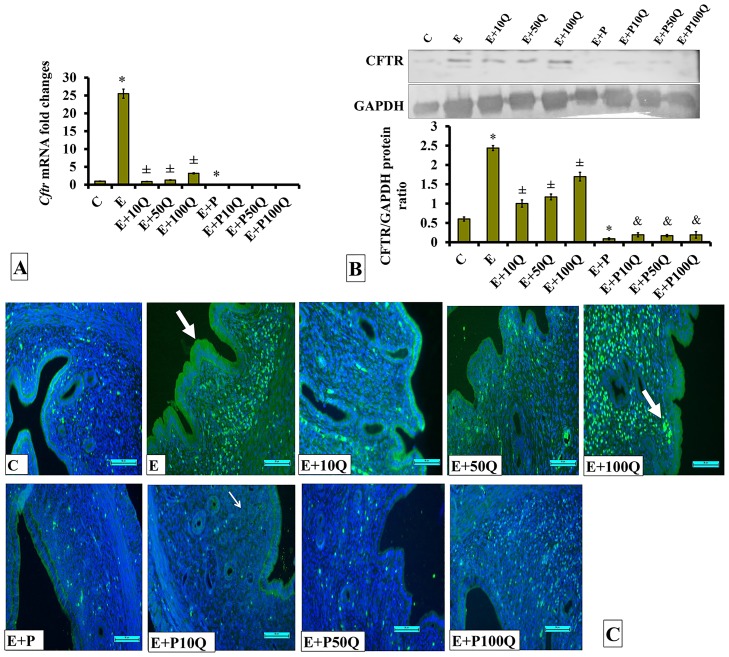
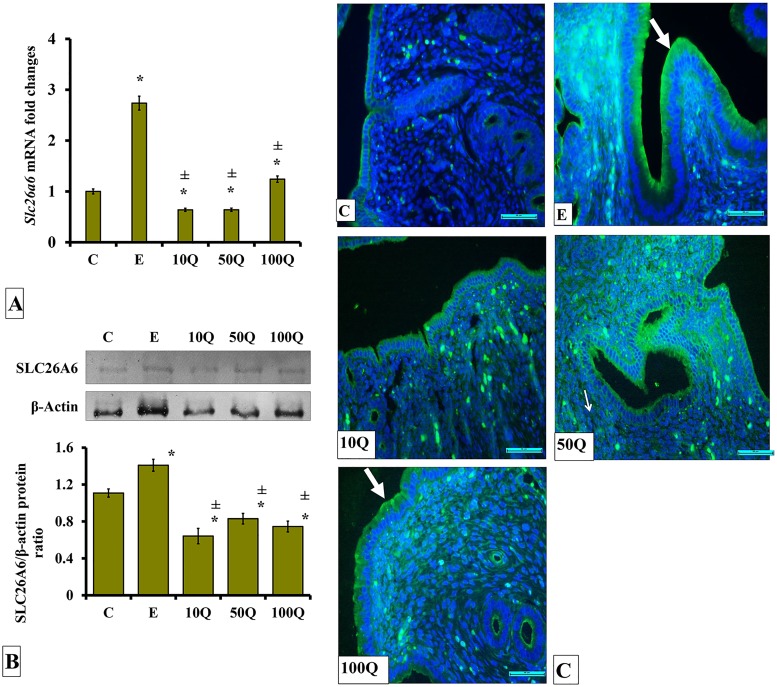
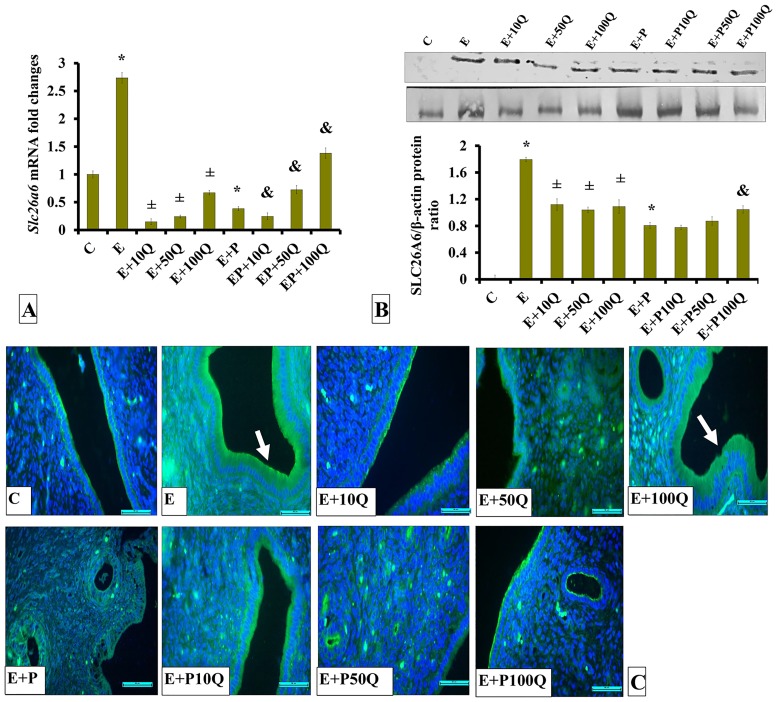
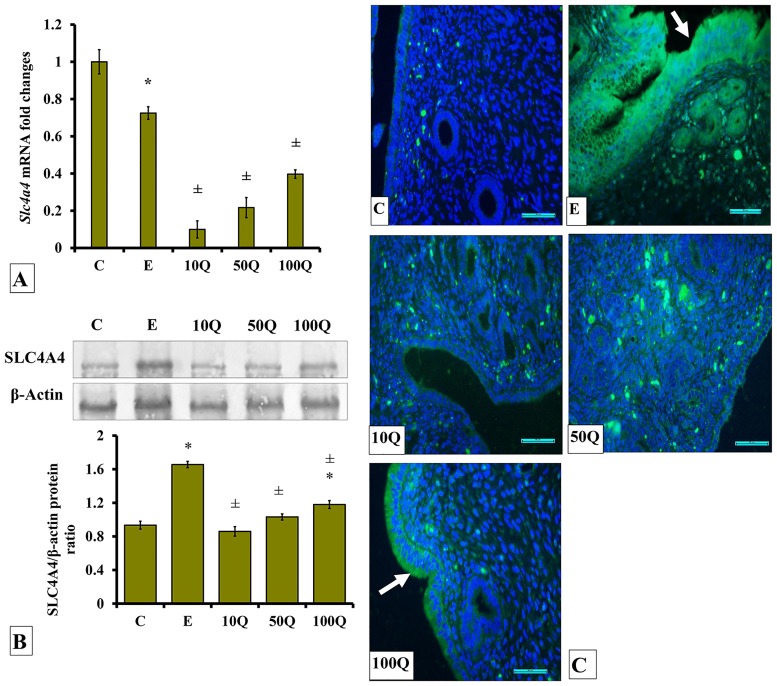
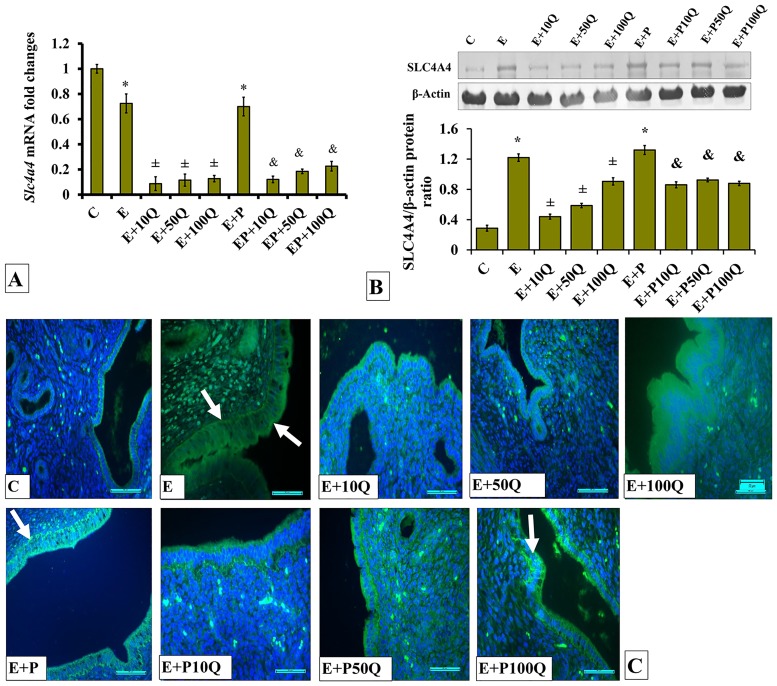
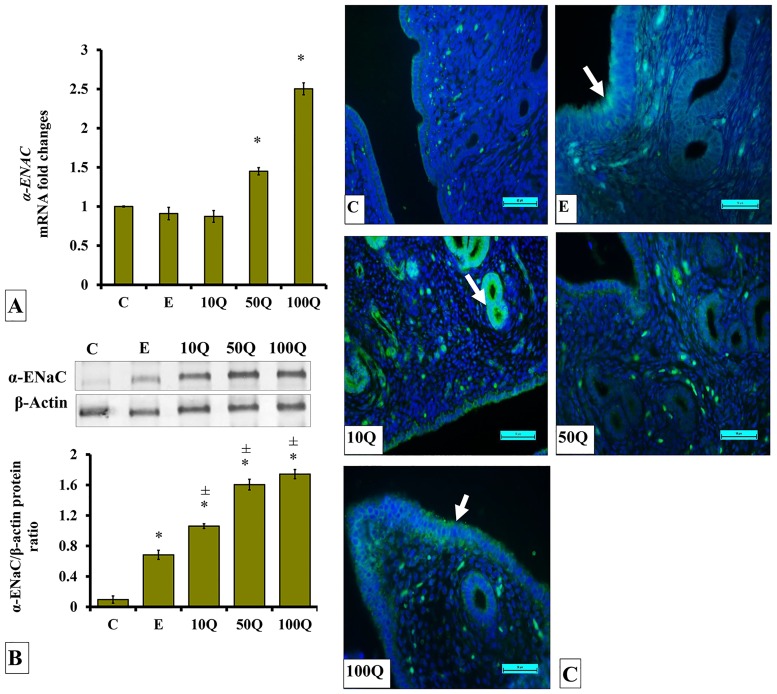
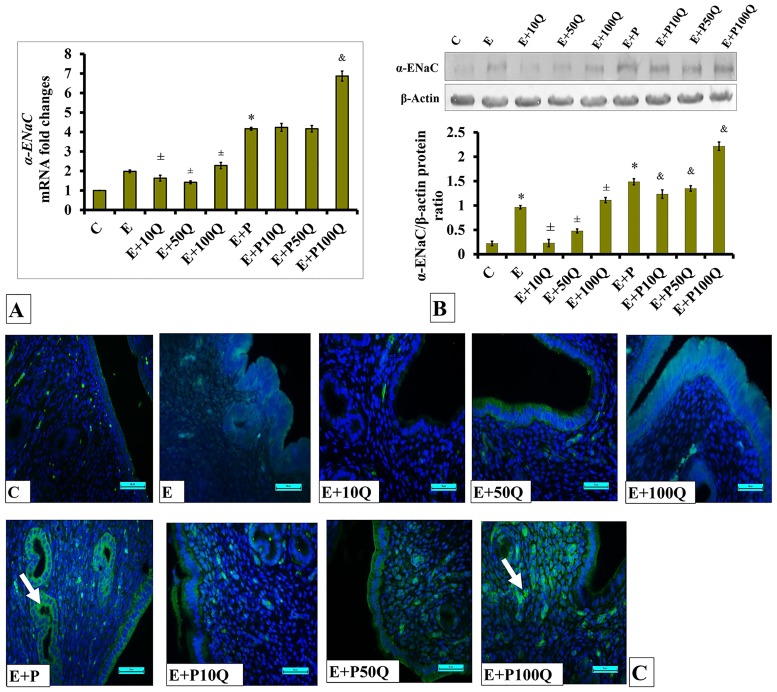
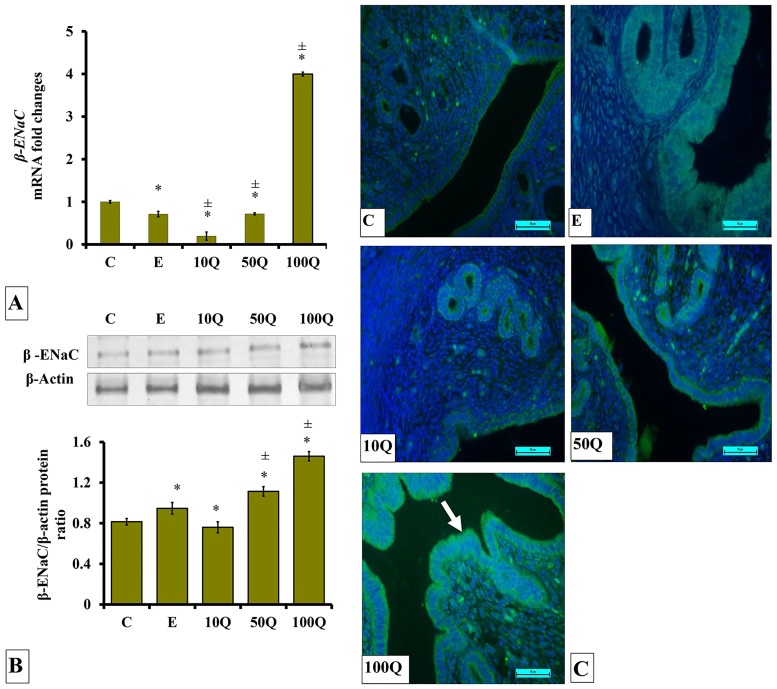
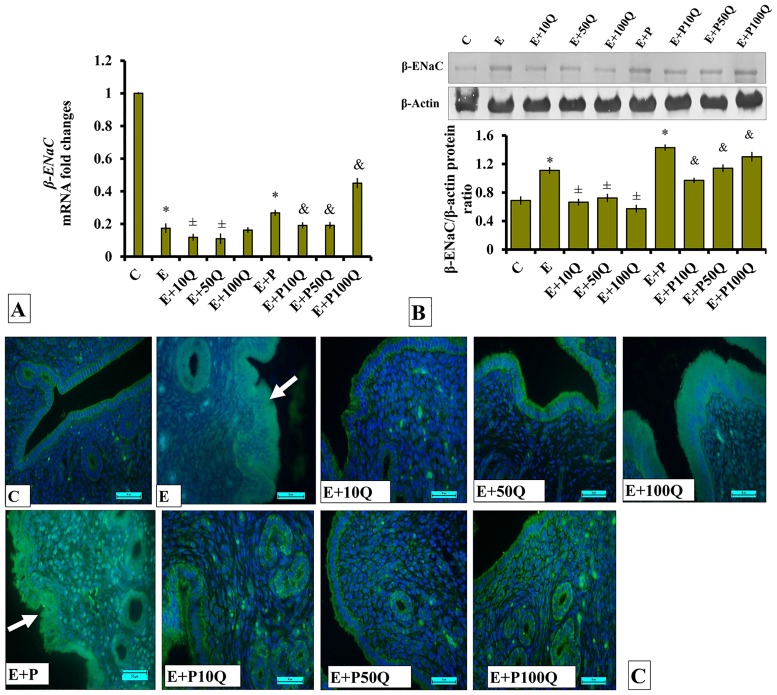
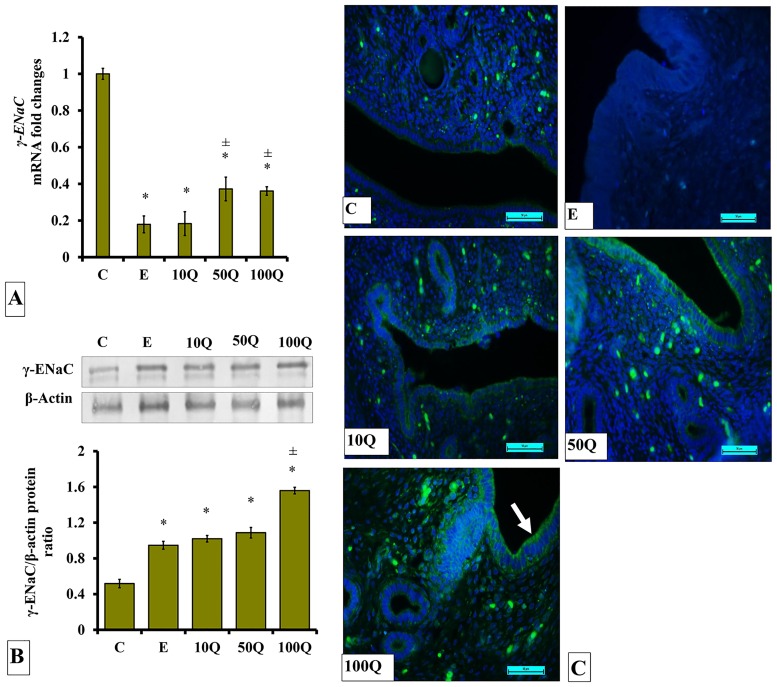
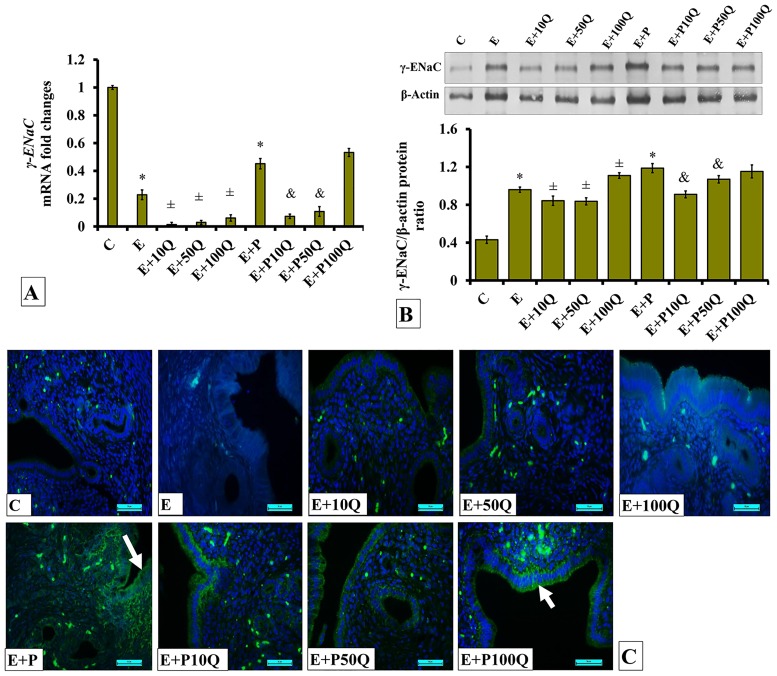
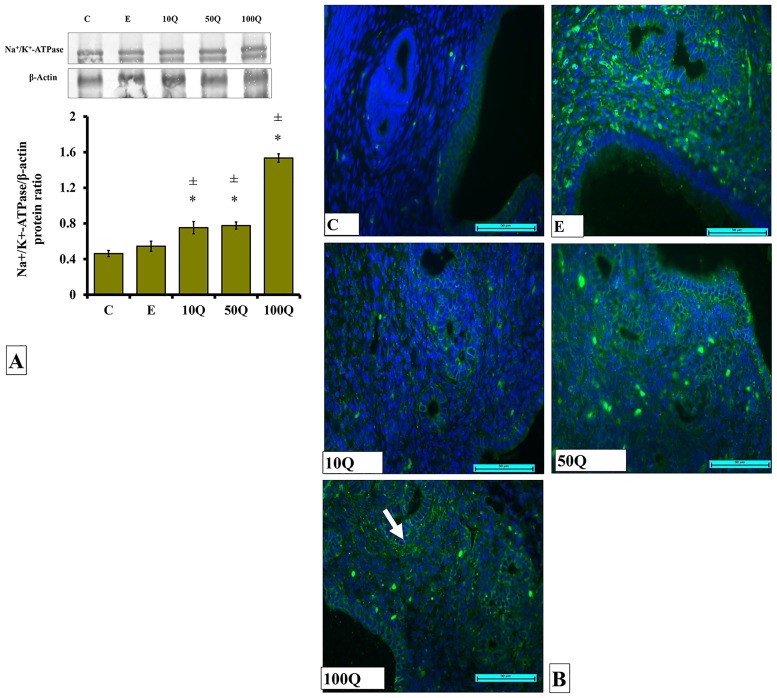
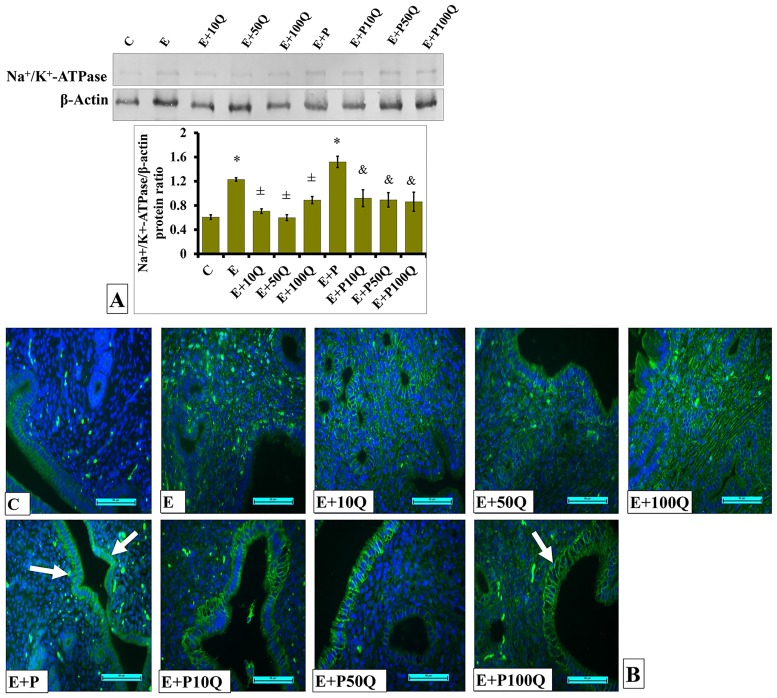
Dysregulation of uterine fluid environment could impair successful reproduction and this could be due to the effect of environmental estrogens. Therefore, in this study, effect of quercetin, an environmental estrogen on uterine fluid and electrolytes concentrations were investigated under sex-steroid influence. Ovariectomised adult female Sprague-Dawley rats were given 10, 50 or 100mg/kg/day quercetin subcutaneously with 17-β estradiol (E) for seven days or three days E, then three days E plus progesterone (P) (E+P) treatment. Uterine fluid secretion rate, Na+, Cl- and HCO3- concentrations were determined by in-vivo perfusion. Following sacrifice, uteri were harvested and levels of the proteins of interest were identified by Western blotting and Realtime PCR. Distribution of these proteins in the uterus was observed by immunofluorescence. Levels of uterine cAMP were measured by enzyme-linked immunoassay (EIA). Administration of quercetin at increasing doses increased uterine fluid secretion rate, Na+, Cl- and HCO3- concentrations, but to the levels lesser than that of E. In concordant, levels of CFTR, SLC4A4, ENaC (α, β and γ), Na+/K+-ATPase, GPα/β, AC and cAMP in the uterus increased following increased in the doses of quercetin. Co-administration of quercetin with E caused uterine fluid secretion rate, Na+, Cl- and HCO3- concentrations to decrease. In concordant, uterine CFTR, SLC26A6, SLC4A4, ENaC (α, β and γ), Na+/K+-ATPase, GPα/β, AC and cAMP decreased. Greatest effects were observed following co-administration of 10mg/kg/day quercetin with E. Co-administration of quercetin with E+P caused uterine fluid Na+ and HCO3- concentrations to increase but no changes in fluid secretion rate and Cl- concentration were observed. Co-administration of high dose quercetin (100 mg/kg/day) with E+P caused uterine CFTR, SLC26A6, AC, GPα/β and ENaC (α, β and γ) to increase. Quercetin-induced changes in the uterine fluid secretion rate and electrolytes concentrations could potentially affect the uterine reproductive functions under female sex-steroid influence.


Conflict of interest statement

Competing Interests: The authors have declared that no competing interests exist.

Figures

Fig 1
Fig 1. Changes of uterine fluids (A&B) secretion rate, (C&D) Na+ concentration, (E&F) Cl- concentration and (G&H) HCO3- concentration in non sex-steroid and sex-steroid replaced ovariectomized rats following quercetin treatment.
Data were expressed as mean +/- SEM. N = 6 per treatment group. *p < 0.05 compared to C, ±p<0.05 compared to E. & p<0.05 compared to E+P.
Fig 2
Fig 2. Representative Western blot image of AC, GPα and GPβ, (A&B) analyses of band intensity for AC/GAPDH (C&D) analyses of band intensity for GPα or GPβ/β-actin and (E&F) levels of cAMP in ovariectomized, non-sex-steroid treated and sex-steroid treated rats receiving concomitant treatment with quercetin.
Data were expressed as mean +/- SEM. N = 6 per treatment group. *p < 0.05 compared to C, ±p<0.05 compared to E. & p<0.05 compared to E+P.
Fig 3
Fig 3. (A) Cftr mRNA levels, (B) Representative Western blot image and ratio of CFTR /GAPDH and (C) CFTR distribution in the endometrium of ovariectomized, quercetin-treated rats.
Data were expressed as mean +/- SEM. N = 6 per treatment group. For A-C, *p < 0.05 compared to C, ±p<0.05 compared to E. & p<0.05 compared to E+P.
Fig 4
Fig 4. (A) Cftr mRNA levels, (B) Representative Western blot image and ratio of CFTR /GAPDH and (C) CFTR distribution in the endometrium of sex-steroid replaced ovariectomized rats with concomitant treatment with quercetin.
Data were expressed as mean +/- SEM. N = 6 per treatment group. For A-C, *p < 0.05 compared to C, ±p<0.05 compared to E. & p<0.05 compared to E+P. Arrows show protein distribution.
Fig 5
Fig 5. (A) Slc26a6 mRNA levels, (B) Representative Western blot image and ratio of SLC26A6/GAPDH and (C) SLC26A6 distribution in the endometrium of ovariectomized, quercetin-treated rats.
Data were expressed as mean +/- SEM. N = 6 per treatment group. For A-C, *p < 0.05 compared to C, ±p<0.05 compared to E. & p<0.05 compared to E+P.
Fig 6
Fig 6. (A) Slc26a6 mRNA levels, (B) Representative Western blot image and ratio of SLC26A6/GAPDH and (C) SLC26A6 distribution in the endometrium of sex-steroid replaced ovariectomized rats with concomitant treatment with quercetin.
Data were expressed as mean +/- SEM. N = 6 per treatment group. *p < 0.05 compared to C, ±p<0.05 compared to E. & p<0.05 compared to E+P. Arrows show protein distribution.
Fig 7
Fig 7. (A) Slc4a4 mRNA levels, (B) Representative Western blot image and ratio of SLC4A4/β-actin and (C) SLC4A4 distribution in the endometrium of ovariectomized, quercetin-treated rats.
Data were expressed as mean +/- SEM. N = 6 per treatment group. For A-C, *p < 0.05 compared to C, ±p<0.05 compared to E. & p<0.05 compared to E+P.
Fig 8
Fig 8. (A) Slc4a4 mRNA levels, (B) Representative Western blot image and ratio of SLC4A4/GAPDH and (C) SLC4A4 distribution in the endometrium of sex-steroid replaced ovariectomized rats with concomitant treatment with quercetin.
Data were expressed as mean +/- SEM. N = 6 per treatment group. *p < 0.05 compared to C, ±p<0.05 compared to E. & p<0.05 compared to E+P. Arrows show protein distribution.
Fig 9
Fig 9. (A) α-Enac mRNA levels, (B) Representative Western blot image and ratio of α-ENaC /β-actin and (C) α-ENaC distribution in the endometrium of ovariectomized, quercetin-treated rats.
Data were expressed as mean +/- SEM. N = 6 per treatment group. For A-C, *p < 0.05 compared to C, ±p<0.05 compared to E. & p<0.05 compared to E+P.
Fig 10
Fig 10. (A) α-Enac mRNA levels, (B) Representative Western blot image and ratio of α-ENaC /GAPDH and (C) α-ENaC distribution in the endometrium of sex-steroid replaced ovariectomized rats with concomitant treatment with quercetin.
Data were expressed as mean +/- SEM. N = 6 per treatment group. *p < 0.05 compared to C, ±p<0.05 compared to E. & p<0.05 compared to E+P. Arrows show protein distribution.
Fig 11
Fig 11. (A) β-Enac mRNA levels, (B) Representative Western blot image and ratio of β-ENaC /β-actin and (C) β-ENaC distribution in the endometrium of ovariectomized, quercetin-treated rats.
Data were expressed as mean +/- SEM. N = 6 per treatment group. For A-C, *p < 0.05 compared to C, ±p<0.05 compared to E. & p<0.05 compared to E+P.
Fig 12
Fig 12. (A) β-Enac mRNA levels, (B) Representative Western blot image and ratio of β-ENaC /GAPDH and (C) β-ENaC distribution in the endometrium of sex-steroid replaced ovariectomized rats with concomitant treatment with quercetin.
Data were expressed as mean +/- SEM. N = 6 per treatment group. *p < 0.05 compared to C, ±p<0.05 compared to E. & p<0.05 compared to E+P. Arrows show protein distribution.
Fig 13
Fig 13. (A) γ-Enac mRNA levels, (B) Representative Western blot image and ratio of γ-ENaC /β-actin and (C) γ-ENaC distribution in the endometrium of ovariectomized, quercetin-treated rats.
Data were expressed as mean +/- SEM. N = 6 per treatment group. For A-C, *p < 0.05 compared to C, ±p<0.05 compared to E. & p<0.05 compared to E+P.
Fig 14
Fig 14. (A) γ-Enac mRNA levels, (B) Representative Western blot image and ratio of γ-ENaC /GAPDH and (C) γ-ENaC distribution in the endometrium of sex-steroid replaced ovariectomized rats with concomitant treatment with quercetin.
Data were expressed as mean +/- SEM. N = 6 per treatment group. *p < 0.05 compared to C, ±p<0.05 compared to E. & p<0.05 compared to E+P. Arrows show protein distribution.
Fig 15
Fig 15. (A) Representative Western blot image and ratio of Na+/K+-ATPase/β-actin and (B) Na+/K+-ATPase distribution in the endometrium of ovariectomized, quercetin-treated rats.
Data were expressed as mean +/- SEM. N = 6 per treatment group. For A-C, *p < 0.05 compared to C, ±p<0.05 compared to E. & p<0.05 compared to E+P. Arrows show protein distribution.
Fig 16
Fig 16. (A) Representative Western blot image and ratio of Na+/K+-ATPase/GAPDH. (B) Na+/K+-ATPase distribution in the endometrium of sex-steroid replaced ovariectomized rats with concomitant treatment with quercetin.
Data were expressed as mean +/- SEM. N = 4 per treatment group. *p < 0.05 compared to C, ±p<0.05 compared to E. & p<0.05 compared to E+P. Arrows show protein distribution.

Similar articles

Cited by

References

    1. Salleh N, Baines DL, Naftalin RJ, Milligan SR. The hormonal control of uterine luminal fluid secretion and absorption. The Journal of Membrane Biology. 2005;206(1):17–28. 10.1007/s00232-005-0770-7 - DOI - PubMed
    1. Gholami K, Muniandy S, Salleh N. In-Vivo Functional Study on the Involvement of CFTR, SLC26A6, NHE-1 and CA Isoenzymes II and XII in Uterine Fluid pH, Volume and Electrolyte Regulation in Rats under Different Sex-Steroid Influence. International Journal of Medical Sciences. 2013;10(9):1121–34. 10.7150/ijms.5918 - DOI - PMC - PubMed
    1. Hamilton J, Iles RK, Gunn LK, Wilson C, Lower AM, Chard T, et al. Concentrations of placental protein 14 in uterine flushings from infertile women: validation of the collection technique and method of expression of results. Human Reproduction. 1998;13(12):3357–62. - PubMed
    1. Bentin-Ley U, Lindhard A, Ravn V, Islin H, Sørensen S. Glycodelin in endometrial flushing fluid and endometrial biopsies from infertile and fertile women. European Journal of Obstetrics & Gynecology and Reproductive Biology. 2011;156(1):60–6. - PubMed
    1. Lu S, Peng H, Zhang H, Zhang L, Cao Q, Li R, et al. Excessive intrauterine fluid cause aberrant implantation and pregnancy outcome in mice. PloS One. 2013;8(10):e78446 10.1371/journal.pone.0078446 - DOI - PMC - PubMed

MeSH terms

LinkOut - more resources