. 2017 Mar 3;15(1):47.
doi: 10.1186/s12916-017-0809-5.

Counting the lives saved by DOTS in India: a model-based approach

Affiliations

Counting the lives saved by DOTS in India: a model-based approach

Sandip Mandal et al. BMC Med. .

Abstract

Background: Against the backdrop of renewed efforts to control tuberculosis (TB) worldwide, there is a need for improved methods to estimate the public health impact of TB programmes. Such methods should not only address the improved outcomes amongst those receiving care but should also account for the impact of TB services on reducing transmission.

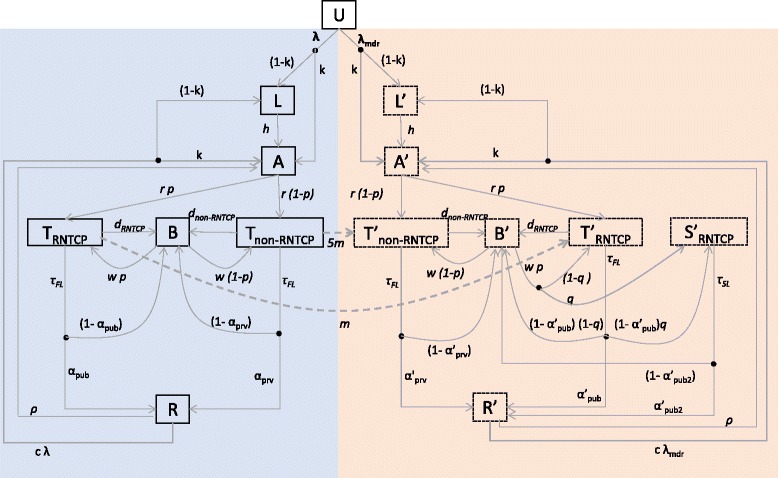
Methods: Vital registration data in India are not sufficiently reliable for estimates of TB mortality. As an alternative approach, we developed a mathematical model of TB transmission dynamics and mortality, capturing the scale-up of DOTS in India, through the rollout of the Revised National TB Control Programme (RNTCP). We used available data from the literature to calculate TB mortality hazards amongst untreated TB; amongst cases treated under RNTCP; and amongst cases treated under non-RNTCP conditions. Using a Bayesian evidence synthesis framework, we combined these data with current estimates for the TB burden in India to calibrate the transmission model. We simulated the national TB epidemic in the presence and absence of the DOTS programme, measuring lives saved as the difference in TB deaths between these scenarios.

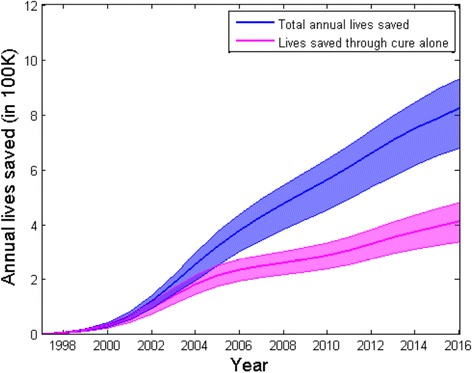
Results: From 1997 to 2016, India's RNTCP has saved 7.75 million lives (95% Bayesian credible interval 6.29-8.82 million). We estimate that 42% of this impact was due to the 'indirect' effects of the RNTCP in averting transmission as well as improving treatment outcomes.

Conclusions: When expanding high-quality TB services, a substantial proportion of overall impact derives from preventive, as well as curative, benefits. Mathematical models, together with sufficient data, can be a helpful tool in estimating the true population impact of major disease control programmes.

Keywords: Deaths averted; India; Modelling; Tuberculosis.


Figures

Fig. 1
Fig. 1
Summary of the compartmental model structure. The left-hand side of this figure corresponds to drug-sensitive TB, while the right-hand side (having compartments labelled with dashes) corresponds to multi-drug-resistant (MDR) TB. The population is divided into different compartments, representing states of disease and care seeking, with flows between compartments given by the rates shown in the diagram (see also Table 1). Concentrating on the left-hand side for illustration, uninfected individuals (U), upon acquiring infection, either enter a state of latent infection (L) or develop pre-treatment active disease (A). The rate r denotes the delay between the start of infectious symptoms and the first TB treatment initiation. We allow here for first-line treatment initiation either under non-RNTCP (T non-RNTCP) providers or under RNTCP (T RNTCP). From either sector a certain proportion of patients may default or fail treatment without being retained in care (B): these patients subsequently seek care again after a given delay. Each of these stages carries a per-capita TB mortality rate, estimated from the literature as described in the main text. Finally, individuals may be cured either through treatment or spontaneously (R). The right-hand side of this figure has slightly more complexity to account for different pathways for MDR diagnosis: these include drug resistance being recognized at the point of TB diagnosis; after non-response to first-line treatment; or not at all. The compartment S'RNTCP denotes MDR-TB patients who are receiving second-line treatment in RNTCP. Further details and model equations are shown in Additional file 1. For clarity, the figure omits exogenous reinfection (which moves individuals from R to L and I, in the same ratios as from U) and relapse (which moves individuals from R to I)
Fig. 2
Fig. 2
Scale-up of RNTCP services. Blue points show data for the proportion of geographical coverage of RNTCP [33], while red points show data for the proportion of geographical coverage of PMDT for MDR-TB [33]. As described in the text, these data were used to determine logistic functions capturing the timing and pace (‘steepness’) of scale-up. Resulting functions are superimposed as blue and red curves, with the following parametric forms: F(t) = 1/[1 + Exp(4 · 2 - 0 · 76* t)] (RNTCP scale-up), G(t) = 1/[1 + Exp(20 - 1 · 37* t)] (PMDT scale-up). Note that a value of 1 on the y-axis does not imply that the proportion of TB patients treated by RNTCP is 100%; rather, this proportion is given by p max F(t), where p max is a parameter to be estimated (see Methods). That is, F(t) (and similarly G(t)) simply represent the proportion of ultimate coverage reached, at a given time during scale-up
Fig. 3
Fig. 3
Model projections for annual TB incidence and prevalence, showing projections in the presence of RNTCP (blue region) and in its absence (red region). To construct these regions, incidence and prevalence curves were determined for each of the parameter sets in the sampled posterior distribution. From the resulting set of curves, upper and lower boundaries for the trajectories were determined using the 2.5th and 97.5th percentiles for incidence and prevalence at each time point. The bold lines represent the epidemic trajectories corresponding to the maximum posterior density (best-fitting parameter set). Circles and uncertainty intervals in black represent WHO estimates for incidence and prevalence
Fig. 4
Fig. 4
Model projections for annual lives saved by RNTCP since 1997. The shaded region, showing a 95% credible interval for the epidemic trajectory, is constructed as described in Fig. 3. The upper region shows overall cumulative lives saved each year, while the lower region aims to control for reducing transmission over time, to show lives saved directly through improved treatment outcomes alone. Broadly, the vertical separation between these regions can be interpreted as the lives saved through indirect effects (reducing transmission)

References

    1. World Health Organization. Global tuberculosis report 2016. World Health Organization 2016. WHO Press, Geneva. WHO/HTM/TB/2016.13.
    1. Raviglione MC, Pio A. Evolution of WHO policies for tuberculosis control, 1948-2001. Lancet. 2002;359(9308):775–80. doi: 10.1016/S0140-6736(02)07880-7. - DOI - PubMed
    1. World Health Organization.A brief history of tuberculosis control in India. 2010. http://apps.who.int/iris/bitstream/10665/44408/1/9789241500159_eng.pdf. Accessed 02 Jan 2017.
    1. World Health Organization. Millennium Development Goals (MDGs) MDG 6: combat HIV/AIDS, malaria and other diseases. 2014. http://www.who.int/topics/millennium_development_goals/diseases/en/. Accessed 13 Sept 2016.
    1. Atun R, Raviglione M, Marais B, Zumla A. Tuberculosis control is crucial to achieve the MDGs. Lancet. 2010;376(9745):940–1. doi: 10.1016/S0140-6736(10)61428-6. - DOI - PMC - PubMed