. 2017 Mar 2;10(1):8.
doi: 10.1186/s13041-017-0288-9.

Rapid and stable changes in maturation-related phenotypes of the adult hippocampal neurons by electroconvulsive treatment

Affiliations

Rapid and stable changes in maturation-related phenotypes of the adult hippocampal neurons by electroconvulsive treatment

Yuki Imoto et al. Mol Brain. .

Abstract

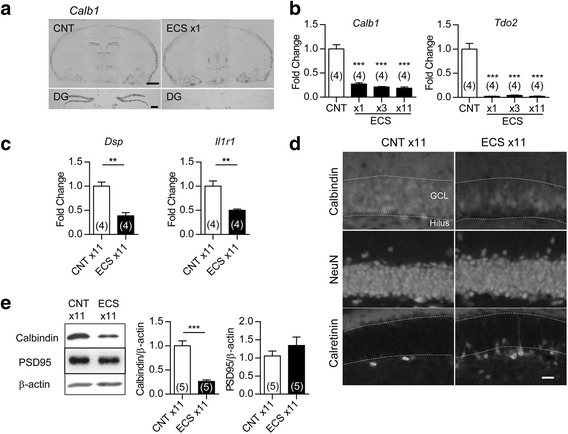
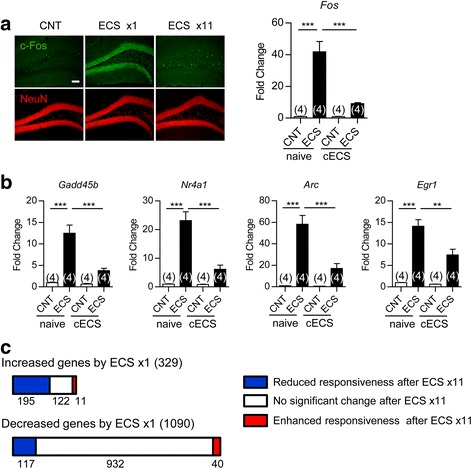
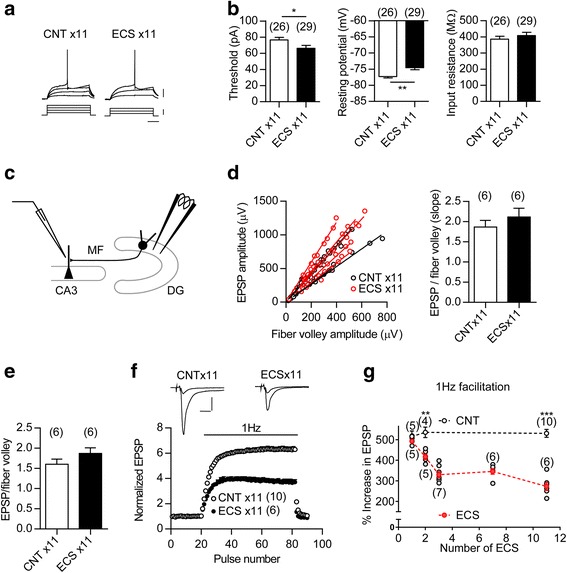
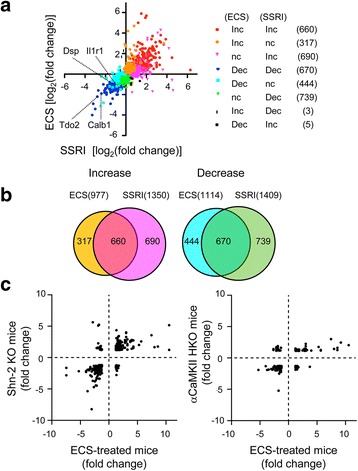
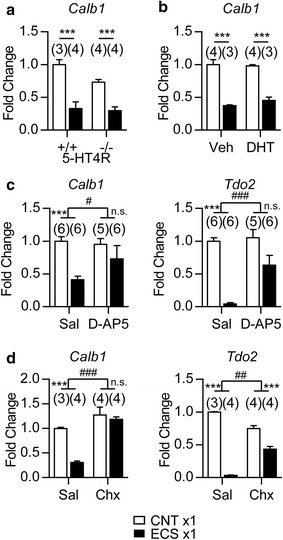
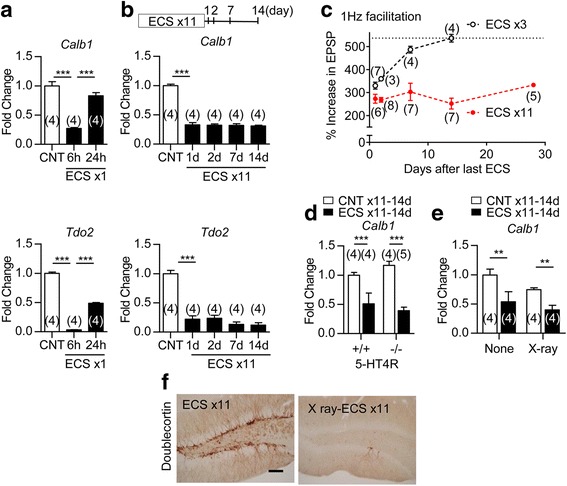
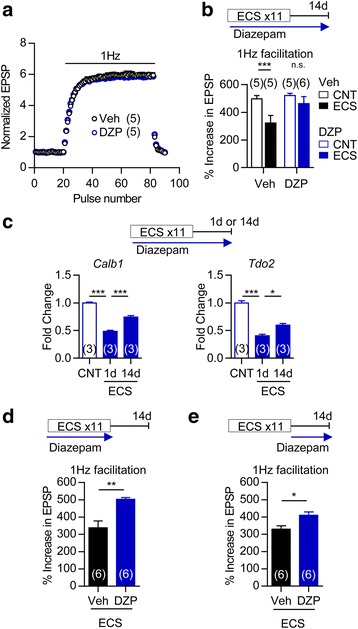
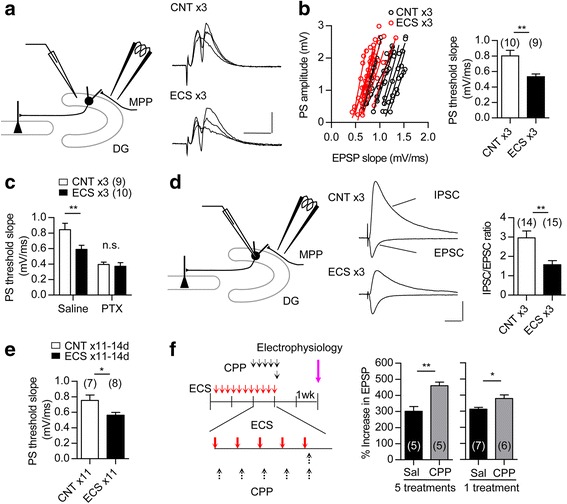
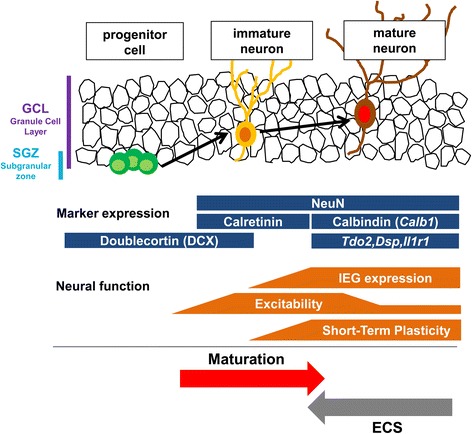
Electroconvulsive therapy (ECT) is a highly effective and fast-acting treatment for depression. Despite a long history of clinical use, its mechanism of action remains poorly understood. Recently, a novel cellular mechanism of antidepressant action has been proposed: the phenotype of mature brain neurons is transformed to immature-like one by antidepressant drug treatments. We show here that electroconvulsive stimulation (ECS), an animal model of ECT, causes profound changes in maturation-related phenotypes of neurons in the hippocampal dentate gyrus of adult mice. Single ECS immediately reduced expression of mature neuronal markers in almost entire population of dentate granule cells. After ECS treatments, granule cells showed some of physiological properties characteristic of immature granule cells such as higher somatic intrinsic excitability and smaller frequency facilitation at the detate-to-CA3 synapse. The rapid downregulation of maturation markers was suppressed by antagonizing glutamate NMDA receptors, but not by perturbing the serotonergic system. While single ECS caused short-lasting effects, repeated ECS induced stable changes in the maturation-related phenotypes lasting more than 2 weeks along with enhancement of synaptic excitation of granule cells. Augmentation of synaptic inhibition or blockade of NMDA receptors after repeated ECS facilitated regaining the initial mature phenotype, suggesting a role for endogenous neuronal excitation in maintaining the altered maturation-related phenotype probably via NMDA receptor activation. These results suggest that brief neuronal activation by ECS induces "dematuration" of the mature granule cells and that enhanced endogenous excitability is likely to support maintenance of such a demature state. The global increase in neuronal excitability accompanying this process may be relevant to the high efficacy of ECT.

Keywords: Antidepressant; Electroconvulsive seizure; Granule cell; Hippocampus; Maturation.


Figures

Fig. 1
Fig. 1
Alteration of GC maturation stage markers in the DG after ECS. a , Representative images of in situ hybridization of Calb1 at 6 h after single ECS or sham (CNT) treatment. Scale bars: upper 1 mm, lower 200 μm. b, The relative expression of Calb1 and Tdo2 at 6 h after the indicated number of ECS (Dunnett’s test following one-way ANOVA: F (3,12) = 69.72, *** P < 0.001 for Calb1, F (3,12) = 67.15, *** P < 0.001 for Tdo2). c, The relative expression of Dsp and Il1r1 after 11 ECS sessions (t (6) = 5.733, ** P < 0.01 for Dsp, t (6) = 4.418, ** P < 0.01 for Il1r1). d, Representative images of immunoreactivity for NeuN, calbindin, and calretinin in DG at 24 h after 11 ECS sessions. GCL: granule cell layer. Scale bar: 20 μm. e, Immunoblot detections of reduced calbindin D-28 K expression (t (8) = 6.899, *** P < 0.001) and intact PSD-95 expression in DG (t (8) = 1.082, P = 0.31). The n number is given in graph. Data are presented as means ± SEM
Fig. 2
Fig. 2
Altered stimulus-induced gene expression in DG after repeated ECS. a, Left: representative images of immunoreactivity for c-fos and NeuN at 2 h after the last ECS. Scale bar, 100 μm. Right: the sham (CNT) treatment or ECS was applied to naive mice or mice treated with 10 times of chronic ECS (cECS). The expression of Fos at 1 h after the last treatment was examined (Tukey’s test following one-way ANOVA: F (3,12) = 35.77, *** P < 0.001). b, The relative expression of other IEGs (Gadd45b, Nr4a1, Arc, and Egr1) mRNA at 1 h after the last ECS or control treatment (Tukey’s test following one-way ANOVA: F (3,12) = 31.16, *** P < 0.001 for Gadd45b, F (3,12) = 38.36, *** P < 0.001 for Nr4a1, F (3,12) = 33.39, *** P < 0.001 for Arc, F (3,12) = 39.82, ** P < 0.01, *** P < 0.001 for Egr1). c, The number of genes that showed a significant increase or decrease by a single ECS-treatment is represented in bars. The three groups that were categorized according to expression change by repeated ECS were color-coded. The n number is given in graph. Data are presented as means ± SEM
Fig. 3
Fig. 3
Immature-like functional properties of GC soma and output synapse after ECS treatment. a, Membrane potential changes (upper) induced by depolarizing currents (lower) in GCs. Scale bars: 100 ms, 20 mV, 40 pA. b, Left: the threshold current intensity required to evoke a single spike (t (53) = 2.157, * P =0.0356). Center: resting membrane potential (t (48) = 3.475, ** I = 0.0011, Student’s t-test with Welch’s correction). Right: input resistance. The number (n) represents the number of cells. c, A diagram showing the electrode arrangement for recording field EPSPs at the MF-CA3 synapse. d, No significant change in the input-output relationship at the MF synapse. Left: The relationship between field EPSP and fiber volley amplitude was examined by changing stimulus intensities. Right: The slope value of regression line is shown (t (10) = 0.9684, P = 0.3557). The n number represents the number of slices. e, No significant change in MF field EPSP to fiber volley ratios at the baseline stimulus intensity (t (10) = 0.9324, P = 0.3731). f, Reduction of 1-Hz frequency facilitation at the MF synapse after repeated ECS. Inset: sample recordings of MF field EPSPs during baseline and 1-Hz stimulation. Scale bars: 10 ms, 0.5 mV. g, Reduction of frequency facilitation at the MF synapse after ECS repeated twice or more times (ECS × 2, t (7) = 4.364, ** P = 0.0033; ECS × 11, t (14) = 8.832, *** P < 0.001). Both individual (grey) and mean data (red) are shown for ECS-treated groups. The number (n) is shown in the graph. Data are presented as means ± SEM
Fig. 4
Fig. 4
Shared gene expression changes in repeated ECS-treated DG, chronic SSRI-treated DG and hippocampus of mutant mice with altered DG maturation. a, Scatter correlation graph of gene expression changes [log2(fold-change)] between repeated ECS-treated and chronic SSRI-treated DGs. The gene probes (3,531) that showed significant changes by either ECS- or SSRI-treatment in microarray analysis are shown. The eight groups that were categorized according to expression change by ECS and/or SSRI treatment were color-coded. b, The number of genes that showed significant expression changes by either ECS- or SSRI-treatment are represented in a Venn diagram. The color corresponds to that in (a). c, Scatter correlation graph illustrating the fold change for gene expression levels in the DG from repeated ECS-treated mice, the hippocampus from Shn-2 KO mice (558 gene probes, left), and the hippocampus from αCaMKII hetero KO mice (190 gene probes, right). The genes that showed statistically significant and more than 1.2-fold changes in both the DG from ECS-treatment mice and the hippocampus from mutant mice were selected
Fig. 5
Fig. 5
NMDA receptor activation and de novo protein synthesis are involved in the rapid downregulation of maturation markers by ECS. a, The relative expression of Calb1 in 5-HT4R-KO (-/-) mice at 6 h after a single ECS (*** P < 0.001, Bonferroni’s post hoc test following two-way ANOVA). b, The relative expression of Calb1 in mice treated with 5,7-DHT (i.c.v.) at 6 h after a single ECS (*** P < 0.001, Bonferroni’s post hoc test following two-way ANOVA). Veh: vehicle. c, The relative expression of Calb1 and Tdo2 at 6 h after a single ECS in mice treated with D-AP5 (1 μg/mouse, interaction [D-AP5 × ECS]; F (1,19) = 7.07 for Calb1, # P < 0.05, F (1,19) = 15.7 for Tdo2, ### P < 0.001). d, The relative expression of Calb1 and Tdo2 at 6 h after a single ECS in mice treated with cycloheximide (Chx; 200 mg/kg, i.p., interaction [cycloheximide × ECS]; F (1,11) = 11.35 for Calb1, ### P < 0.001, F (1,11) = 149.1 for Tdo2, ## P < 0.01). Bonferroni’s post hoc test following two-way ANOVA, *** P < 0.001, n.s., not significant. Sal: saline. The number (n) is shown in the graph. Data are presented as means ± SEM
Fig. 6
Fig. 6
Long-lasting phenotypic change in GCs after repeated ECS. a, b, The relative expression of Calb1 and Tdo2 at indicated time intervals after single (a) or repeated (b) ECS (a, Tukey’s test following one-way ANOVA: F (2,9) = 54.21, *** P < 0.001 for Calb1, F (2,9) = 1048, *** P < 0.001 for Tdo2, b, F (4,15) = 123, *** P < 0.001 for Calb1, F (4,15) = 53.67, *** P < 0.001 for Tdo2). c, Frequency facilitation tested at various time intervals after three or 11 times of ECS. d, The relative expression of Calb1 was compared between 5-HT4R-KO (-/-) mice and wild-type (+/+) mice at 14 days after 11 times of ECS (*** P < 0.001, Bonferroni’s post hoc test following two-way ANOVA). e, The effect of X-ray (10 Gy) on the reduction of Calb1 at 14 days after 11 times of ECS. (** P < 0.01, Bonferroni’s post hoc test following two-way ANOVA). f, Representative images of immunoreactivity for doublecortin in non-irradiated (ECS × 11) or irradiated (X-ray-ECS × 11) mice at 14 days after 11 times of ECS. Scale bar: 200 μm. The number (n) is shown in the graph. Data are presented as means ± SEM
Fig. 7
Fig. 7
Augmentation of GABAergic signalling reverses long-lasting phenotypic change. a, No significant difference was seen in frequent facilitation at the MF synapse between mice treated with diazepam (DZP, 5 mg/kg) and vehicle (Veh) for 3 weeks. b, Frequency facilitation at 14 days after 11 times of ECS in mice treated with 5 mg/kg diazepam or vehicle (*** P < 0.001, Bonferroni’s test following two-way ANOVA, interaction [drug treatment × ECS]; F (1,17) = 7.39, P = 0.0146). c, The relative expression of Calb1 and Tdo2 at 1 day or 14 days after 11 times of ECS in mice treated with 10 mg/kg diazepam (Tukey’s test following one-way ANOVA: F (2,6) = 122.1, *** P < 0.001 for Calb1, F (2,6) = 90.9, * P < 0.05, *** P < 0.001 for Tdo2). d, Effects of diazepam on frequency facilitation at 14 days after 11 times of ECS. Diazepam (5 mg/kg) was administered during the period of ECS treatments (t (10) = 4.062, P = 0.0097). e, Effects of diazepam (10 mg/kg) administered after 11 times of ECS on the lasting reduction of frequency facilitation (t (10) = 2.873, P = 0.0166). The number (n) is shown in the graph. Data are presented as means ± SEM
Fig. 8
Fig. 8
Enhanced synaptic activation in GCs after repeated ECS. a, Left: A diagram showing the electrode arrangement for recording GC population spikes (PSs) evoked by MPP stimulation. Right: Sample recordings of PSs evoked at three different intensities. Scale bars: 10 ms, 1 mV. b, Left: The relationship between field EPSP slope and PS amplitude recorded in the GC layer after three times of ECS. Right: X-intercepts of linear regression lines were measured to determine the threshold EPSP slope for evoking PS. (t (13) = 3.356, ** P = 0.0052, Student’s t-test with Welch’s correction, n represents the number of slices). c, Threshold EPSP slope for evoking PS in absence and presence of picrotoxin (100 μM, PTX) in the same slices after three times of ECS. A significant difference between CNT and ECS was observed only in the absence of PTX (Bonferroni’s test following two-way repeated measure ANOVA; Saline, ** P < 0.01, interaction [drug treatment × ECS]; F (1,17) = 8.14, P = 0.011, n represents the number of slices). d, Left: A diagram showing the electrode arrangement for recording evoked postsynaptic currents. Center: EPSCs and monosynaptic IPSCs recorded in the same GCs. Scale bars: 20 ms, 100 pA. Right: Reduced IPSC/EPSC ratios after three times of ECS (t (27) = 3.375, ** P = 0.0023, n represents the number of cells). e, Threshold EPSP slopes for evoking PS at 14 days after 11 times of ECS (t (13) = 2.543, * P = 0.0245, n represents number of slices). f, Effect of CPP (1 or 5 treatments at 20 mg/kg) injected after each ECS as indicated on frequency facilitation at 14 days after 11 times of ECS (1 treatment: t (11) = 2.73, * P = 0.0196, 5 treatments: t (8) = 4.293, ** P = 0.0026). The number (n) is shown in the graph. Data are presented as means ± SEM
Fig. 9
Fig. 9
Models of changes in maturation-related phenotypes of the adult GCs by ECS. Developmental stages of GCs in the DG can be identified by stage marker expression and neuronal function

References

    1. Harrison PJ. The hippocampus in schizophrenia: a review of the neuropathological evidence and its pathophysiological implications. Psychopharmacology. 2003;174:151-62. - PubMed
    1. Yamasaki N, Maekawa M, Kobayashi K, Kajii Y, Maeda J, Soma M, Takao K, Tanda K, Ohira K, Toyama K, et al. Alpha-CaMKII deficiency causes immature dentate gyrus, a novel candidate endophenotype of psychiatric disorders. Mol Brain. 2008;1:6. doi: 10.1186/1756-6606-1-6. - DOI - PMC - PubMed
    1. Kobayashi K. Targeting the hippocampal mossy fiber synapse for the treatment of psychiatric disorders. Mol Neurobiol. 2009;39:24–36. doi: 10.1007/s12035-008-8049-5. - DOI - PubMed
    1. Segi-Nishida E. Exploration of new molecular mechanisms for antidepressant actions of electroconvulsive seizure. Biol Pharm Bull. 2011;34:939–44. doi: 10.1248/bpb.34.939. - DOI - PubMed
    1. Walton NM, Zhou Y, Kogan JH, Shin R, Webster M, Gross AK, Heusner CL, Chen Q, Miyake S, Tajinda K, et al. Detection of an immature dentate gyrus feature in human schizophrenia/bipolar patients. Transl Psychiatry. 2012;2:e135. doi: 10.1038/tp.2012.56. - DOI - PMC - PubMed

Publication types

MeSH terms