

Relationship Between Physical Activity, Body Mass Index, and Risk of Heart Failure
- PMID: 28254175
- PMCID: PMC5848099
- DOI: 10.1016/j.jacc.2016.11.081
Relationship Between Physical Activity, Body Mass Index, and Risk of Heart Failure
Abstract
Background: Lower leisure-time physical activity (LTPA) and higher body mass index (BMI) are independently associated with risk of heart failure (HF). However, it is unclear if this relationship is consistent for both heart failure with preserved ejection fraction (HFpEF) and heart failure with reduced ejection fraction (HFrEF).
Objectives: This study sought to quantify dose-response associations between LTPA, BMI, and the risk of different HF subtypes.
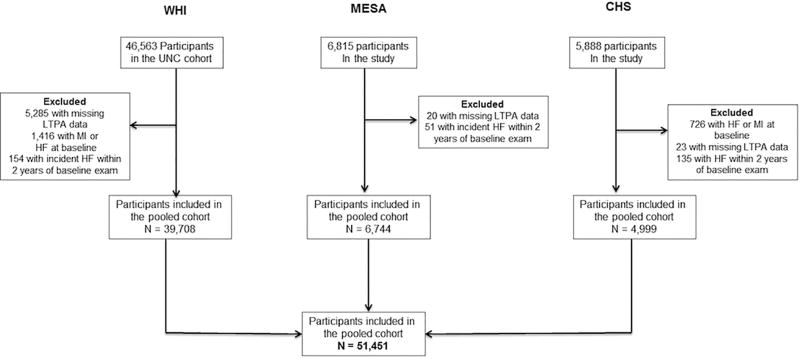
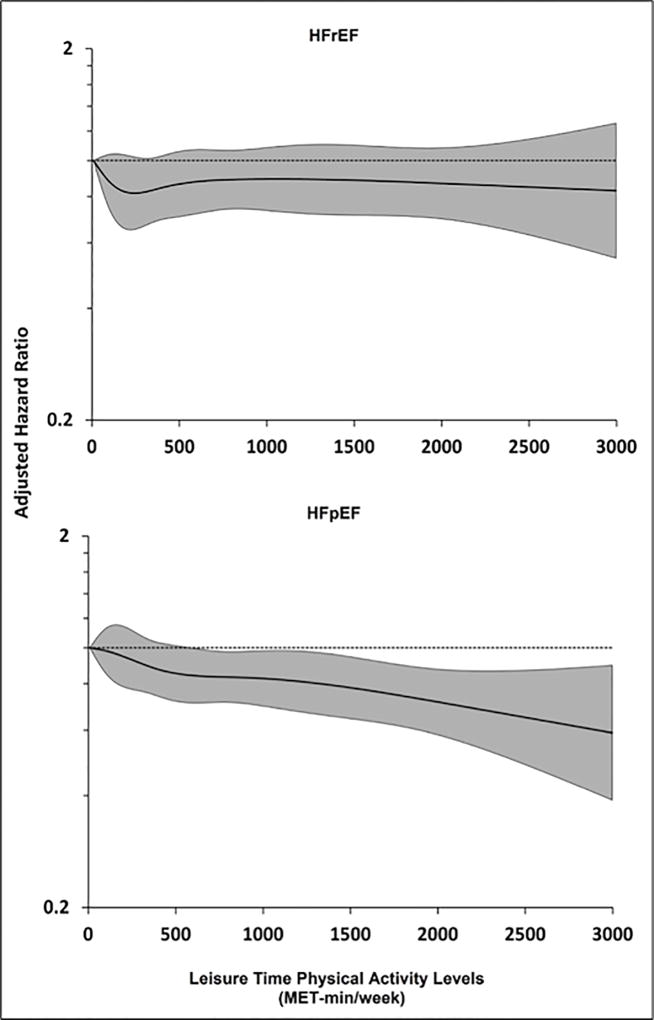
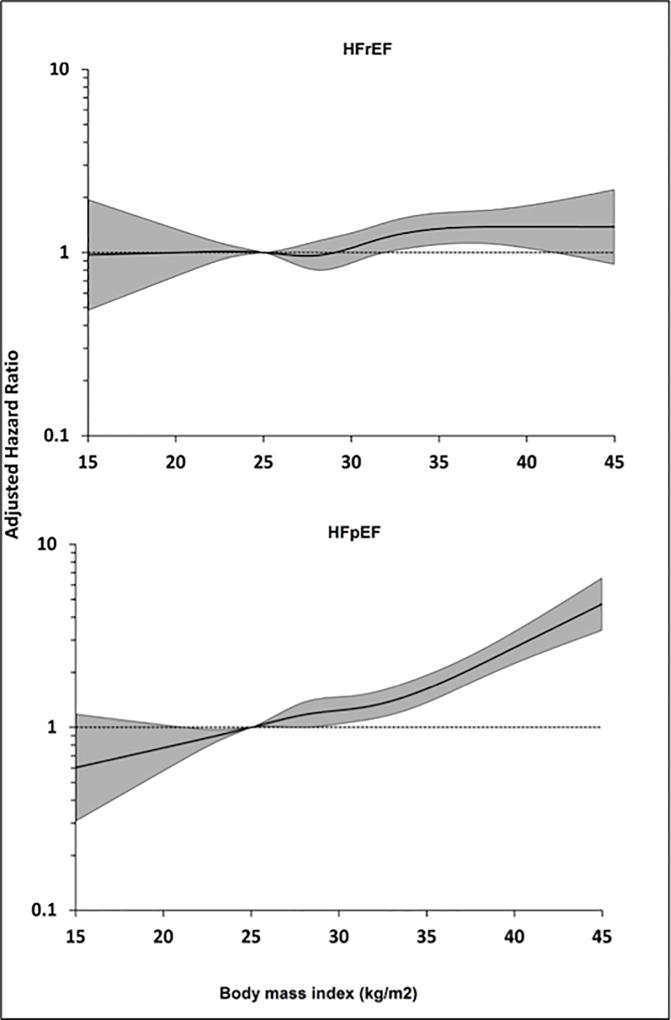
Methods: Individual-level data from 3 cohort studies (WHI [Women's Health Initiative], MESA [Multi-Ethnic Study of Atherosclerosis], and CHS [Cardiovascular Health Study]) were pooled and participants were stratified into guideline-recommended categories of LTPA and BMI. Associations between LTPA, BMI, and risk of overall HF, HFpEF (ejection fraction ≥45%), and HFrEF (ejection fraction <45%) were assessed by using multivariable adjusted Cox models and restricted cubic splines.
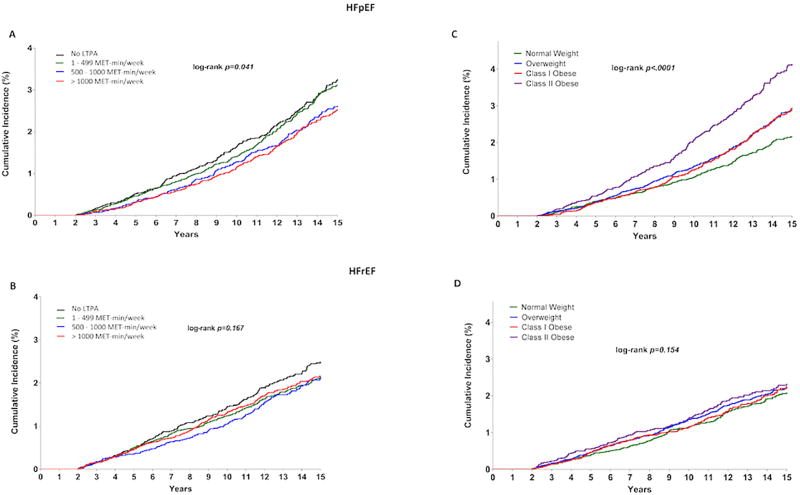
Results: The study included 51,451 participants with 3,180 HF events (1,252 HFpEF, 914 HFrEF, and 1,014 unclassified HF). In the adjusted analysis, there was a dose-dependent association between higher LTPA levels, lower BMI, and overall HF risk. Among HF subtypes, LTPA in any dose range was not associated with HFrEF risk. In contrast, lower levels of LTPA (<500 MET-min/week) were not associated with HFpEF risk, and dose-dependent associations with lower HFpEF risk were observed at higher levels. Compared with no LTPA, higher than twice the guideline-recommended minimum LTPA levels (>1,000 MET-min/week) were associated with an 19% lower risk of HFpEF (hazard ratio: 0.81; 95% confidence interval: 0.68 to 0.97). The dose-response relationship for BMI with HFpEF risk was also more consistent than with HFrEF risk, such that increasing BMI above the normal range (≥25 kg/m2) was associated with a greater increase in risk of HFpEF than HFrEF.
Conclusions: Our study findings show strong, dose-dependent associations between LTPA levels, BMI, and risk of overall HF. Among HF subtypes, higher LTPA levels and lower BMI were more consistently associated with lower risk of HFpEF compared with HFrEF.
Keywords: body mass index; dose–response relationship; heart failure; physical activity.
Copyright © 2017 American College of Cardiology Foundation. Published by Elsevier Inc. All rights reserved.
Figures
Comment in
-
Sedentary Lifestyle and the Risk for HFpEF: Are "Huff-Puff Health Clubs" the Answer?J Am Coll Cardiol. 2017 Mar 7;69(9):1143-1146. doi: 10.1016/j.jacc.2017.01.010. J Am Coll Cardiol. 2017. PMID: 28254176 No abstract available.
References
-
- Dhingra A, Garg A, Kaur S, et al. Epidemiology of heart failure with preserved ejection fraction. Curr Heart Fail Rep. 2014;11:354–65. - PubMed
-
- Bhatia RS, Tu JV, Lee DS, et al. Outcome of heart failure with preserved ejection fraction in a population-based study. N Engl J Med. 2006;355:260–9. - PubMed
-
- Owan TE, Hodge DO, Herges RM, Jacobsen SJ, Roger VL, Redfield MM. Trends in prevalence and outcome of heart failure with preserved ejection fraction. N Engl J Med. 2006;355:251–9. - PubMed
-
- Holland DJ, Kumbhani DJ, Ahmed SH, Marwick TH. Effects of treatment on exercise tolerance, cardiac function, and mortality in heart failure with preserved ejection fraction. A meta-analysis. J Am Coll Cardiol. 2011;57:1676–86. - PubMed
MeSH terms
Grants and funding
- N01 HC095161/HL/NHLBI NIH HHS/United States
- N01 HC095168/HL/NHLBI NIH HHS/United States
- U01 HL130114/HL/NHLBI NIH HHS/United States
- HHSN268201100046C/HL/NHLBI NIH HHS/United States
- N01 HC095159/HL/NHLBI NIH HHS/United States
- HHSN268201200036C/HL/NHLBI NIH HHS/United States
- N01 HC095163/HL/NHLBI NIH HHS/United States
- HHSN268201500003I/HL/NHLBI NIH HHS/United States
- HHSN268201100001C/WH/WHI NIH HHS/United States
- N01 HC095160/HL/NHLBI NIH HHS/United States
- HHSN268201100001I/HL/NHLBI NIH HHS/United States
- N01 HC085080/HL/NHLBI NIH HHS/United States
- HHSN268201500003C/HL/NHLBI NIH HHS/United States
- UL1 TR001412/TR/NCATS NIH HHS/United States
- U01 HL080295/HL/NHLBI NIH HHS/United States
- UL1 TR001079/TR/NCATS NIH HHS/United States
- N01 HC095169/HL/NHLBI NIH HHS/United States
- N01 HC085082/HL/NHLBI NIH HHS/United States
- HHSN268201100004I/HL/NHLBI NIH HHS/United States
- HHSN268200800007C/HL/NHLBI NIH HHS/United States
- N01 HC085086/HL/NHLBI NIH HHS/United States
- N01 HC085083/HL/NHLBI NIH HHS/United States
- HHSN268201100003C/WH/WHI NIH HHS/United States
- N01 HC095167/HL/NHLBI NIH HHS/United States
- N01 HC055222/HL/NHLBI NIH HHS/United States
- HHSN271201100004C/AG/NIA NIH HHS/United States
- N01 HC085079/HL/NHLBI NIH HHS/United States
- HHSN268201100002C/WH/WHI NIH HHS/United States
- UL1 TR000040/TR/NCATS NIH HHS/United States
- HHSN268201100003I/HL/NHLBI NIH HHS/United States
- HHSN268201100002I/HL/NHLBI NIH HHS/United States
- N01 HC095166/HL/NHLBI NIH HHS/United States
- N01 HC095162/HL/NHLBI NIH HHS/United States
- R01 AG023629/AG/NIA NIH HHS/United States
- N01 HC095165/HL/NHLBI NIH HHS/United States
- N01 HC095164/HL/NHLBI NIH HHS/United States
- N01 HC085081/HL/NHLBI NIH HHS/United States
- HHSN268201100004C/WH/WHI NIH HHS/United States
LinkOut - more resources
Full Text Sources
Other Literature Sources
Medical
Research Materials
Miscellaneous
