. 2017 Mar;29(3):543-559.
doi: 10.1105/tpc.16.00583. Epub 2017 Mar 2.

Cytokinin-Mediated Regulation of Reactive Oxygen Species Homeostasis Modulates Stomatal Immunity in Arabidopsis

Affiliations

Cytokinin-Mediated Regulation of Reactive Oxygen Species Homeostasis Modulates Stomatal Immunity in Arabidopsis

Dominique Arnaud et al. Plant Cell. 2017 Mar.

Abstract

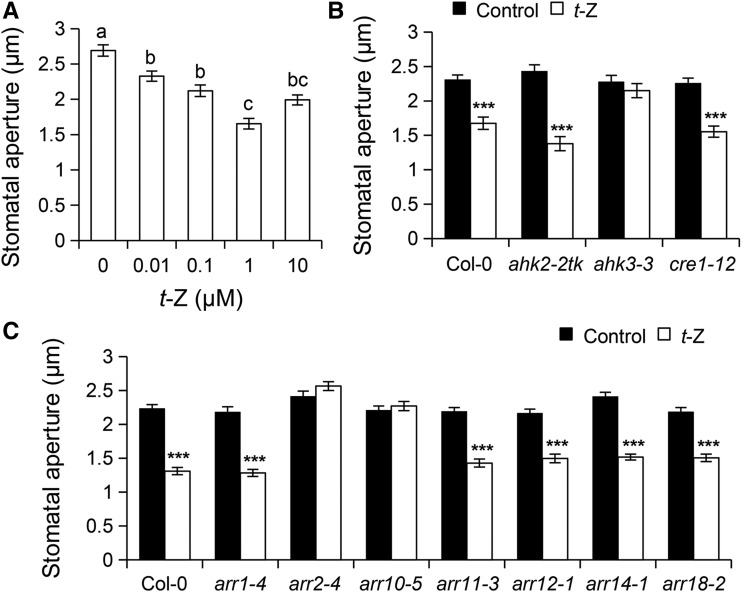
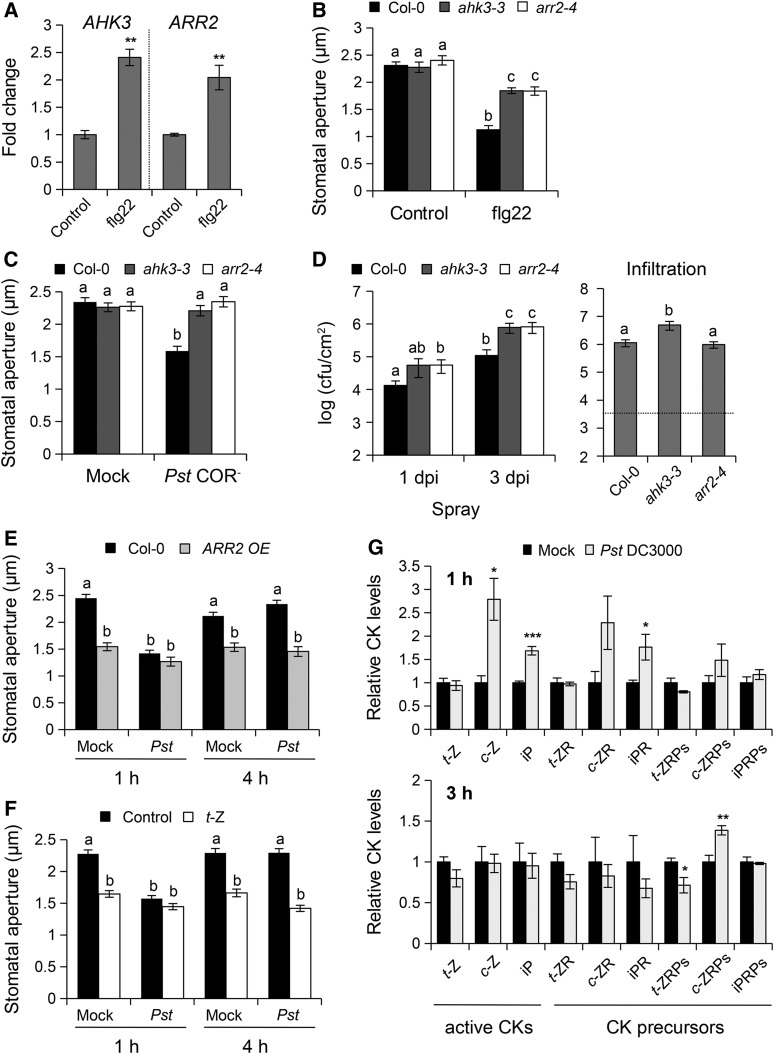
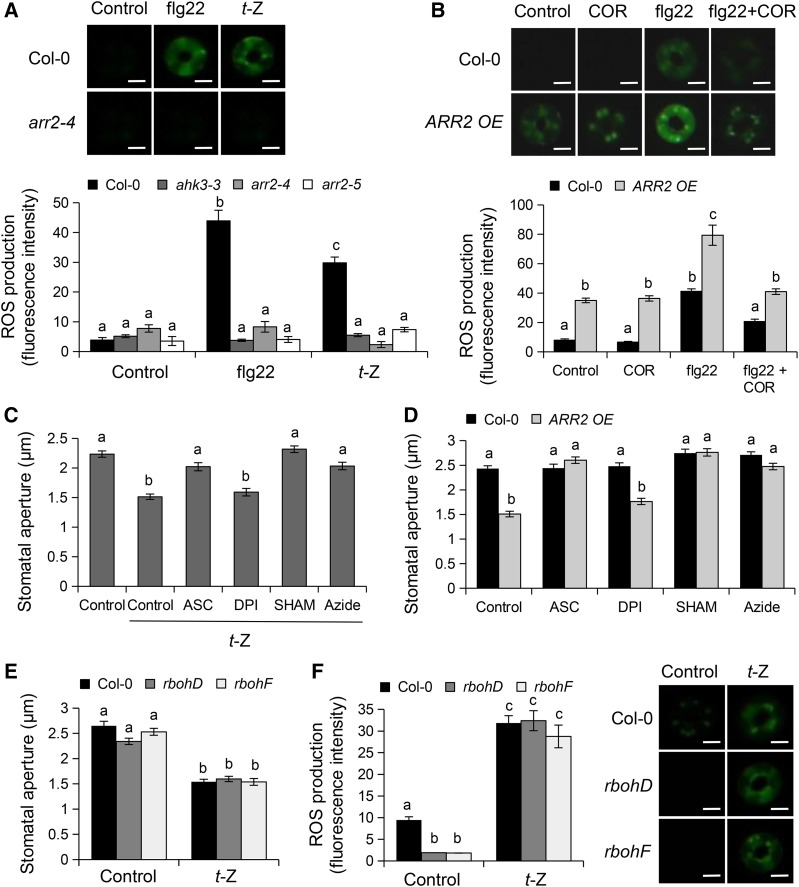
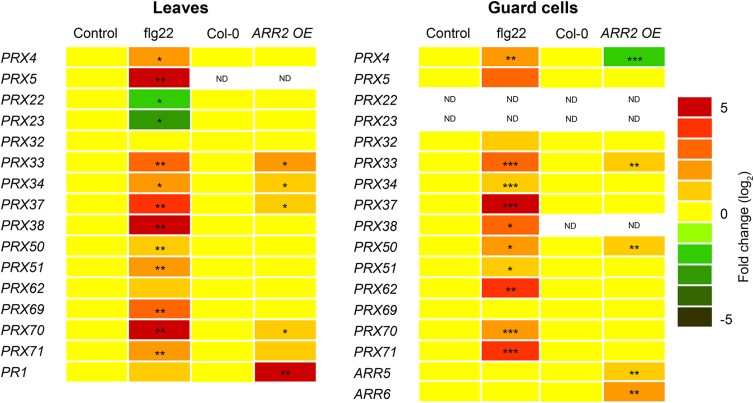
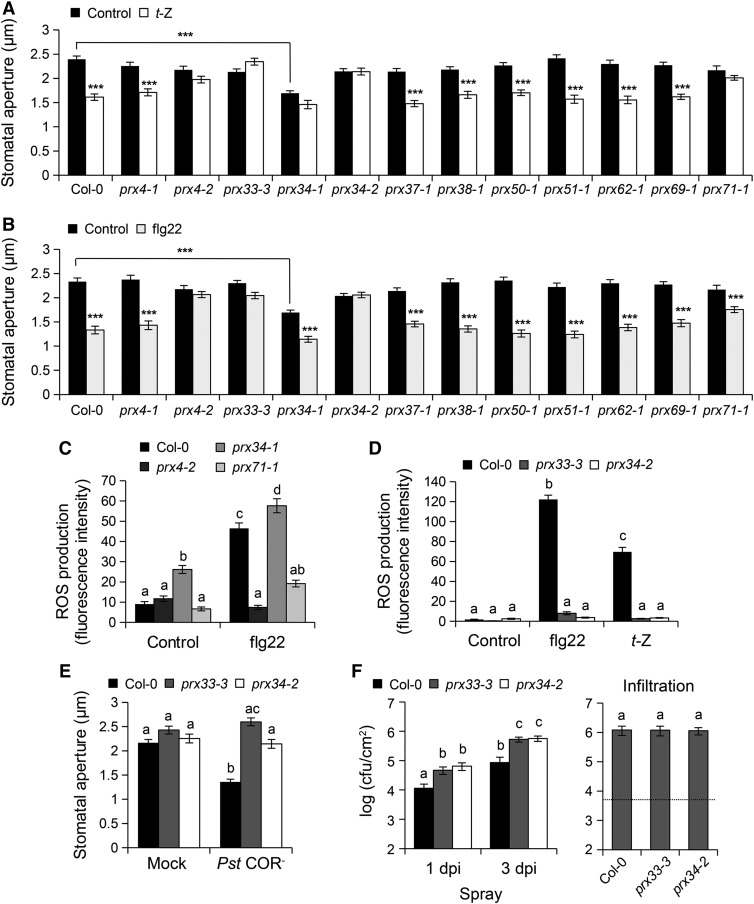
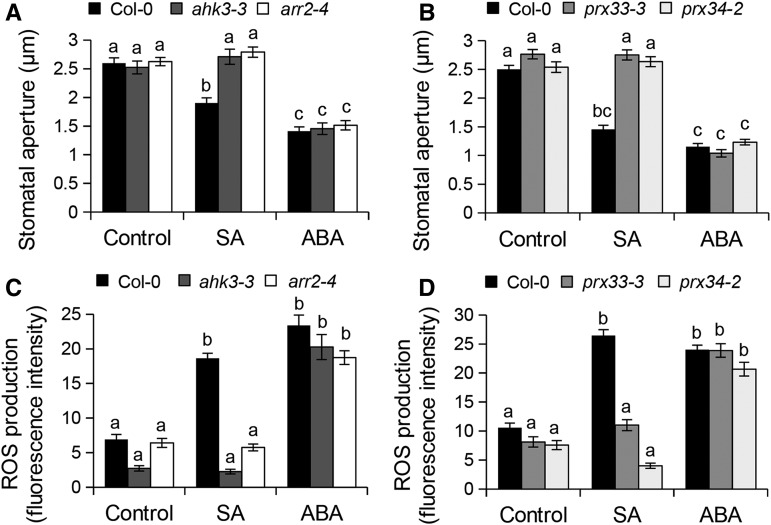
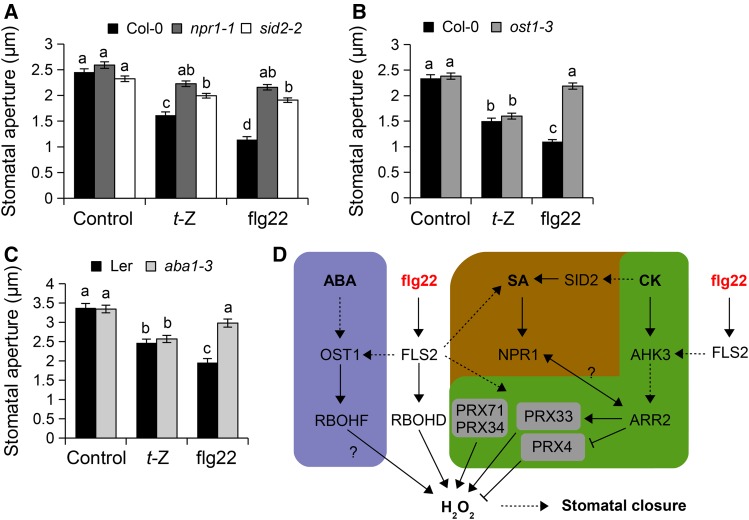
Stomata play an important role in preinvasive defense responses by limiting pathogen entry into leaves. Although the stress hormones salicylic acid (SA) and abscisic acid (ABA) are known to regulate stomatal immunity, the role of growth promoting hormones is far from understood. Here, we show that in Arabidopsis thaliana, cytokinins (CKs) function in stomatal defense responses. The cytokinin receptor HISTIDINE KINASE3 (AHK3) and RESPONSE REGULATOR2 (ARR2) promote stomatal closure triggered by pathogen-associated molecular pattern (PAMP) and resistance to Pseudomonas syringae pv tomato bacteria. Importantly, the cytokinin trans-zeatin induces stomatal closure and accumulation of reactive oxygen species (ROS) in guard cells through AHK3 and ARR2 in an SA-dependent and ABA-independent manner. Using pharmacological and reverse genetics approaches, we found that CK-mediated stomatal responses involve the apoplastic peroxidases PRX4, PRX33, PRX34, and PRX71, but not the NADPH oxidases RBOHD and RBOHF. Moreover, ARR2 directly activates the expression of PRX33 and PRX34, which are required for SA- and PAMP-triggered ROS production. Thus, the CK signaling pathway regulates ROS homeostasis in guard cells, which leads to enhanced stomatal immunity and plant resistance to bacteria.


Figures

Figure 1.
Figure 1.
Cytokinin Induces Stomatal Closure through AHK3, ARR2, and ARR10. (A) Stomatal response of Arabidopsis Col-0 wild-type epidermal peels to different concentrations of t-Z. Results are shown as the mean of ≥100 stomata measurements ±se. Different letters indicate significant differences at P < 0.01 based on a Tukey’s HSD test (see ANOVA table; Supplemental Data Set 1). (B) and (C) Stomatal apertures in epidermal peels of Col-0 wild type, cytokinin receptor mutants (B), and type-B response regulator mutants (C) after 2 h of incubation with control solution (10 µM NaOH) or 1 µM t-Z. Results are shown as the mean of ≥100 stomata measurements ±se. Asterisks indicate significant differences between control and t-Z treatment based on a two-tailed Student's t test (**P < 0.01; ***P < 0.001).
Figure 2.
Figure 2.
The CK Signaling Components AHK3 and ARR2 Participate in Stomatal Immunity. (A) RT-qPCR analysis of AHK3 and ARR2 transcript levels in guard cell protoplasts after treatment with control solution (MES buffer) or 1 µM flg22 for 2 h. Transcript levels were normalized to UBQ1. Error bars indicate se of three independent experiments (n = 3). Asterisks indicate statistically significant differences between control and flg22 treatments based on a two-tailed Student's t test (**P < 0.01). (B) and (C) Stomatal apertures in wild-type Col-0, ahk3-3, and arr2-4 mutants exposed to Control solution and 5 µM flg22 (B) or mock control (10 mM MgCl2) and 108 cfu/mL COR-deficient Pst DC3000 (Pst COR) bacteria (C) for 2 h. Data are means ± se (n ≥ 100). (D) Bacterial growth in wild-type Col-0, ahk3-3, and arr2-4 mutants assessed at 1 d (1 dpi) and 3 d (3 dpi) after spray inoculation with Pst COR at 108 cfu/mL (left panel) or at 0 and 3 d after syringe infiltration with Pst COR at 106 cfu/mL (right panel). The dashed line indicates the apoplastic bacterial population (cfu/cm2) at 0 d postinoculation. Values are the means ± se (n = 4). (E) and (F) t-Z or ARR2 overexpression inhibits Pst DC3000-mediated stomatal reopening. Stomatal apertures in Col-0 and the ARR2 overexpressing (ARR2 OE) line (E) or Col-0 wild type treated with 1 µM t-Z or control solution (F) exposed to mock control or 108 cfu/mL Pst DC3000 (Pst) for 1 and 4 h. Data are means ± se (n ≥ 100). Different letters indicate significant differences at P < 0.05 (D) and P < 0.001 ([B], [C], [E], and [F]) based on a Tukey’s HSD test (see ANOVA tables; Supplemental Data Set 1). (G) Relative CK levels in Col-0 wild-type leaves after infiltration with mock control (10 mM MgCl2) and 108 cfu/mL Pst DC3000 bacteria for 1 h (upper panel) and 3 h (lower panel). CK concentration was calculated as pmol/g dry weight, and the relative levels of CKs were normalized to a value of 1 in mock-treated control. Data represent the means and se values of three independent biological replicates. Asterisks indicate significant difference between mock and Pst DC3000 treatments based on a two-tailed Student's t test (*P < 0.05; **P < 0.01; ***P < 0.001).
Figure 3.
Figure 3.
Cytokinin Induces ROS Production and Stomatal Closure through Apoplastic Peroxidases. (A) ROS production detected by H2DCF-DA fluorescence in guard cells of Col-0 wild type, ahk3-3, arr2-4, and arr2-5 mutants 30 min after treatment with control solution, 5 µM flg22, or 1 µM t-Z. (B) Coronatine reduces flg22-mediated ROS accumulation. ROS production detected by H2DCF-DA fluorescence in guard cells of Col-0 wild type and ARR2 overexpression (OE) lines 30 min after treatment with control solution or 5 µM flg22. Peels were incubated with 1.6 µM COR for 30 min before the addition of flg22 (flg22+COR). In (A) and (B), a representative stomate is shown (upper panel). Bars = 5 µm. (C) Stomatal aperture in Col-0 wild type exposed to control solutions, 1 µM t-Z, and 1 µM t-Z together with 1 mM ASC, 20 µM DPI, 2 mM SHAM, or 1 µM sodium azide for 3 h. (D) Stomatal aperture in Col-0 wild-type and ARR2 OE lines exposed to control solution, 1 mM ASC, 20 µM DPI, 2 mM SHAM, or 1 µM sodium azide for 3 h. (E) Stomatal apertures in Col-0 wild type, rbohD, and rbohF mutants after 2 h of incubation with control solution or 1 µM t-Z. In (C) to (E), values are means ± se (n ≥ 100). (F) ROS detected by H2DCF-DA fluorescence in guard cells of wild-type Col-0, rbohD, and rbohF mutants 30 min after treatments with control solution and 1 µM t-Z. In (A), (B), and (F), values are means ± se (n ≥ 60 stomata). Different letters indicate significant differences at P < 0.001 ([A] to [E]) and P < 0.05 (F) based on a Tukey’s HSD test (see ANOVA tables; Supplemental Data Set 1). A representative stomate is shown (right panel). Bars = 5 µm.
Figure 4.
Figure 4.
Expression of PRX Genes in Leaves and Guard Cells after PAMP Treatment or in the ARR2 Overexpression Line. Expression analysis of PAMP-inducible PRX genes in leaves (left panel) and guard cell protoplasts (right panel) after flg22 or control treatments for 2 h, and in Col-0 wild-type and ARR2-overexpressing lines (ARR2 OE). Transcript levels were determined by RT-qPCR and normalized to both UBQ1 and EF1. PR1, ARR5, and ARR6 were used as positive controls. The changes in transcript levels relative to Col-0 are color-coded. ND, not detected. Asterisks indicate statistically significant differences between wild-type and ARR2 OE lines or between control and flg22 treatments based on a two-tailed Student’s t test (*P < 0.05; **P < 0.01; ***P < 0.01). Numerical expression values are shown in Supplemental Tables 2 and 3.
Figure 5.
Figure 5.
PRX4, PRX33, PRX34, and PRX71 Are Involved in flg22- and t-Z-Mediated Stomatal Closure. (A) and (B) Stomatal apertures in Col-0 wild-type and prx mutants exposed to control solution, 5 µM flg22 (A), or 1 µM t-Z (B) for 2 h. Values are means ± se (n ≥ 100). Asterisks indicate significant differences between control and flg22 or t-Z treatments based on a t test (***P < 0.001). (C) and (D) ROS production detected by H2DCF-DA fluorescence in guard cells of Col-0 wild-type, prx4-2, prx34-1, and prx71-1 mutants (C) and prx33-3 and prx34-2 mutants (D) 30 min after treatments with control solution, 5 µM flg22, or 1 µM t-Z. Values are means ± se (n ≥ 60). (E) Stomatal apertures in Col-0 wild-type, prx33-3, and prx34-2 mutants exposed to mock control or 108 cfu/mL COR-deficient Pst DC3000 (Pst COR) bacteria for 2 h. Values are means ± se (n ≥ 100). In (C) to (E), different letters denote significant differences at P < 0.001 (Tukey’s HSD test). (F) Bacterial growth in Col-0 wild-type, prx33-3, and prx34-2 mutants assessed at 1 d (1 dpi) and 3 d (3 dpi) after spray inoculation with Pst COR at 108 cfu/mL (left panel) or at 0 and 3 d after syringe infiltration with Pst COR at 106 cfu/mL (right panel). The dashed line indicates the apoplastic bacterial population (cfu/cm2) at 0 d postinoculation. Values are the means ± se (n = 4). Different letters indicate significant differences at P < 0.05 based on a Tukey’s HSD test (see ANOVA tables; Supplemental Data Set 1).
Figure 6.
Figure 6.
ARR2 Directly Regulates PRX4, PRX33, PRX34, and PRX71 Expression. (A) Schematic representation of PRX4, PRX33, PRX34, and PRX71 genes, with dots indicating putative ARR binding motifs (AGATT), and black and gray boxes the exons and untranslated region, respectively. Positions of PCR primers for ChIP are indicated by letters (a to h). (B) ChIP in Col-0 and ARR2-HA OE plants followed by qPCR of the PRX4, PRX33, PRX34, and PRX71 promoters. ARR5 and EF1 promoters were used as positive and negative controls, respectively. qPCR results were normalized against the input samples and fold enrichment was calculated by calculating the ratios between normalized results from ARR2-HA OE and Col-0 (wild type) plants. Error bars represent se of three independent experiments. (C) and (D) Stomatal apertures (C) and ROS production detected by H2DCF-DA fluorescence in guard cells (D) of the wild-type Col-0 and ARR2 OE, ARR2 OE/prx33-3, and ARR2 OE/prx34-2 lines exposed to control solution, 5 µM flg22, or 1 µM t-Z. Values are means ± se, n ≥ 100 in (C) and n ≥ 60 in (D). Different letters indicate significant differences at P < 0.001 based on a Tukey’s HSD test (see ANOVA tables; Supplemental Data Set 1).
Figure 7.
Figure 7.
CK Signaling Components Are Required for Stomatal Responses Induced by SA but Not by ABA. (A) and (B) Stomatal apertures in Col-0 wild-type, ahk3-3, and arr2-4 mutants (A), and prx33-3 and prx34-2 mutants (B) after 2 h of incubation with control solution, 10 µM SA, or 1 µM ABA. Values are means ± se (n ≥ 100). (C) and (D) ROS production detected by H2DCF-DA fluorescence in guard cells of Col-0 wild-type, ahk3-3, and arr2-4 mutants (C), and prx33-3 and prx34-2 mutants (D) 30 min after treatment with control solution, 1 µM ABA, or 10 µM SA. Values are means ± se (n ≥ 60). Different letters indicate significant differences at P < 0.001 based on a Tukey’s HSD test (see ANOVA tables; Supplemental Data Set 1).
Figure 8.
Figure 8.
CK-Mediated Stomatal Closure Is Mechanistically Linked to the SA Pathway. (A) to (C) Stomatal apertures in Col-0 wild-type, npr1-1, and sid2-2 plants (A), Col-0 wild type and ost1-3 (B), and Landsberg erecta wild type and aba1-3 (C) after 2 h of incubation with control solution, 1 µM t-Z, or 5 µM flg22. Values are means ± se (n ≥ 100). Different letters indicate significant differences at P < 0.001 based on a Tukey’s HSD test (see ANOVA tables; Supplemental Data Set 1). (D) Hypothetical model for the regulation of stomatal immunity by cytokinins. This model is based on the information provided in this study and references cited in the Discussion. In guard cells, perception of the PAMP flg22 by FLS2 is mechanistically linked to ABA and SA signaling pathways, illustrated by blue and brown shading, respectively. PRX33, PRX34, and PRX71 activate (arrows), while PRX4 represses (T-bars), PAMP-triggered ROS production. Independently of ABA and through a signaling cascade involving AHK3, ARR2, PRX33, and PRX34, CK (green shading) together with SA induces ROS production and stomatal closure to promote preinvasive defense responses. Dashed lines and question marks indicate indirect and uncertain connections, respectively.

References

    1. Acharya B.R., Assmann S.M. (2009). Hormone interactions in stomatal function. Plant Mol. Biol. 69: 451–462. - PubMed
    1. Akiyoshi D.E., Regier D.A., Gordon M.P. (1987). Cytokinin production by Agrobacterium and Pseudomonas spp. J. Bacteriol. 169: 4242–4248. - PMC - PubMed
    1. Argueso C.T., Ferreira F.J., Epple P., To J.P.C., Hutchison C.E., Schaller G.E., Dangl J.L., Kieber J.J. (2012). Two-component elements mediate interactions between cytokinin and salicylic acid in plant immunity. PLoS Genet. 8: e1002448. - PMC - PubMed
    1. Arnaud D., Hwang I. (2015). A sophisticated network of signaling pathways regulates stomatal defenses to bacterial pathogens. Mol. Plant 8: 566–581. - PubMed
    1. Bolwell G.P., Bindschedler L.V., Blee K.A., Butt V.S., Davies D.R., Gardner S.L., Gerrish C., Minibayeva F. (2002). The apoplastic oxidative burst in response to biotic stress in plants: a three-component system. J. Exp. Bot. 53: 1367–1376. - PubMed

MeSH terms

LinkOut - more resources