. 2017 Jun;66(6):1626-1635.
doi: 10.2337/db17-0017. Epub 2017 Mar 2.

β-Cell Inactivation of Gpr119 Unmasks Incretin Dependence of GPR119-Mediated Glucoregulation

Affiliations

β-Cell Inactivation of Gpr119 Unmasks Incretin Dependence of GPR119-Mediated Glucoregulation

Brandon L Panaro et al. Diabetes. 2017 Jun.

Abstract

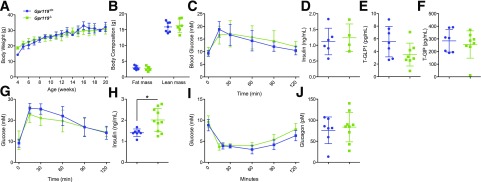
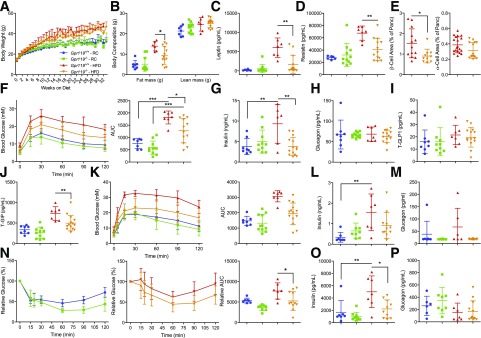
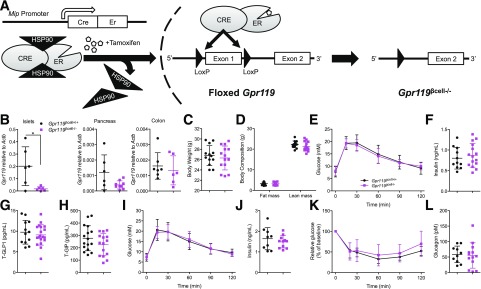
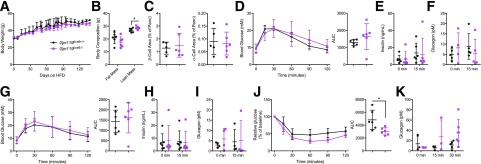
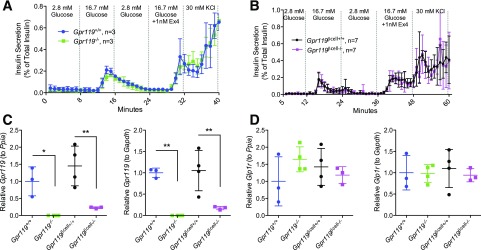
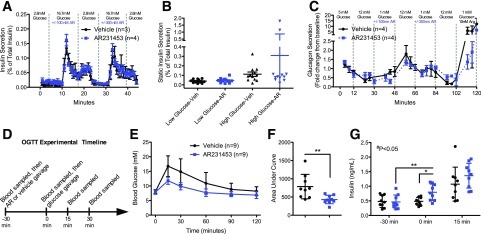
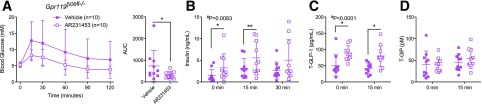
GPR119 was originally identified as an orphan β-cell receptor; however, subsequent studies demonstrated that GPR119 also regulates β-cell function indirectly through incretin hormone secretion. We assessed the importance of GPR119 for β-cell function in Gpr119-/- mice and in newly generated Gpr119βcell-/- mice. Gpr119-/- mice displayed normal body weight and glucose tolerance on a regular chow (RC) diet. After high-fat feeding, Gpr119-/- mice exhibited reduced fat mass, decreased levels of circulating adipokines, improved insulin sensitivity, and better glucose tolerance. Unexpectedly, oral and intraperitoneal glucose tolerance and the insulin response to glycemic challenge were not perturbed in Gpr119βcell-/- mice on RC and high-fat diets. Moreover, islets from Gpr119-/- and Gpr119βcell-/- mice exhibited normal insulin responses to glucose and β-cell secretagogues. Furthermore, the selective GPR119 agonist AR231453 failed to directly enhance insulin secretion from perifused islets. In contrast, AR231453 increased plasma glucagon-like peptide 1 (GLP-1) and insulin levels and improved glucose tolerance in wild-type and Gpr119βcell-/- mice. These findings demonstrate that β-cell GPR119 expression is dispensable for the physiological control of insulin secretion and the pharmacological response to GPR119 agonism, findings that may inform the lack of robust efficacy in clinical programs assessing GPR119 agonists for the therapy of type 2 diabetes.


Figures

Figure 1
Figure 1
Basal metabolic characterization of Gpr119−/− mice. Gpr119−/− and littermate control (Gpr119+/+) mice were weaned at 4 weeks of age and started on RC (18% kcal from fat). A: Weekly body weight. B: Body composition determined by MRI (5-week-old mice). C: Glucose excursions during oral glucose tolerance test (7-week-old mice). D: Plasma insulin determined 10 min after oral glucose administration. E: Glucose-stimulated total GLP-1 (T-GLP1) measured 10 min after glucose. F: Circulating total GIP (T-GIP) levels 10 min after glucose load. G: Glucose excursions during intraperitoneal glucose tolerance test (8-week-old mice). H: Plasma insulin measured 15 min after intraperitoneal glucose. I: Plasma glucose during insulin tolerance test (9-week-old mice). J: Circulating glucagon levels measured 20 min after insulin administration. Gpr119+/+, n = 6–7; Gpr119−/−, n = 8–10. All data are displayed as mean ± SD and were analyzed using Student t test. *P < 0.05.
Figure 2
Figure 2
Gpr119−/− mice fed a 45% HFD exhibit improved glucose tolerance and reduced fat mass. A: Body weight over time on RC or HFD (45% kcal from fat). B: Body composition after 18 weeks on diet. C and D: Plasma leptin and resistin after 19 weeks on diet. E: Histological analysis of β-cell (insulin positive, left) and α-cell (glucagon positive, right) area in pancreata. F–M: Age-matched Gpr119+/+ and Gpr119−/− male mice maintained on 18% RC or 45% HFD for 19–20 weeks prior to oral glucose tolerance test (OGTT) and intraperitoneal glucose tolerance test (IPGTT), respectively. F: Glucose excursion during OGTT and area under the curve (AUC) of glucose excursion on right. G: Plasma insulin assessed 5 min after glucose administration. H: Plasma glucagon levels, assessed 5 min after glucose administration. Total GLP-1 (T-GLP1) (I) and GIP (T-GIP) (J), determined 5 min after glucose load. K: Glucose excursion during IPGTT and AUC on right. L: Plasma insulin during IPGTT 15 min after glucose administration. M: Plasma glucagon levels 15 min after intraperitoneal glucose administration. N: Glucose levels during insulin tolerance test (ITT) of RC- and HFD-fed mice (left and middle) and AUC of relative glucose levels during ITT (right). O: Fasting insulin prior to start of ITT. P: Plasma glucagon levels 20 min after insulin injection during ITT. Gpr119+/+ (RC), n = 7; Gpr119−/− (RC), n = 11; Gpr119+/+ (HFD), n = 7; Gpr119−/− (HFD), n = 14. All data are displayed as mean ± SD and analyzed using ANOVA with Bonferroni posttest. *P < 0.05; **P < 0.01; ***P < 0.001.
Figure 3
Figure 3
Characterization of Gpr119βcell−/− mice on RC. A: Generation of Gpr119βcell−/− mice containing a floxed Gpr119 exon 1, bred with Mip-CreERT mice. B: Assessment of Gpr119 mRNA levels by quantitative PCR in islets, pancreas, and colon from Gpr119βcell−/− and Gpr119βcell+/+ mice. Values are expressed relative to transcript levels of β-actin (Actb). Islets: n = 6 per group. Pancreas: Gpr119βcell+/+, n = 6; Gpr119βcell−/−, n = 9. Colon: Gpr119βcell+/+, n = 7; Gpr119βcell−/−, n = 6. C: Body weight. D: Body composition. E: Glucose excursion from oral glucose tolerance test (OGTT) performed 2 weeks after last tamoxifen (TMX) dose; n = 15–18 per group. F: Glucose-stimulated insulin during OGTT (15 min after glucose load). G: Circulating total GLP-1 (T-GLP1) (G) and GIP (T-GIP) (H) levels assessed 15 min after glucose load. I: Intraperitoneal glucose tolerance test 1 week after last TMX dose; n = 9–11 per group J: Plasma insulin 15 min after intraperitoneal glucose. K: Glucose profile during insulin tolerance test. Values are expressed relative to fasting glucose; n = 13–18 per group. L: Circulating glucagon levels measured 20 min after exogenous insulin administration. *P < 0.05.
Figure 4
Figure 4
Gpr119βcell−/− mice exhibit normal glucose tolerance. All tests were performed at least 1 week apart and after a minimum of 12 weeks of HFD feeding. A: Body weight over time during chronic HFD feeding. B: Body composition at end of study. C: Histological analysis of β-cell (insulin positive, left) and α-cell (glucagon positive, right) area in pancreata. D: Glucose excursion during oral glucose tolerance test and area under the curve (AUC) of glucose excursion. E: Plasma insulin at the indicated time points. F: Plasma glucagon at the indicated time points. G: Glucose excursion during intraperitoneal glucose tolerance test and AUC of glucose excursion. H: Plasma insulin at the indicated time points. I: Plasma glucagon at the indicated time points. J: Glucose levels relative to baseline during an insulin tolerance test (ITT) and AUC of relative glucose levels. K: Plasma glucagon during ITT. Gpr119βcell+/+, n = 6; Gpr119βcell−/−, n = 6. *P < 0.05.
Figure 5
Figure 5
Gpr119 inactivation does not impair GSIS. A and B: Insulin secretion data during islet perifusion in Gpr119+/+ and Gpr119−/− islets isolated at 12 weeks of age (A) and Gpr119βcell+/+ and Gpr119βcell−/− islets isolated from mice 1 week after tamoxifen treatment at 12 weeks of age (B). Treatment conditions, indicated on graphs, include low glucose, high glucose, high glucose + 1 nmol/L exendin-4 (Ex4), and 30 mmol/L KCl. C: Gpr119 mRNA expression in islets relative to Ppia (left) and Gapdh (right). D: Islet Glp1r mRNA expression relative to Ppia (left) and Gapdh (right); n = 3–4 per group unless otherwise stated on graph. Data are expressed as mean ± SD and analyzed using ANOVA with Bonferroni posttest. *P < 0.05; **P < 0.01.
Figure 6
Figure 6
GPR119 agonism does not directly stimulate insulin secretion. A: Insulin secretion data during perifusion in islets isolated from C57BL/6J mice, with transitions from low to high glucose in conjunction with 100 and 300 nmol/L of GPR119 agonist AR231453. B: Individual data points from groups of five islets from a static insulin release assay from 1-h incubation of islets and listed treatment conditions; n = 11–12 per group. C: Glucagon secretion from perifusion of islets under the listed conditions in the presence of either AR231453 or vehicle. D: Experimental timeline of oral glucose tolerance test (OGTT) and AR231453 administration. E: Glucose excursion during OGTT. F: Area under the curve of glucose excursion in mice treated with vehicle or AR231453. All mice received both vehicle and AR231453 treatment in random order, 1 week apart. G: Insulin levels from OGTT. AR, AR231453; Arg, arginine. Data analyzed in F and G using paired Student t test. *P < 0.05; **P < 0.01. #, significant effect of drug treatment on insulin levels by two-way ANOVA.
Figure 7
Figure 7
AR231453 improves glucose tolerance in Gpr119βcell−/− mice. A: Glucose excursion during oral glucose tolerance test (OGTT) in Gpr119βcell−/− mice treated with AR231453 or vehicle and area under the curve (AUC) of glucose excursion. B: Plasma insulin at indicated time points during OGTT. Total GLP-1 (T-GLP1) (C) and total GIP (T-GIP) (D) in plasma. Data were analyzed by paired Student t test to determine the statistical significance of drug treatments in each group. *P < 0.05; **P < 0.01. #, significant effect of drug treatment on insulin levels by two-way ANOVA.

Similar articles

Cited by

References

    1. Zimmet PZ, Magliano DJ, Herman WH, Shaw JE. Diabetes: a 21st century challenge. Lancet Diabetes Endocrinol 2014;2:56–64 - PubMed
    1. Association AD; American Diabetes Association . Economic costs of diabetes in the U.S. in 2012. Diabetes Care 2013;36:1033–1046 - PMC - PubMed
    1. Kahn SE, Cooper ME, Del Prato S. Pathophysiology and treatment of type 2 diabetes: perspectives on the past, present, and future. Lancet 2014;383:1068–1083 - PMC - PubMed
    1. Campbell JE, Drucker DJ. Pharmacology, physiology, and mechanisms of incretin hormone action. Cell Metab 2013;17:819–837 - PubMed
    1. Sandoval DA, D’Alessio DA. Physiology of proglucagon peptides: role of glucagon and GLP-1 in health and disease. Physiol Rev 2015;95:513–548 - PubMed

MeSH terms