. 2017 Apr 3;214(4):991-1010.
doi: 10.1084/jem.20161387. Epub 2017 Mar 2.

p38 inhibition provides anti-DNA virus immunity by regulation of USP21 phosphorylation and STING activation

Affiliations

p38 inhibition provides anti-DNA virus immunity by regulation of USP21 phosphorylation and STING activation

Yunfei Chen et al. J Exp Med. .

Abstract

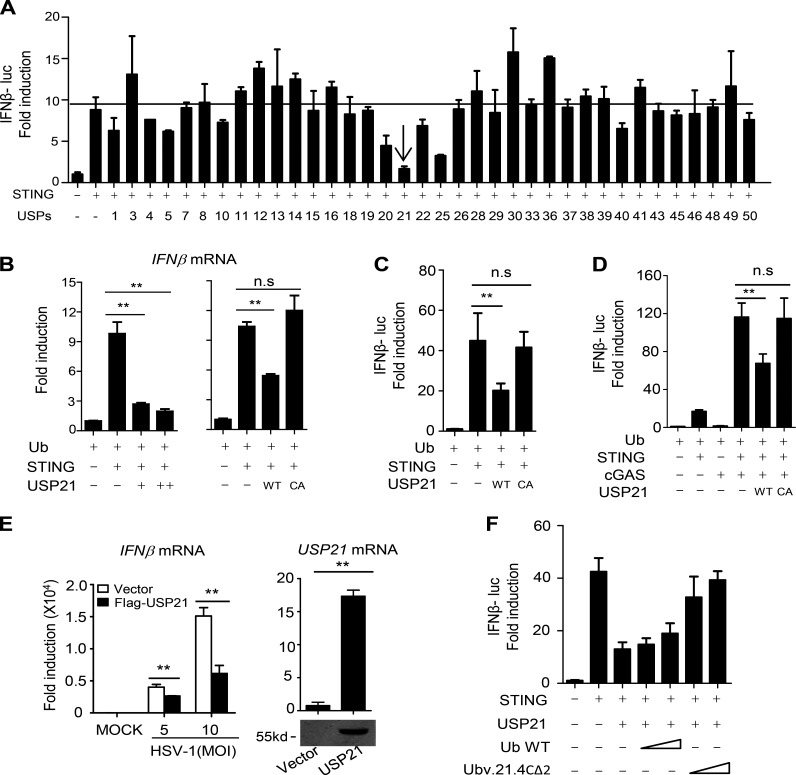
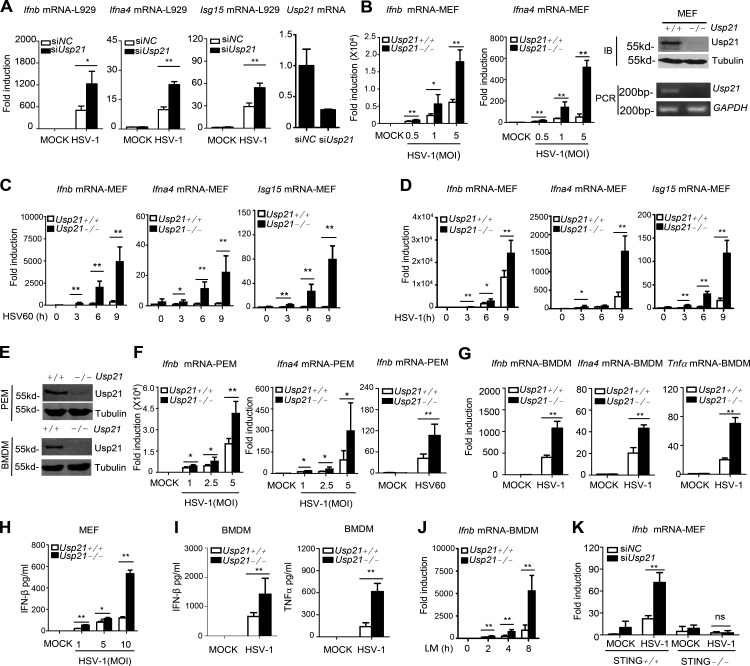
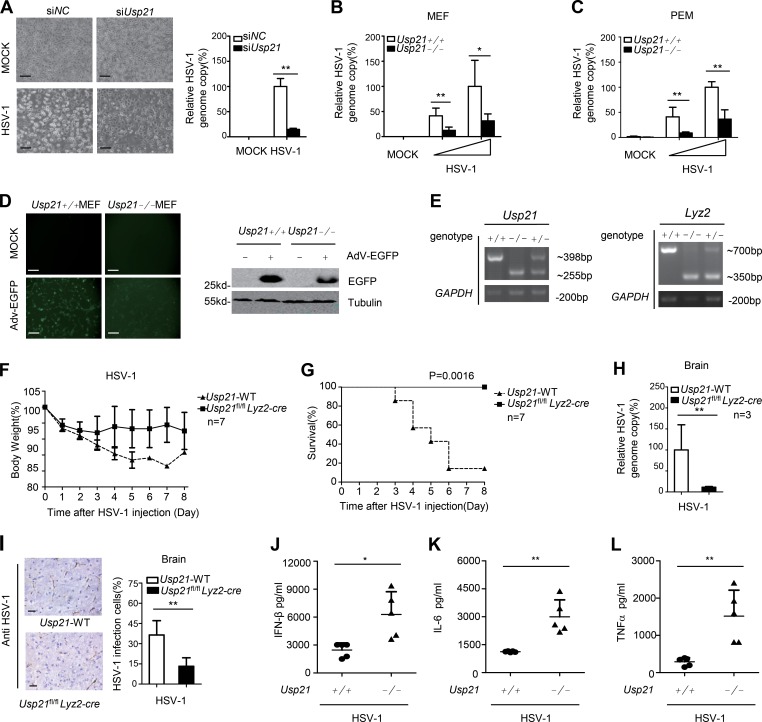
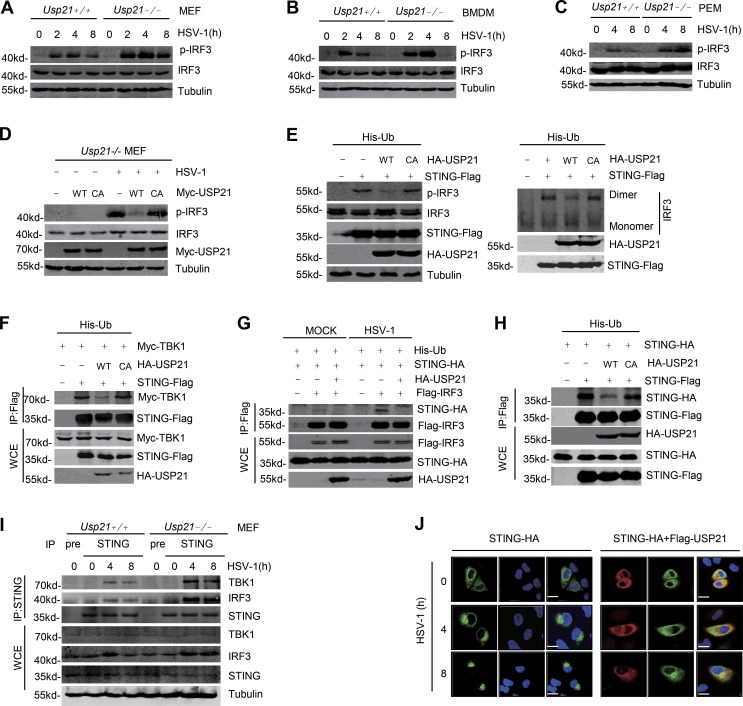
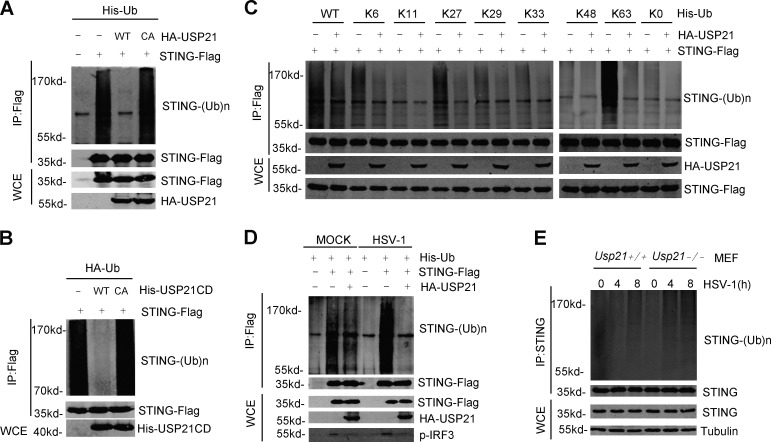
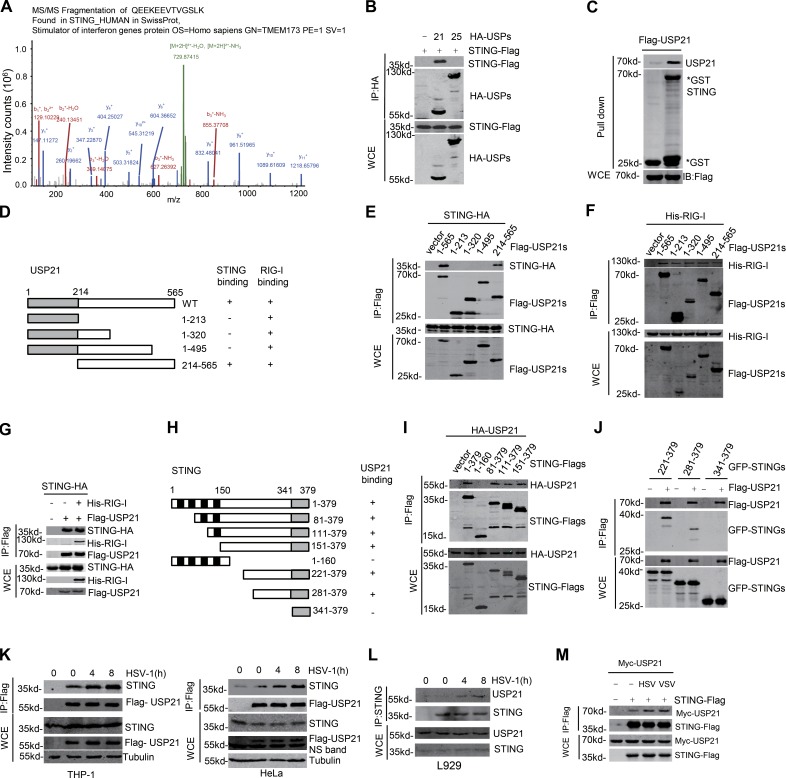
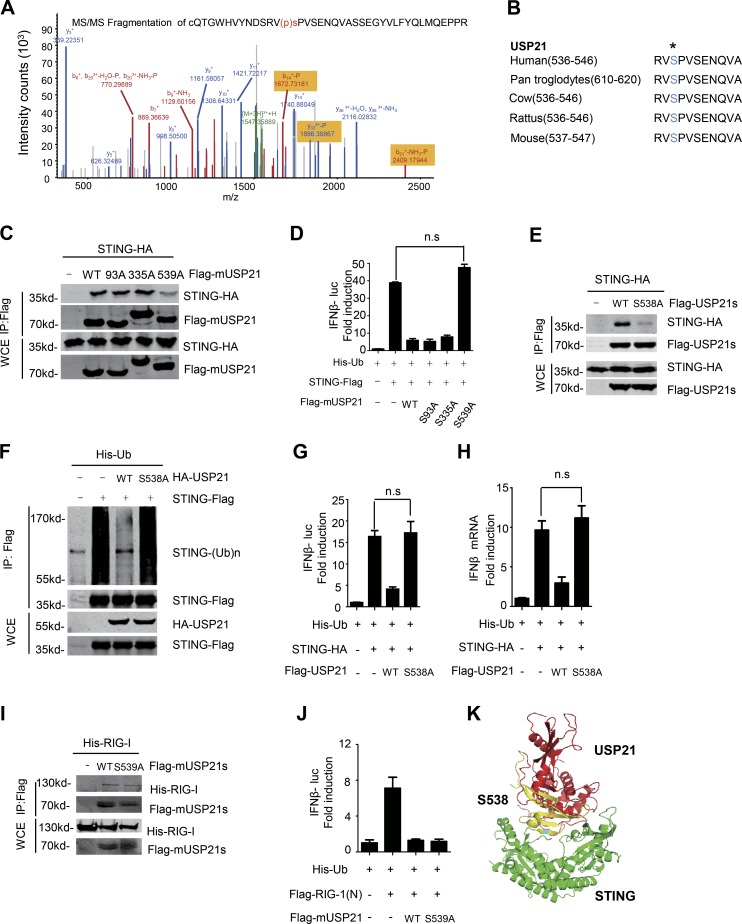
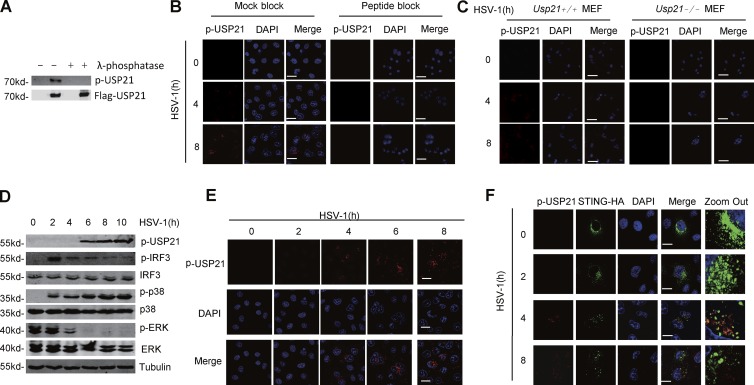
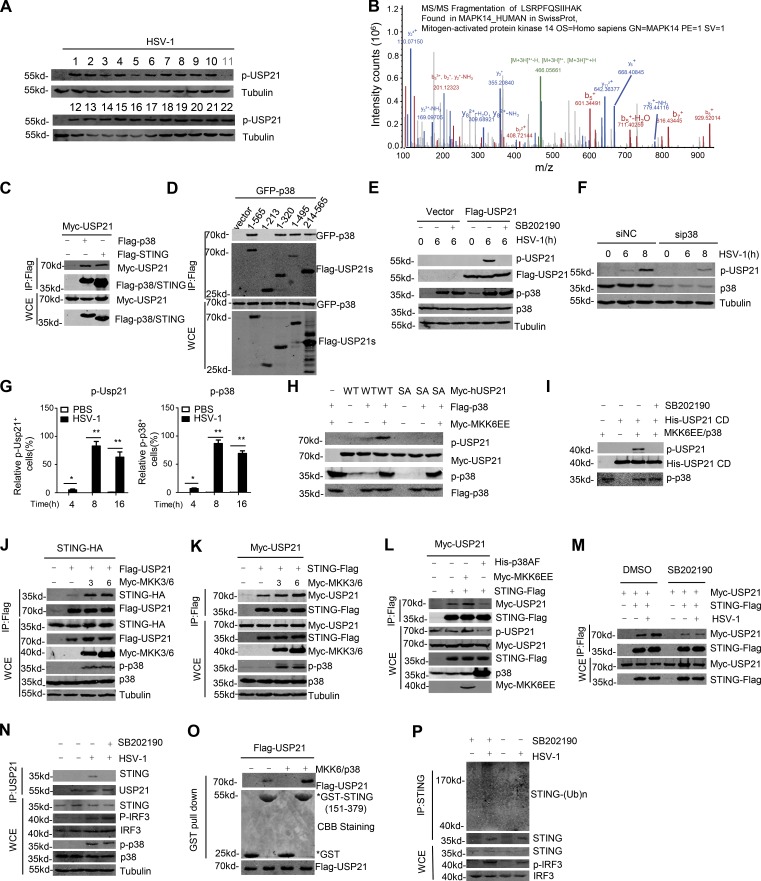
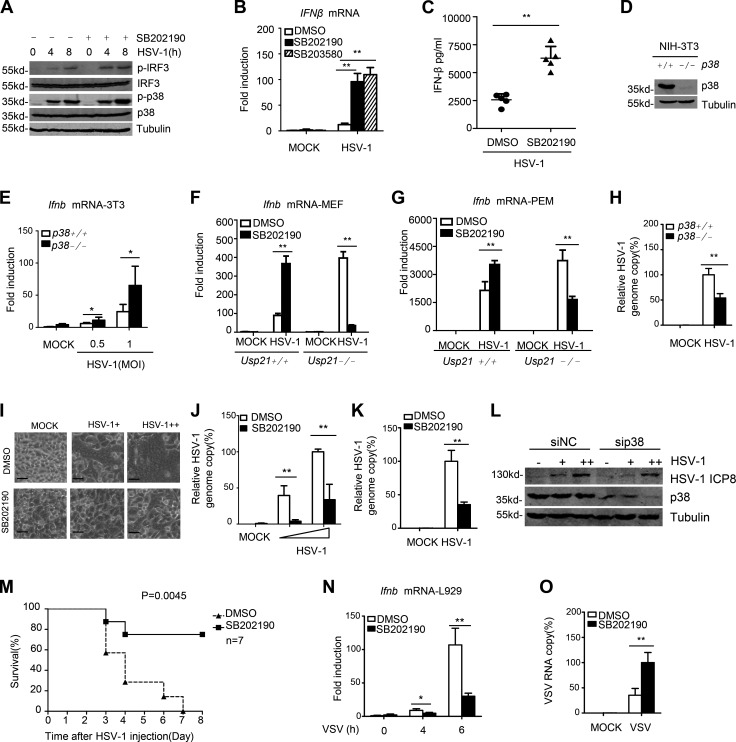
Stimulator of IFN genes (STING) is a central adaptor protein that mediates the innate immune responses to DNA virus infection. Although ubiquitination is essential for STING function, how the ubiquitination/deubiquitination system is regulated by virus infection to control STING activity remains unknown. In this study, we found that USP21 is an important deubiquitinating enzyme for STING and that it negatively regulates the DNA virus-induced production of type I interferons by hydrolyzing K27/63-linked polyubiquitin chain on STING. HSV-1 infection recruited USP21 to STING at late stage by p38-mediated phosphorylation of USP21 at Ser538. Inhibition of p38 MAPK enhanced the production of IFNs in response to virus infection and protected mice from lethal HSV-1 infection. Thus, our study reveals a critical role of p38-mediated USP21 phosphorylation in regulating STING-mediated antiviral functions and identifies p38-USP21 axis as an important pathway that DNA virus adopts to avoid innate immunity responses.


Figures

Figure 1.
Figure 1.
Overexpression of USP21 negatively regulates STING-induced IFN signaling. (A) STING-HA was cotransfected with the indicated USPs or control vectors, along with an IFNβ luciferase reporter, into 293T cells for 24 h. IFNβ luciferase activity was measured and normalized to Renilla luciferase activity. (B) STING-HA was cotransfected with USP21 WT or USP21 WT/CA for 30 h, and IFNβ mRNA levels were measured by qPCR. (C and D) Indicated plasmids were transfected in 293T for 30 h, and IFNβ luciferase activity was measured. (E) THP-1 cells stably expressing Flag vector or Flag USP21 WT (THP-1) were infected with HSV-1 (MOI = 5 or 10, respectively) for 8 h. IFNβ mRNA was measured by qPCR. USP21 protein was measured by Western blotting. (F) Indicated plasmids were transfected in 293T for 30 h, and IFNβ luciferase activity was measured. Error bars indicate mean ± SD in duplicate or triplicate experiments. Data from A is screening data from one experiment. Data are representative of two (E) or at least three (B–D and F) independent experiments. **, P < 0.01, two-tailed paired Student’s t test; NS, P > 0.05.
Figure 2.
Figure 2.
USP21 deficit enhances STING-induced IFN signaling. (A) L929 cells were transfected with control siRNA (siNC) and or siRNA against Usp21 (siUsp21). 48 h later, the transfected cells were counted and infected with HSV-1 (MOI = 1) for 6 h. Ifnb, Ifna4, and Isg15 mRNA induction was measured by qPCR. (B) WT or Usp21−/− MEFs were infected with HSV-1 (MOI = 0.5, 1, and 5) for 6 h. Ifnb and Ifna4 mRNA induction was measured by qPCR. WT or Usp21−/− MEFs were examined by RT-PCR or Western blotting. (C and D) WT or Usp21−/−MEFs were infected with HSV-1 (MOI = 1) or transfected with Mock or HSV60mer. Ifnb, Ifna4, and Isg15 mRNA induction was measured by qPCR. (E) WT or Usp21−/− PEMs and BMDMs were examined by Western blotting. (F) WT or Usp21−/− PEMs (isolated from WT or Usp21fl/fl Lyz2-cre mice) were infected with HSV-1 (MOI = 1, 2.5, and 5) for 6 h or transfected with an HSV60mer. Ifnb and Ifna4 mRNA induction was measured by qPCR. (G) WT or Usp21−/− BMDMs were infected with HSV-1 (MOI = 1) for 6 h, and induction of Ifnb, Ifna4, and TNFa mRNAs was measured by qPCR. (H) WT or Usp21−/− MEFs were infected with HSV-1 (MOI = 1, 5, and 10) for 12 h, and the supernatants were collected and assayed for IFNβ production by ELISA. (I) WT or Usp21−/− BMDMs (isolated from WT or Usp21fl/fl Lyz2-cre mice) were infected with HSV-1 (MOI = 1) for 12 h, and the supernatants were collected and assayed for IFNβ and TNF production by ELISA. (J) WT or Usp21−/− BMDMs were infected with L. monocytogenes (MOI = 10) for indicated times, and induction of Ifnb mRNAs was measured by qPCR. (K) WT or Sting−/− cells were transfected with siNC and siUsp21 for 48 h, and equal numbers of cells were counted and infected with HSV-1 (MOI = 0.5) for 4 h. Ifnb mRNA induction was measured by qPCR. Error bars indicate mean ± SD in triplicate experiments. Usp21 KO cells identify data are from one experiment. Other data are representative of three (A–K) independent experiments. *, P < 0.05; **, P < 0.01 (two-tailed paired Student’s t test).
Figure 3.
Figure 3.
USP21 negatively regulates host defense against DNA virus. (A) L929 cells were transfected with siNC and siUsp21. 48 h later, the transfected cells were counted and infected with HSV-1 (MOI = 1). Cell morphology was visualized by microscopy at 8 h. 24 h later, genomic DNA was extracted and HSV-1 relative genome copy ratio was measured by qPCR. Bars, 200 µm. (B and C) WT or Usp21−/− MEFs or PEMs were infected with HSV-1 (MOI = 0.5 and 1) for 24 h, after which genomic DNA was extracted, and the relative HSV genome copy ratio was measured by qPCR. (D) Adv-EGFP replication in WT or Usp21−/− MEFs after infection for 36 h was visualized by fluorescence microscopy. Cell lysates were immunoblotted with the indicated antibodies. Bars, 200 µm. (E) DNA-PAGE images of intercrossed Usp21+/− Lyz2+/− mice. (F and G) WT or Usp21fl/fl Lyz2-cre mice (n = 7 each) were intravenously injected with HSV-1 at 1 × 10⁷ PFU per mouse, and survival was monitored for 8 d. Body weight (F) and survival rate (G) were tested. (H) WT or Usp21fl/fl Lyz2-cre mice (n = 3 each) were intravenously injected with HSV-1 at 5 × 10⁶ PFU per mouse. Brains were harvested 5 d after infection and measured by qPCR. HSV-1 genomic DNA was assessed. (I) WT or Usp21fl/fl Lyz2-cre mice (n = 3 each) were intravenously injected with HSV-1 at 2 × 10⁷ PFU per mouse. Brains were harvested after 2 d for immunohistochemistry (IHC) analysis using anti–HSV-1 antibodies. Tissue sections were visualized by microscopy. Percentages of HSV-1–infected cells were quantified. Positive cells were counted from 10 fields per mouse (n = 3). Bars, 33 μm. (J–L) WT or Usp21fl/fl Lyz2-cre mice (n = 5 each) were intravenously injected with HSV-1 at 1 × 10⁷ PFU per mouse. Sera were collected at 6 h, and the concentrations of serum cytokines, including IFNβ (J), IL-6 (K), and TNF (L) were measured by ELISA. Error bars indicate mean ± SD in duplicate or triplicate experiments. *, P < 0.05; **, P < 0.01 (two-tailed paired Student’s t test or Kaplan Meier survival analysis). Data are representative of two (D–L) or at least three (A–C) independent experiments.
Figure 4.
Figure 4.
USP21 deficiency enhances intracellular IRF3 activation. (A and B) WT or Usp21−/− MEFs or BMDMs were infected with HSV-1 (MOI = 2). Cells were collected at the indicated time (0, 2, 4, and 8 h). All proteins were immunoblotted with the indicated antibodies. (C) WT or Usp21−/− PEMs were infected with HSV-1 (MOI = 1). Cells were collected at the indicated time (0, 4, and 8 h). The indicated proteins were analyzed by Western blotting. (D) Usp21−/−MEFs were transfected with Myc-USP21 WT/CA using Lipofectamine 3000; 24 h later, HSV-1 was added to the cells for 6 h. All proteins were immunoblotted with the indicated antibodies. (E) STING-Flag was cotransfected with HA-USP21 WT or CA and ubiquitin into 293T cells for 36 h. IRF3 dimers were separated via native PAGE. The indicated proteins were analyzed by Western blotting. (F) STING-Flag was cotransfected with HA-USP21 WT or CA and Myc-TBK1 in combination with ubiquitin into 293T cells for 36 h. Cell lysates were immunoprecipitated with M2 beads. All proteins were immunoblotted with the indicated antibodies. (G) Flag-IRF3 was cotransfected with HA-USP21 WT and STING-HA in combination with Ubiquitin into 293T cells for 36 h; the cells were then stimulated with HSV-1 (MOI = 2) for 4 h. Cell lysates were immunoprecipitated with M2 beads. All proteins were immunoblotted with the indicated antibodies. (H) STING-Flag were cotransfected with HA-USP21 WT or CA mutant and STING-HA into 293T for 36 h. STING-Flag was immunoprecipitated using M2 beads. The bound STING-HA was analyzed by Western blotting. (I) WT or Usp21−/− MEFs were infected with HSV-1 (MOI = 1) or left uninfected for the indicated time. Co-IP and immunoblot analyses were performed with the indicated antibodies. USP21 deficiency enhanced the HSV-1–induced recruitment of TBK1 and IRF3 to STING. (J) HeLa cells were transfected with STING-HA in combination with an empty vector or Flag-USP21, followed by stimulation with HSV-1 (MOI = 2) for the indicated amounts of time. USP21 blocks STING localization to the perinuclear region. Bar, 25 µm. Data are representative of two (D–J) or at least three (A–C) independent experiments.
Figure 5.
Figure 5.
USP21 deubiquitinates STING. (A) STING-Flag was transfected into 293T cells in combination with HA-USP21WT/ CA and His-ubiquitin. At 30 h after transfection, cell lysates were immunoprecipitated with M2 beads. A denaturation assay was employed to test ubiquitination. (B) USP21 hydrolysis of ubiquitin chains conjugated to STING was analyzed using an in vitro deubiquitination assay. (C) Indicated plasmids were transfected in 293T. The ubiquitination of STING was analyzed using ubiquitination assay under denaturing condition. (D) Indicated plasmids were transfected in 293T. After 24 h, cells were stimulated with HSV-1 (MOI = 1) for 6 h. The ubiquitination of STING was analyzed using ubiquitination assay under denaturing condition. (E) WT or Usp21−/− MEFs were infected with or without HSV-1 for the indicated amounts of time, and cell lysates were subjected to denaturing immunoprecipitation with an anti-STING antibody or normal IgG, and then analyzed by immunoblotting with the indicated antibodies. Data from A–E are representative of at least two independent experiments.
Figure 6.
Figure 6.
USP21 binds STING. (A) HeLa cells were transfected with Flag-USP21 for 24 h. The transfected cells were stimulated with HSV-1 (MOI = 10) for 8 h. Then Flag-USP21 was immunoprecipitated with M2 beads and the binding proteins were analyzed by mass spectrometry. (B) The indicated plasmids were transfected into 293T cells. Cell lysates were immunoprecipitated using HA beads, and then immunoblotted with the indicated antibodies. (C) The interaction between USP21 and STING was assessed using a GST pull-down assay. All proteins were detected using the indicated antibodies. (D–G) The indicated plasmids were transfected into 293T cells. The constructs are shown in D, and the corresponding blots are shown below. (H–J) The indicated plasmids were transfected into 293T cells. The constructs are shown in H, and the corresponding blots are shown below. (K) Semiendogenous interaction between STING and Flag-USP21. THP1 or HeLa cells stably expressing Flag-USP21 cells were infected with HSV-1 (MOI = 10) for the indicated amounts of time. Co-IP experiments were performed using M2 beads, and the immunoprecipitates were analyzed by immunoblotting with anti-STING and anti-Flag. The lysates were analyzed by immunoblotting with the indicated antibodies. (L) Endogenous USP21 is associated with STING in L929 cells. L929 cells were infected with HSV-1 (MOI = 5) for the indicated time. Co-IP experiments were performed with anti-STING, and the immunoprecipitates were analyzed with the indicated antibodies. (M) Indicated plasmids were transfected in 293T. After 24 h, cells were stimulated with HSV-1 (MOI = 1) or VSV (MOI = 0.5) for 6 h. Cell lysates were immunoprecipitated with M2 beads and then immunoblotted with the indicated antibodies. Data from A are mass data from one experiment. Data are representative of two (B–D, J, and K–M) or at least three (E–I) independent experiments.
Figure 7.
Figure 7.
Phosphorylation of Ser538 is essential for its interaction with STING. (A) Phosphorylation of USP21 was identified in MS assay which was performed in Fig. 6 A. (B) USP21 contains a putative SPP motif at the C terminus that is conserved in different species. (C) Indicated plasmids were transfected in 293T. Lysates were immunoprecipitated with M2 beads, and then immunoblotted with the indicated antibodies. (D) Indicated plasmids were transfected in 293T for 30 h, and IFNβ luciferase activity was measured. (E) Indicated plasmids were transfected in 293T. Lysates were immunoprecipitated with M2 beads, and then immunoblotted with the indicated antibodies. (F) Indicated plasmids were transfected in 293T. Cell lysates were immunoprecipitated with M2 beads. A denaturation assay was employed to test ubiquitination. (G and H) Indicated plasmids were transfected in 293T. IFNβ mRNA levels were measured by qPCR and IFNβ luciferase activity was tested. (I) Indicated plasmids were transfected in 293T. Lysates were immunoprecipitated with M2 beads, and then immunoblotted with the indicated antibodies. (J) Indicated plasmids were transfected in 293T for 30 h, and IFNβ luciferase activity was measured. (K) The co-structure of USP21 and STING protein is predicted in pymol software. Computational modeling of structures of the USP21 USP domain in complex with STING C-terminal domain (CTD, green). USP21 aa 495–559 are shown in yellow, and USP21 S538 is shown in cyan. Data from A are mass data from one experiment. Data are representative of at least two (I and J) three (C–H) independent experiments. Error bars indicate mean ± SD in duplicate or triplicate experiments. *, P < 0.05; **, P < 0.01 (two-tailed paired Student’s t test).
Figure 8.
Figure 8.
Phosphorylation of Ser538 increases under HSV-1 infection. (A) In vitro dephosphorylation to test the specificity of p-USP21 antibody was analyzed. (B) HeLa cells were untreated or infected with HSV-1 for indicated time. The immunofluorescence assay was performed to examine the specificity of p-USP21 with or without peptide blocking. Bars, 50 µm. (C) WT or Usp21−/− MEFs were untreated or infected with HSV-1 for indicated times. IF assay to test p-USP21 antibody. Bars, 50 µm. (D) p-USP21 was raised under HSV-1 infection in HeLa cells. Cell lysates were analyzed by immunoblotting with the indicated antibodies. (E) p-USP21 was visualized under HSV-1 infection in HeLa cells by immunoblotting confocal microscopy. Bars, 50 µm. (F) Co-localization of p-USP21 and STING. HeLa cells were transfected with STING-HA. 20 h after transfection, cells were left untreated or infected with HSV-1 at the indicated time points and analyzed by confocal microscopy. Bars, 25 µm. Data from A are mass data from one experiment. Data are representative of at least two (A–C and E) or three (D and F) independent experiments.
Figure 9.
Figure 9.
Phosphorylation of USP21 at Ser538 by p38 MAPK. (A) Screening of kinase inhibitors that affected HSV-1–induced p-USP21 level. The inhibitor details are listed in Table S1. (B) p38 was identified as a USP21 binding partner in the MS assay performed in Fig. 6 A. (C and D) The indicated plasmids were transfected into 293T cells. Cell lysates were then immunoprecipitated with M2 beads and immunoblotted with the indicated antibodies. (E) Immunoblot analysis of phosphorylated and total USP21 in lysates of Flag-USP21 HeLa stable cells treated with DMSO or 10 µM SB202190 and infected for 6 h with HSV-1 (MOI = 1). (F) HeLa were transfected with siNC and sip38, and 48 h later, equal amounts of cells were counted and infected with HSV-1 (MOI = 10) at indicated times. Cell lysate were tested by indicated antibody. (G) FACS analysis of p-USP21 and p-p38 in blood cells obtained from mice (n = 3) that were intravenously injected with HSV-1 (1 × 10⁷ PFU); blood cells were collected at the indicated time. (H) Immunoblot analysis of phosphorylated and total USP21 in lysates of HEK293T cells transfected with indicated plasmid. (I) Immunoblot analysis of phosphorylated and total USP21 with an in vitro kinase assay. Purified recombinant His-tagged USP21 CD was incubated with Flag-tagged p38, which was cotransfected with MKK6EE. (J–L) The indicated plasmids were transfected into 293T cells. Cell lysates were then immunoprecipitated with M2 beads and immunoblotted with the indicated antibodies. (M) The indicated plasmids were transfected into 293T. After 24 h, the cells were pretreated with DMSO or SB202190 for 2 h, after that cells were stimulated with HSV-1 (MOI = 1). Cell lysates were immunoprecipitated with M2 beads and then immunoblotted with the indicated antibodies. (N) Endogenous Usp21 is associated with Sting in L929 cells. L929 cells were pretreated with DMSO or 10 µM SB202190. After 2 h, L929 cells were left untreated or infected with HSV-1 (MOI = 5) for 6 h. Co-IP experiments were performed with anti-USP21, and the immunoprecipitates were analyzed by immunoblotting with the indicated antibodies. (O) Flag-USP21 and Flag-USP21/MKK6EE/p38 were transfected into 293T. The interaction between USP21 and STING was assessed using a GST pull-down assay. All proteins were detected using the indicated antibodies. (P) L929 cells were pretreated with DMSO or with 10 µM SB202190 for 2 h. Next, the cells were infected with HSV-1 or left uninfected for 4 h, and the lysates were subjected to denaturing immunoprecipitation with an anti-STING antibody or normal IgG, followed by immunoblotting with the indicated antibodies. Data from A are screen data from one experiment. Data from B are mass data from one experiment. Data are representative of at least two (C–G and J–P) or three (H and I) independent experiments.
Figure 10.
Figure 10.
Regulation of antiviral responses by p38 MAPK. (A) THP-1 cells were pretreated with SB202190, and then infected with HSV-1. Cell lysates were immunoblotted with the indicated antibodies. (B) HeLa were pretreat with different p38 inhibitors used to test HSV-1–induced IFNβ. IFNβ mRNA induction was measured by qPCR. (C) WT mice (n = 5 each) were intravenously injected with DMSO or 10 µg SB202190 for 2 h, after which all mice were intravenously injected with HSV-1 at 1 × 10⁷ PFU per mouse. Sera were collected, and IFNβ (6 h after infection) was measured by ELISA. (D) Identification for p38+/+ and p38−/− NIH3T3 cells. (E) p38+/+ and p38−/− NIH3T3 cells were infected with HSV-1 (MOI = 0.5 and 1) for 6 h. Ifnb mRNA induction was measured by qPCR. (F) WT or Usp21−/− MEFs were pretreated with DMSO or 10 µM SB202190 for 2 h, followed by infection with HSV-1 (MOI = 0.1) for 4 h. Ifnb mRNA induction was measured by qPCR. (G) WT or Usp21−/− PEMs were pretreated with DMSO or 1 µM SB202190 for 2 h, and then infected with HSV-1 (MOI = 1) for 6 h, and induction of Ifnb mRNAs was measured by qPCR. (H) p38+/+ and p38−/− NIH3T3 cells were infected with HSV-1 (MOI = 0.1) for 24 h. The relative HSV-1 genome copy ratio was measured by qPCR. (I and J) HeLa cells were pretreated with DMSO or 10 µM SB202190 for 2 h. HSV-1 (MOI = 0.5 and 1) infection was then performed for 24 h. Cell morphology was visualized by microscopy (I). The relative HSV-1 genome copy ratio was measured by qPCR (J). Bars, 100 µm. (K) L929 cells were treated with 10 µM SB202190 for 2 h. After that, HSV-1 (MOI = 1) was added into cells for 24 h, and HSV-1 relative genome copy ratio was measured by qPCR. (L) HeLa were transfected with siNC and sip38, 48 h later, equal cell were counted and infected with HSV-1 (MOI = 0.2 and 1) for 24 h. Cell lysate was tested by indicated antibody. (M) WT mice (n = 7 each) were intravenously injected with DMSO or 10 µg SB202190 for 2 h, after which all mice were intravenously injected with HSV-1 at 1 × 10⁷ PFU per mouse. Survival was monitored for 8 d. (N) L929 pretreated with p38 inhibitors were used to test VSV-induced Ifnb mRNA. Ifnb mRNA induction was measured by qPCR. (O) L929 cells were pretreated with 10 µM SB202190 for 2 h. After that, VSV (MOI = 0.1) was added into cells for 24 h, and VSV RNA copy was measured by qPCR. Data are representative of at least two (L–O) or three (A–K) independent experiments. Error bars indicate mean ± SD in duplicate or triplicate experiments. *, P < 0.05; **, P < 0.01 (two-tailed paired Student’s t test or Kaplan Meier survival analysis).

References

    1. Ablasser A., Goldeck M., Cavlar T., Deimling T., Witte G., Röhl I., Hopfner K.P., Ludwig J., and Hornung V.. 2013. cGAS produces a 2′-5′-linked cyclic dinucleotide second messenger that activates STING. Nature. 498:380–384. 10.1038/nature12306 - DOI - PMC - PubMed
    1. Akira S., Uematsu S., and Takeuchi O.. 2006. Pathogen recognition and innate immunity. Cell. 124:783–801. 10.1016/j.cell.2006.02.015 - DOI - PubMed
    1. Amerik A.Y., and Hochstrasser M.. 2004. Mechanism and function of deubiquitinating enzymes. Biochim. Biophys. Acta. 1695:189–207. 10.1016/j.bbamcr.2004.10.003 - DOI - PubMed
    1. Archer K.A., Durack J., and Portnoy D.A.. 2014. STING-dependent type I IFN production inhibits cell-mediated immunity to Listeria monocytogenes. PLoS Pathog. 10:e1003861 10.1371/journal.ppat.1003861 - DOI - PMC - PubMed
    1. Bhoj V.G., and Chen Z.J.. 2009. Ubiquitylation in innate and adaptive immunity. Nature. 458:430–437. 10.1038/nature07959 - DOI - PubMed