. 2017 Apr;7(4):391-399.
doi: 10.1158/2159-8290.CD-16-0611. Epub 2017 Mar 2.

Adaptive Reprogramming of De Novo Pyrimidine Synthesis Is a Metabolic Vulnerability in Triple-Negative Breast Cancer

Affiliations

Adaptive Reprogramming of De Novo Pyrimidine Synthesis Is a Metabolic Vulnerability in Triple-Negative Breast Cancer

Kristin K Brown et al. Cancer Discov. 2017 Apr.

Erratum in

Abstract

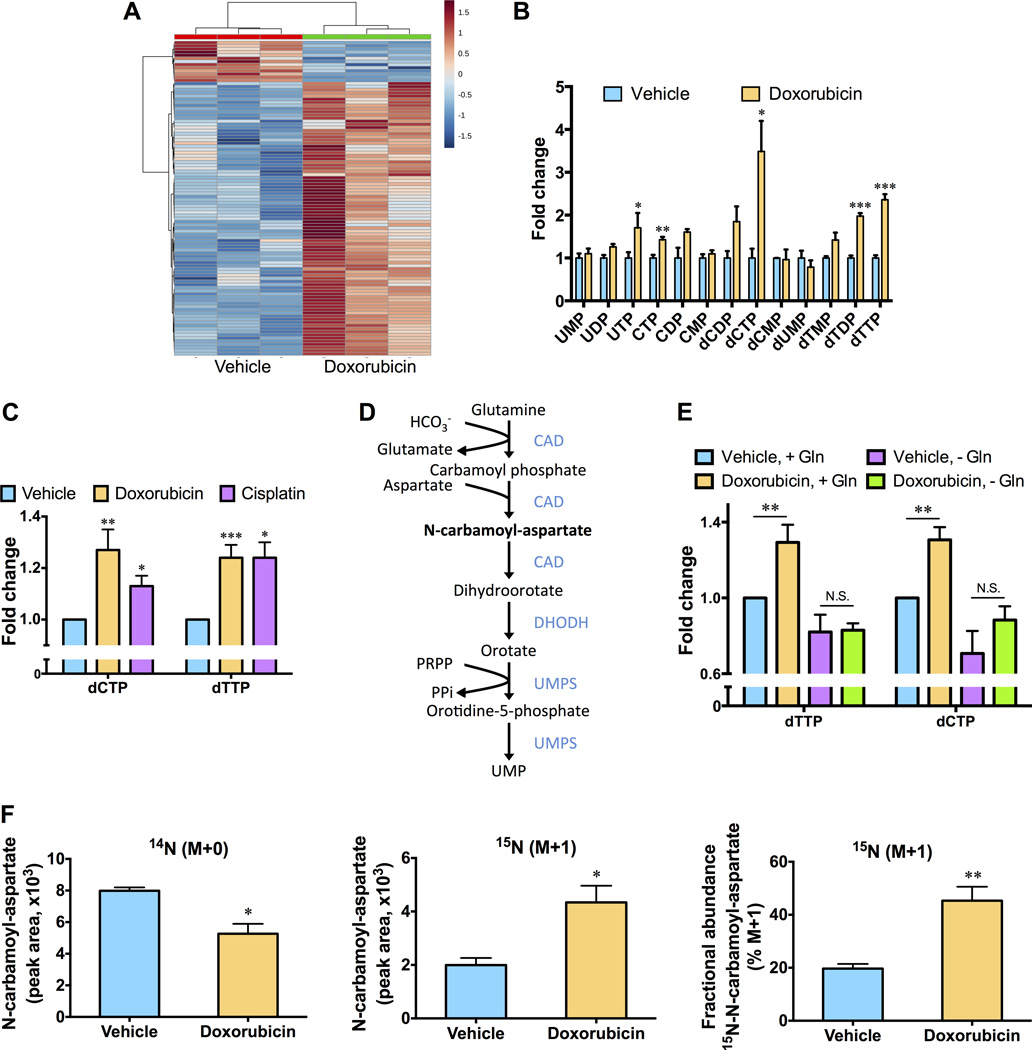
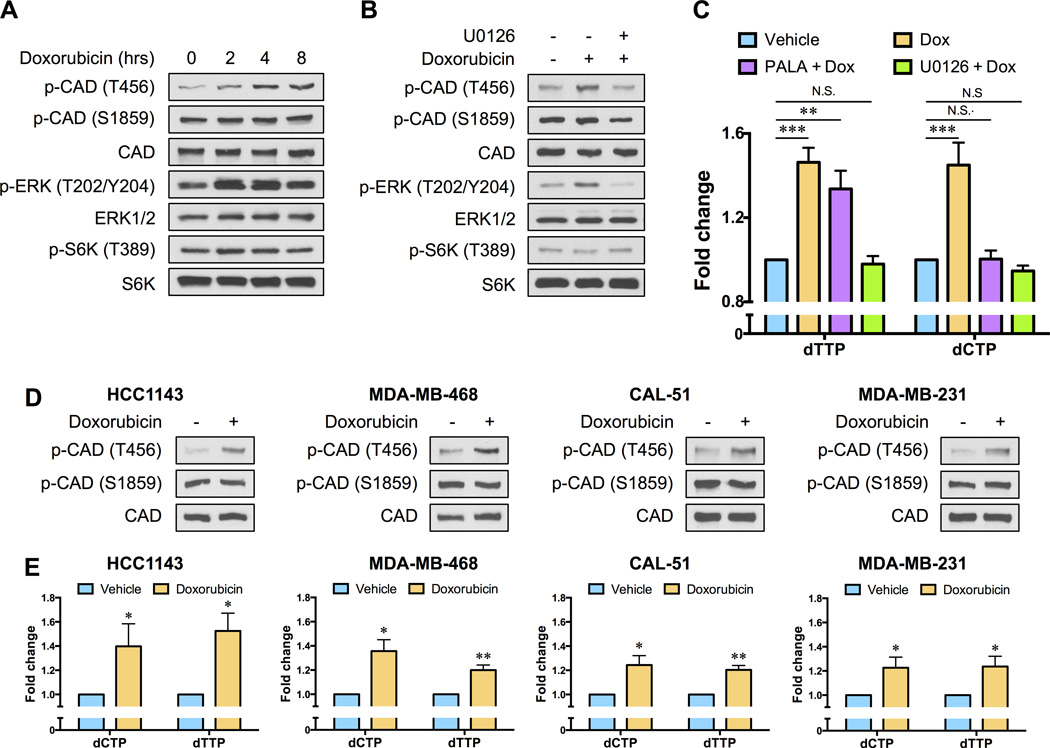
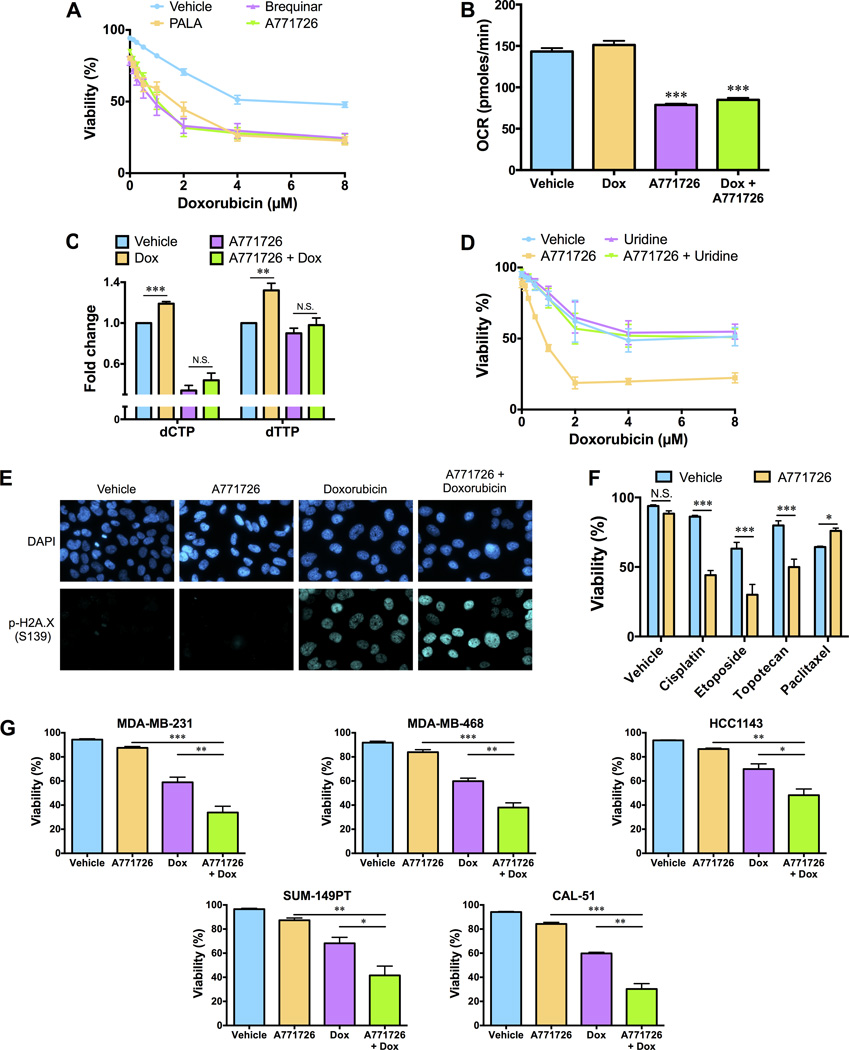
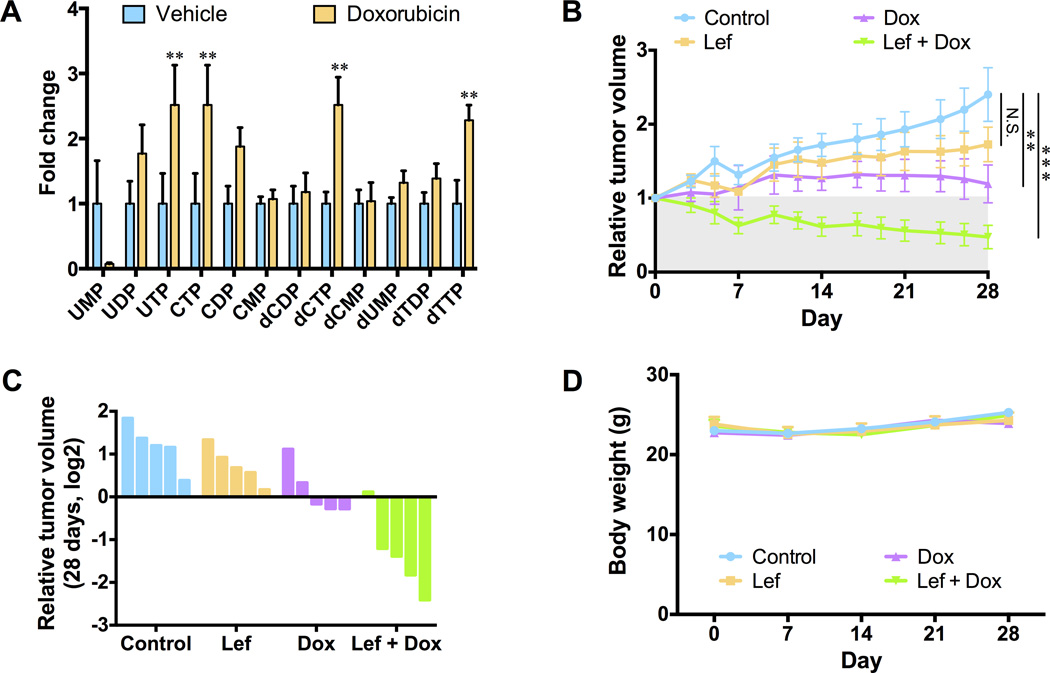
Chemotherapy resistance is a major barrier to the treatment of triple-negative breast cancer (TNBC), and strategies to circumvent resistance are required. Using in vitro and in vivo metabolic profiling of TNBC cells, we show that an increase in the abundance of pyrimidine nucleotides occurs in response to chemotherapy exposure. Mechanistically, elevation of pyrimidine nucleotides induced by chemotherapy is dependent on increased activity of the de novo pyrimidine synthesis pathway. Pharmacologic inhibition of de novo pyrimidine synthesis sensitizes TNBC cells to genotoxic chemotherapy agents by exacerbating DNA damage. Moreover, combined treatment with doxorubicin and leflunomide, a clinically approved inhibitor of the de novo pyrimidine synthesis pathway, induces regression of TNBC xenografts. Thus, the increase in pyrimidine nucleotide levels observed following chemotherapy exposure represents a metabolic vulnerability that can be exploited to enhance the efficacy of chemotherapy for the treatment of TNBC.Significance: The prognosis for patients with TNBC with residual disease after chemotherapy is poor. We find that chemotherapy agents induce adaptive reprogramming of de novo pyrimidine synthesis and show that this response can be exploited pharmacologically, using clinically approved inhibitors of de novo pyrimidine synthesis, to sensitize TNBC cells to chemotherapy. Cancer Discov; 7(4); 391-9. ©2017 AACR.See related article by Mathur et al., p. 380This article is highlighted in the In This Issue feature, p. 339.


Conflict of interest statement

Conflict of Interest Disclosure Statement: The authors declare no conflict of interest.

Figures

Fig. 1
Fig. 1. Chemotherapy exposure stimulates an increase in pyrimidine nucleotides in TNBC cells
(A) Unbiased hierarchical clustering of relative metabolite abundances in SUM-159PT cells versus SUM-159PT cells treated with 0.5 µM doxorubicin for ten hours. (B) Fold changes in pyrimidine nucleotide abundances, as measured by LC-MS/MS, in vehicle treated SUM-159PT cells versus SUM-159PT cells treated with 0.5 µM doxorubicin for 10 hours. (C) SUM-159PT cells were treated with 0.5 µM doxorubicin or 12.5 µM cisplatin for 10 hours and pyrimidine deoxyribonucleoside triphosphate levels were monitored using a fluorescence-based assay. (D) Schematic of the de novo pyrimidine nucleotide synthesis pathway. (E) Fold changes in dTTP and dCTP levels, following exposure to 0.5 µM doxorubicin for 10 hours in the absence or presence of glutamine (Gln), were monitored using a fluorescence-based assay. (F) Relative isotopic enrichment of L-glutamine (amide-15N) into N-carbamoyl-aspartate was measured by LC-MS/MS in vehicle treated SUM-159PT cells versus SUM-159PT cells treated with 0.5 µM doxorubicin for 4 hours. All error bars represent SEM. N.S. not significant, * P < 0.05, ** < 0.01, *** P < 0.001 by a Student’s t-test.
Fig. 2
Fig. 2. Chemotherapy exposure alters the phosphorylation state of CAD to stimulate de novo pyrimidine nucleotide synthesis
(A) SUM-159PT cells were treated with 0.5 µM doxorubicin for the indicated times and the phosphorylation states of CAD, ERK and S6K1 were monitored by immunoblotting. (B) SUM-159PT cells were pre-treated with 5 µM U0126 for 12 hours before a 4 hour exposure to 0.5 µM doxorubicin and the phosphorylation states of CAD, ERK and S6K1 were monitored by immunoblotting. (C) SUM-159PT cells were treated with 0.5 µM doxorubicin for ten hours, in the absence or presence of 5 µM U0126 or 40 µM N-(phosphonacetyl)-l-aspartic acid (PALA), and pyrimidine deoxyribonucleoside triphosphate levels were monitored using a fluorescence-based assay. (D) TNBC cell lines (HCC1143, MDA-MB-468, CAL-51 and MDA-MB-231) were treated with 0.5 µM doxorubicin for 4 hours and changes in CAD phosphorylation were monitored by immunoblotting. (E) TNBC cell lines (HCC1143, MDA-MB-468, CAL51 and MDA-MB-231) were treated with 0.5 µM doxorubicin for 10 hours and pyrimidine deoxyribonucleoside triphosphate levels were monitored using a fluorescence-based assay. All error bars represent SEM. N.S. not significant, * P < 0.05, ** P < 0.01, *** P < 0.001 by a Student’s t-test.
Fig. 3
Fig. 3. Inhibition of the de novo pyrimidine synthesis pathway sensitizes TNBC cells to genotoxic chemotherapy
(A) SUM-159PT cells were pre-treated with 80 µM N-(phosphonacetyl)-l-aspartic acid (PALA), 0.3 µM brequinar or 20µM A771726 for 12 hours before exposure to doxorubicin for an additional 48 hours. The percentage of dead cells in the population was determined using a propidium iodide viability assay. (B) The oxygen consumption rate (OCR) of 50,000 SUM-159PT cells treated with vehicle, 0.5 µM doxorubicin (Dox), 20 µM A771726 or the combination of Dox and A771726 for 4 hours was measured using a Seahorse analyzer. (C) SUM-159PT cells were pre-treated with 20µM A771726 for 12 hours before exposure to Dox for ten hours and pyrimidine deoxyribonucleoside triphosphate levels were monitored using a fluorescence-based assay. (D) SUM-159PT cells were pre-treated with 20 µM A771726 and 100 µM uridine for 12 hours before exposure to doxorubicin for an additional 48 hours. The percentage of dead cells in the population was determined using a propidium iodide viability assay. (E) SUM-159PT cells were pre-treated with 20 µM A771726 for 12 hours before exposure to doxorubicin for 10 hours. Cells were mounted on slides with DAPI after immunostaining with an Alexa-Fluor 647-conjugated p-H2A.X (Ser139) antibody. Images are representative of three independent experiments. (F) SUM-159PT cells were pre-treated with 20 µM A771726 for 12 hours before exposure to cisplatin (12.5 µM), etoposide (40 µM), topotecan (0.625 µM) or paclitaxel (0.5 µM) for an additional 48 hours. The percentage of dead cells in the population was determined using a propidium iodide viability assay. (G) TNBC cell lines (MDA-MB-231, MDA-MB-468, HCC1143, SUM-49PT, CAL-51) were pre-treated with 20 µM A771726 for 16 hours before exposure to doxorubicin for 48 hours. The percentage of dead cells in the population was determined using a propidium iodid viability assay. All error bars represent SEM. N.S. not significant, * P < 0.05, ** P < 0.01, *** P < 0.001 by a Student’s t-test.
Fig. 4
Fig. 4. Inhibition of the de novo pyrimidine synthesis pathway in combination with chemotherapy induces regression of TNBC tumor xenografts
(A) Fold changes of pyrimidine nucleotide abundances, as measured by LC-MS/MS, in vehicle treated MDA-MB-231 xenograft tumors versus MDA-MB-231 xenograft tumors treated with 1 mg/kg doxorubicin for 24 hours. (B) MDA-MB-231 xenografts were treated with leflunomide (Lef), doxorubicin (Dox) or a combination of leflunomide and doxorubicin (5 mice per group). Tumors were measured with calipers. (C) Waterfall plot depicting relative tumor volume between the treatment groups 28 days after treatment with vehicle (blue), leflunomide (orange), doxorubicin (purple) or leflunomide and doxorubicin (green). Each bar represents an individual mouse. (D) The body weight of mice treated with vehicle, leflunomide, doxorubicin or leflunomide and doxorubicin was monitored every 7 days for 28 days. No significant changes in body weight were observed during the course of the experiment. All error bars represent SEM. N.S. not significant, ** P < 0.01, *** P < 0.001 by a Student’s t-test.

References

    1. Isakoff SJ. Triple-negative breast cancer: role of specific chemotherapy agents. Cancer J. 2010;16:53–61. - PMC - PubMed
    1. Guarneri V, Broglio K, Kau SW, Cristofanilli M, Buzdar AU, Valero V, et al. Prognostic value of pathologic complete response after primary chemotherapy in relation to hormone receptor status and other factors. J Clin Oncol. 2006;24:1037–1044. - PubMed
    1. Kuerer HM, Newman LA, Smith TL, Ames FC, Hunt KK, Dhingra K, et al. Clinical course of breast cancer patients with complete pathologic primary tumor and axillary lymph node response to doxorubicin-based neoadjuvant chemotherapy. J Clin Oncol. 1999;17:460–469. - PubMed
    1. Liedtke C, Mazouni C, Hess KR, Andre F, Tordai A, Mejia JA, et al. Response to neoadjuvant therapy and long-term survival in patients with triple-negative breast cancer. J Clin Oncol. 2008;26:1275–1281. - PubMed
    1. Cortazar P, Zhang L, Untch M, Mehta K, Costantino JP, Wolmark N, et al. Pathological complete response and long-term clinical benefit in breast cancer: the CTNeoBC pooled analysis. Lancet. 2014;384:164–172. - PubMed

MeSH terms

LinkOut - more resources