

Mechanisms of the deep, slow-wave, sleep-related increase of upper airway muscle tone in healthy humans
- PMID: 28255086
- PMCID: PMC6157479
- DOI: 10.1152/japplphysiol.00872.2016
Mechanisms of the deep, slow-wave, sleep-related increase of upper airway muscle tone in healthy humans
Abstract
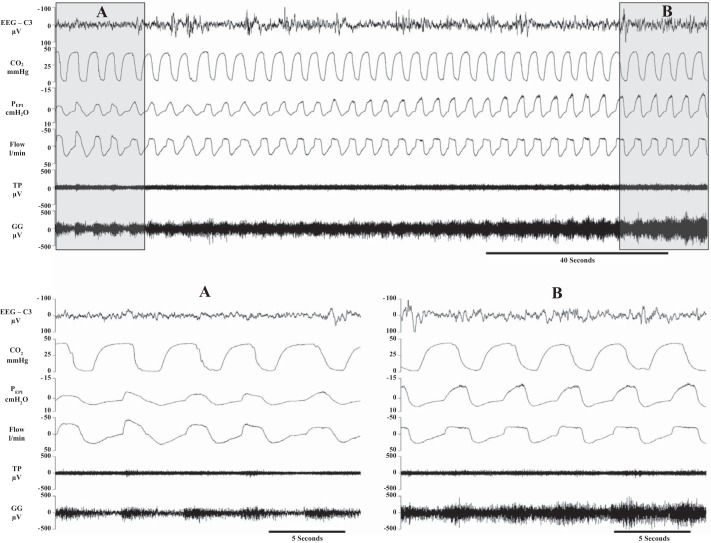
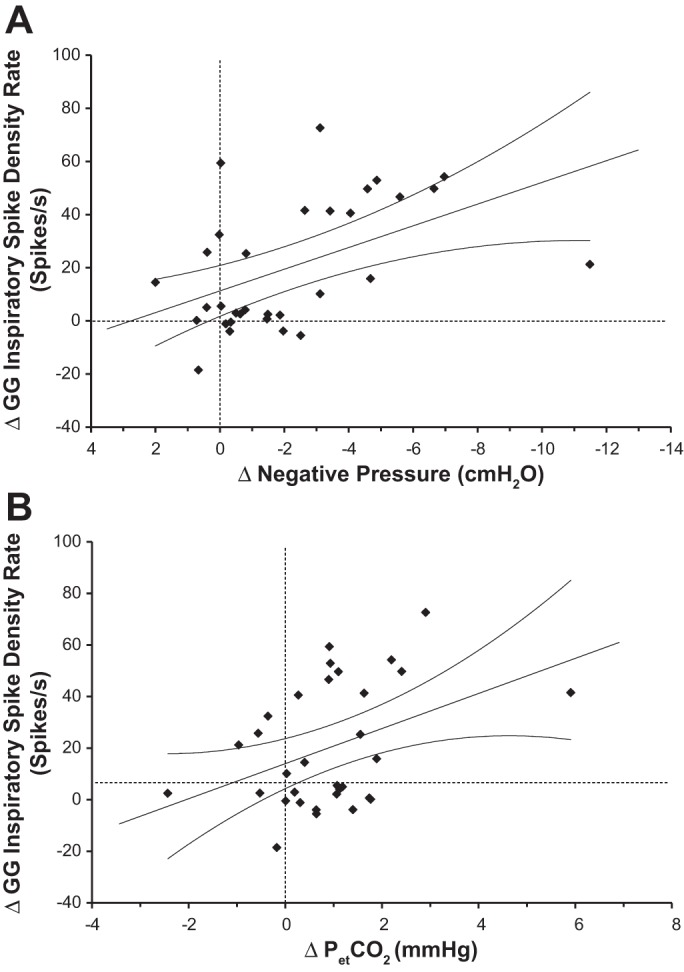
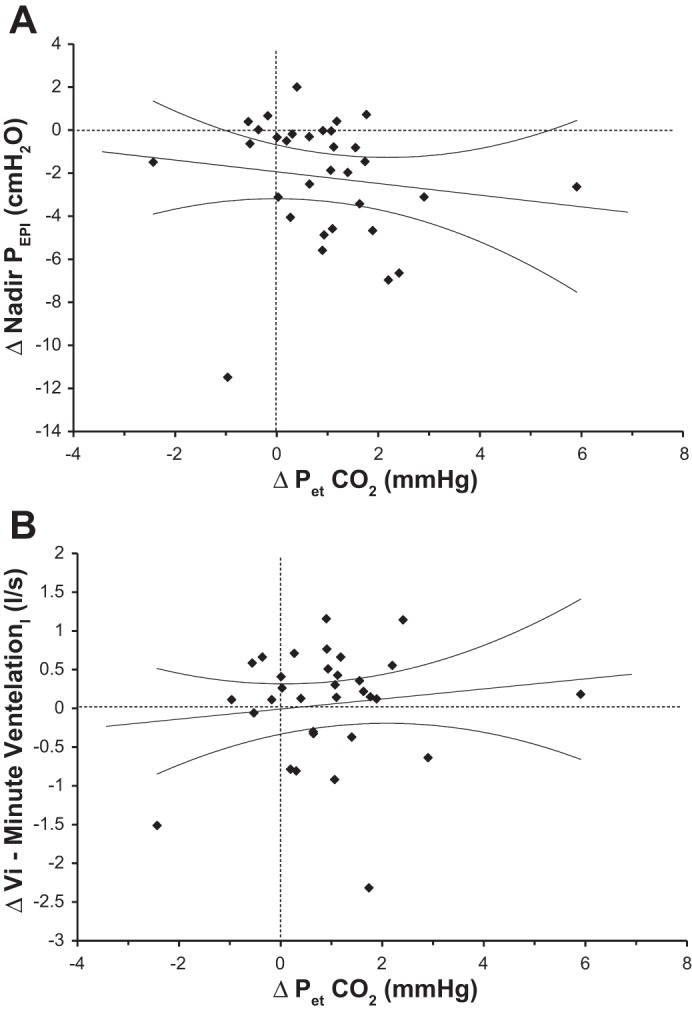
Upper airway muscle activity is reportedly elevated during slow-wave sleep (SWS) when compared with lighter sleep stages. To uncover the possible mechanisms underlying this elevation, we explored the correlation between different indices of central and reflex inspiratory drive, such as the changes in airway pressure and end-expiratory CO2 and the changes in the genioglossus (GG) and tensor palatini (TP) muscle activity accompanying transitions from the lighter N2 to the deeper N3 stage of non-rapid eye movement (NREM) sleep in healthy young adult men. Forty-six GG and 38 TP continuous electromyographic recordings were obtained from 16 men [age: 20 ± 2.5 (SD) yr; body mass index: 22.5 ± 1.8 kg/m2] during 32 transitions from NREM stages N2 to N3. GG but not TP activity increased following transition into N3 sleep, and the increase was positively correlated with more negative airway pressure, increased end-tidal CO2, increased peak inspiratory flow, and increased minute ventilation. None of these correlations was statistically significant for TP. Complementary GG and TP single motor unit analysis revealed a mild recruitment of GG units and derecruitment of TP units during the N2 to N3 transitions. These findings suggest that, in healthy individuals, the increased GG activity during SWS is driven primarily by reflex stimulation of airway mechanoreceptors and central chemoreceptors.NEW & NOTEWORTHY The characteristic increase in the activity of the upper airway dilator muscle genioglossus during slow-wave sleep (SWS) in young healthy individuals was found to be related to increased stimulation of airway mechanoreceptors and central chemoreceptors. No evidence was found for the presence of a central SWS-specific drive stimulating genioglossus activity in young healthy individuals. However, it remains to be determined whether a central drive exists in obstructive sleep apnea patients.
Keywords: genioglossus; non-rapid eye movement sleep; slow-wave sleep; tensor palatini; upper airway muscles.
Copyright © 2017 the American Physiological Society.
Figures
Similar articles
-
Airway dilator muscle activity and lung volume during stable breathing in obstructive sleep apnea.Sleep. 2009 Mar;32(3):361-8. doi: 10.1093/sleep/32.3.361. Sleep. 2009. PMID: 19294956 Free PMC article.
-
Upper airway muscle responsiveness to rising PCO(2) during NREM sleep.J Appl Physiol (1985). 2000 Oct;89(4):1275-82. doi: 10.1152/jappl.2000.89.4.1275. J Appl Physiol (1985). 2000. PMID: 11007559
-
A mechanism for upper airway stability during slow wave sleep.Sleep. 2013 Apr 1;36(4):555-63. doi: 10.5665/sleep.2544. Sleep. 2013. PMID: 23565001 Free PMC article.
-
Discharge properties of upper airway motor units during wakefulness and sleep.Prog Brain Res. 2014;212:59-75. doi: 10.1016/B978-0-444-63488-7.00004-5. Prog Brain Res. 2014. PMID: 25194193 Review.
-
[Upper airway muscles and physiopathology of obstructive sleep apnea syndrome].Neurophysiol Clin. 1994 Jun;24(3):195-206. doi: 10.1016/s0987-7053(05)80184-4. Neurophysiol Clin. 1994. PMID: 8090153 Review. French.
Cited by
-
Remote Monitoring of Positive Airway Pressure Data: Challenges, Pitfalls, and Strategies to Consider for Optimal Data Science Applications.Chest. 2023 May;163(5):1279-1291. doi: 10.1016/j.chest.2022.11.034. Epub 2022 Dec 2. Chest. 2023. PMID: 36470417 Free PMC article. Review.
-
Sleeping tongue: current perspectives of genioglossus control in healthy individuals and patients with obstructive sleep apnea.Nat Sci Sleep. 2018 Jun 15;10:169-179. doi: 10.2147/NSS.S143296. eCollection 2018. Nat Sci Sleep. 2018. PMID: 29942169 Free PMC article. Review.
-
Cardioventilatory Control in Preterm-born Children and the Risk of Obstructive Sleep Apnea.Am J Respir Crit Care Med. 2018 Jun 15;197(12):1596-1603. doi: 10.1164/rccm.201708-1700OC. Am J Respir Crit Care Med. 2018. PMID: 29323933 Free PMC article.
-
Relationship between the activity of the genioglossus, other peri-pharyngeal muscles and flow mechanics during wakefulness and sleep in patients with OSA and healthy subjects.Respir Physiol Neurobiol. 2020 Mar;274:103362. doi: 10.1016/j.resp.2019.103362. Epub 2019 Dec 19. Respir Physiol Neurobiol. 2020. PMID: 31866501 Free PMC article.
-
Neural memory of the genioglossus muscle during sleep is stage-dependent in healthy subjects and obstructive sleep apnoea patients.J Physiol. 2018 Nov;596(21):5163-5173. doi: 10.1113/JP276618. Epub 2018 Sep 4. J Physiol. 2018. PMID: 30022493 Free PMC article.
References
-
- DeWeese EL, Sullivan TY. Effects of upper airway anesthesia on pharyngeal patency during sleep. J Appl Physiol (1985) : 1346–1353, 1988. - PubMed
MeSH terms
Substances
Grants and funding
LinkOut - more resources
Full Text Sources
Other Literature Sources