

Differences in electroencephalographic non-rapid-eye movement sleep slow-wave characteristics between young and old mice
- PMID: 28255162
- PMCID: PMC5334640
- DOI: 10.1038/srep43656
Differences in electroencephalographic non-rapid-eye movement sleep slow-wave characteristics between young and old mice
Abstract
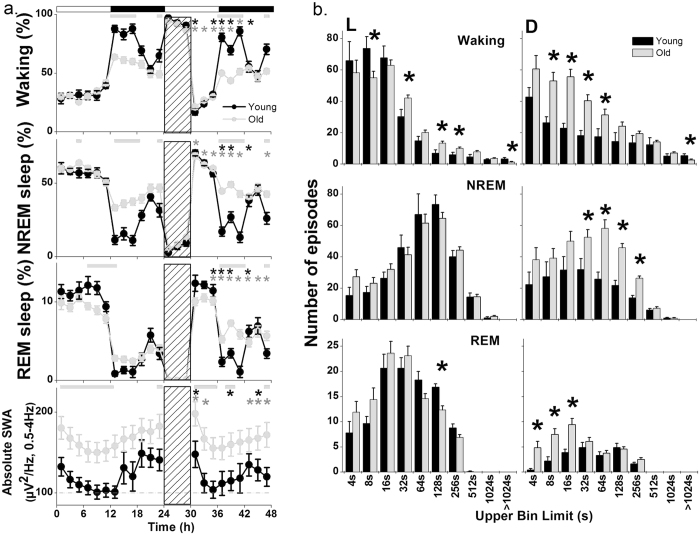
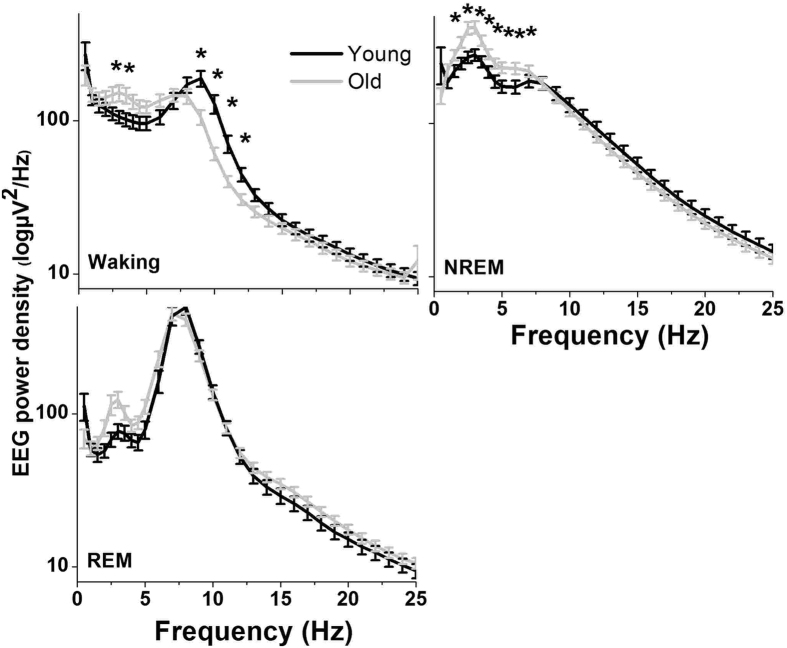
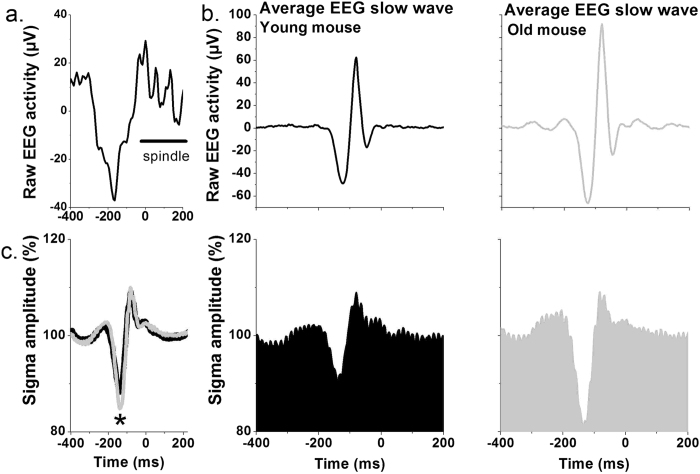
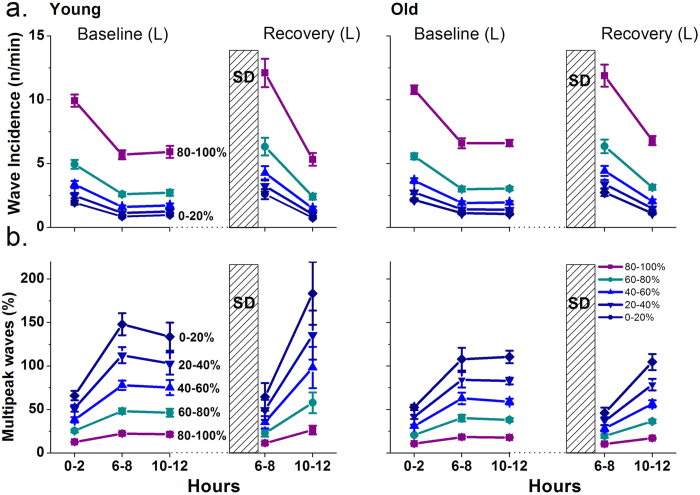
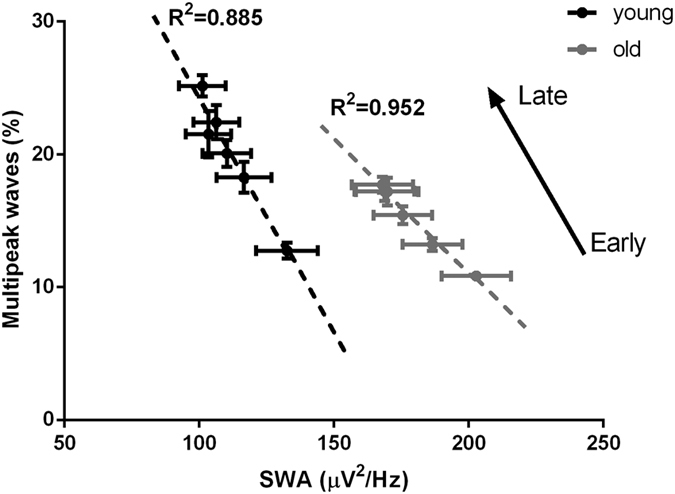
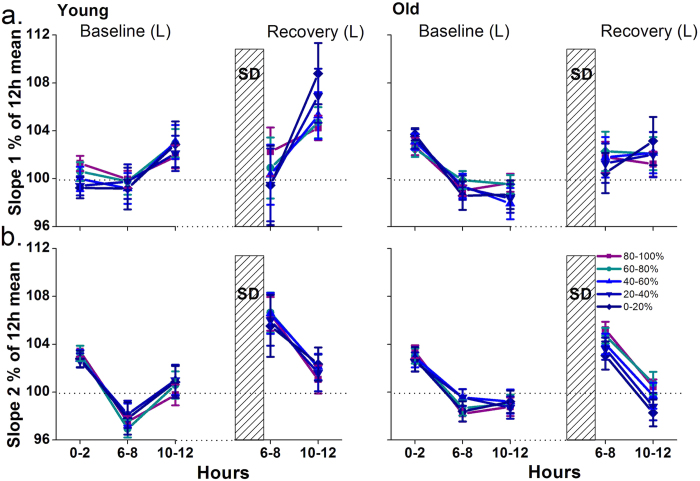
Changes in sleep pattern are typical for the normal aging process. However, aged mice show an increase in the amount of sleep, whereas humans show a decrease when aging. Mice are considered an important model in aging studies, and this divergence warrants further investigation. Recently, insights into the network dynamics of cortical activity during sleep were obtained by investigating characteristics of individual electroencephalogram (EEG) slow waves in young and elderly humans. In this study, we investigated, for the first time, the parameters of EEG slow waves, including their incidence, amplitude, duration and slopes, in young (6 months) and older (18-24 months) C57BL/6J mice during undisturbed 24 h, and after a 6-h sleep deprivation (SD). As expected, older mice slept more but, in contrast to humans, absolute NREM sleep EEG slow-wave activity (SWA, spectral power density between 0.5-4 Hz) was higher in the older mice, as compared to the young controls. Furthermore, slow waves in the older mice were characterized by increased amplitude, steeper slopes and fewer multipeak waves, indicating increased synchronization of cortical neurons in aging, opposite to what was found in humans. Our results suggest that older mice, in contrast to elderly humans, live under a high sleep pressure.
Conflict of interest statement
The authors declare no competing financial interests.
Figures
Similar articles
-
Sleep homeostasis and cortical synchronization: III. A high-density EEG study of sleep slow waves in humans.Sleep. 2007 Dec;30(12):1643-57. doi: 10.1093/sleep/30.12.1643. Sleep. 2007. PMID: 18246974 Free PMC article.
-
Different Effects of Sleep Deprivation and Torpor on EEG Slow-Wave Characteristics in Djungarian Hamsters.Cereb Cortex. 2017 Feb 1;27(2):950-961. doi: 10.1093/cercor/bhx020. Cereb Cortex. 2017. PMID: 28168294 Free PMC article.
-
Effects of partial sleep deprivation on slow waves during non-rapid eye movement sleep: A high density EEG investigation.Clin Neurophysiol. 2016 Feb;127(2):1436-1444. doi: 10.1016/j.clinph.2015.10.040. Epub 2015 Nov 10. Clin Neurophysiol. 2016. PMID: 26596212 Free PMC article.
-
The visual scoring of sleep and arousal in infants and children.J Clin Sleep Med. 2007 Mar 15;3(2):201-40. J Clin Sleep Med. 2007. PMID: 17557427 Review.
-
Age-related changes in the circadian and homeostatic regulation of human sleep.Chronobiol Int. 2006;23(1-2):461-74. doi: 10.1080/07420520500545813. Chronobiol Int. 2006. PMID: 16687319 Review.
Cited by
-
Total Sleep Deprivation Increases Brain Age Prediction Reversibly in Multisite Samples of Young Healthy Adults.J Neurosci. 2023 Mar 22;43(12):2168-2177. doi: 10.1523/JNEUROSCI.0790-22.2023. Epub 2023 Feb 20. J Neurosci. 2023. PMID: 36804738 Free PMC article.
-
Infraslow coordination of slow wave activity through altered neuronal synchrony.Sleep. 2019 Dec 24;42(12):zsz170. doi: 10.1093/sleep/zsz170. Sleep. 2019. PMID: 31353415 Free PMC article.
-
A role for the thalamus in danger evoked awakening during sleep.Nat Commun. 2025 Jul 31;16(1):7049. doi: 10.1038/s41467-025-62265-0. Nat Commun. 2025. PMID: 40745182 Free PMC article.
-
Slow Waves Promote Sleep-Dependent Plasticity and Functional Recovery after Stroke.J Neurosci. 2020 Nov 4;40(45):8637-8651. doi: 10.1523/JNEUROSCI.0373-20.2020. Epub 2020 Oct 21. J Neurosci. 2020. PMID: 33087472 Free PMC article.
-
The Biological Clock in Gray Mouse Lemur: Adaptive, Evolutionary and Aging Considerations in an Emerging Non-human Primate Model.Front Physiol. 2019 Aug 9;10:1033. doi: 10.3389/fphys.2019.01033. eCollection 2019. Front Physiol. 2019. PMID: 31447706 Free PMC article. Review.
References
-
- Crowley K. Sleep and sleep disorders in older adults. Neuropsychol Rev. 21, 41–53 (2011). - PubMed
-
- Landolt H. P., Dijk D. J., Achermann P. & Borbély A. A. Effect of age on the sleep EEG: slow-wave activity and spindle frequency activity in young and middle-aged men. Brain Res. 738, 205–212 (1996). - PubMed
-
- Carrier J., Land S., Buysse D. J., Kupfer D. J. & Monk T. H. The effects of age and gender on sleep EEG power spectral density in the middle years of life (ages 20-60 years old). Psychophysiology 38, 232–242 (2001). - PubMed
-
- Luca G. et al.. Age and gender variations of sleep in subjects without sleep disorders. Ann Med. 47, 482–491 (2015). - PubMed
-
- Carrier J. et al.. Sleep slow wave changes during the middle years of life. Eur J Neurosci. 33, 758–766 (2011). - PubMed
Publication types
MeSH terms
Grants and funding
LinkOut - more resources
Full Text Sources
Other Literature Sources
Molecular Biology Databases
Research Materials
