

Non-Uniform Object-Space Pixelation (NUOP) for Penalized Maximum-Likelihood Image Reconstruction for a Single Photon Emission Microscope System
- PMID: 28255178
- PMCID: PMC5330327
- DOI: 10.1109/TNS.2009.2024677
Non-Uniform Object-Space Pixelation (NUOP) for Penalized Maximum-Likelihood Image Reconstruction for a Single Photon Emission Microscope System
Abstract
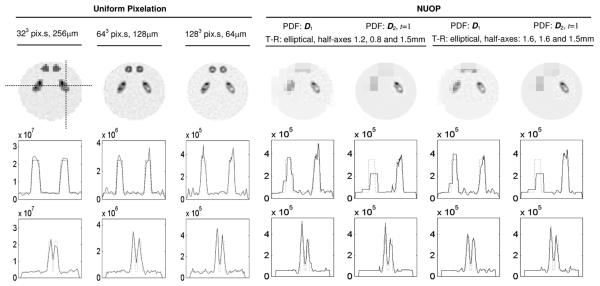
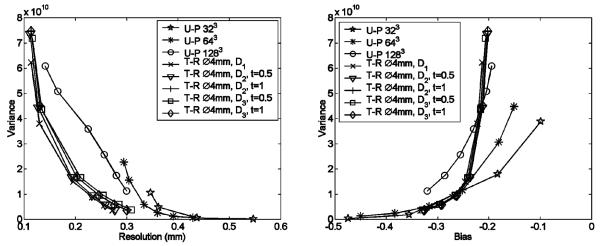
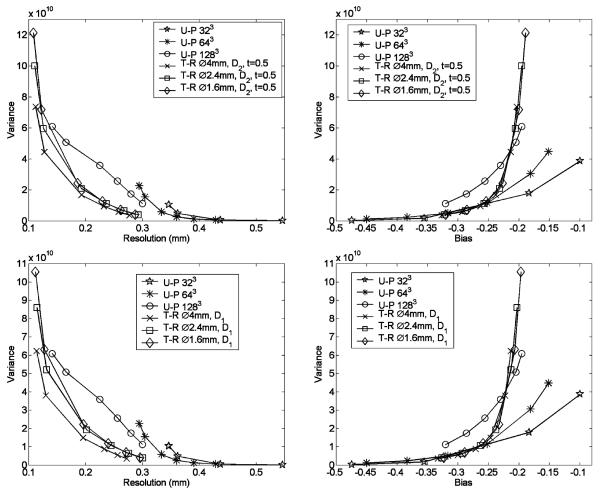
This paper presents a non-uniform object-space pixelation (NUOP) approach for image reconstruction using the penalized maximum likelihood methods. This method was developed for use with a single photon emission microscope (SPEM) system that offers an ultrahigh spatial resolution for a targeted local region inside mouse brain. In this approach, the object-space is divided with non-uniform pixel sizes, which are chosen adaptively based on object-dependent criteria. These include (a) some known characteristics of a target-region, (b) the associated Fisher Information that measures the weighted correlation between the responses of the system to gamma ray emissions occurred at different spatial locations, and (c) the linear distance from a given location to the target-region. In order to quantify the impact of this non-uniform pixelation approach on image quality, we used the Modified Uniform Cramer-Rao bound (MUCRB) to evaluate the local resolution-variance and bias-variance tradeoffs achievable with different pixelation strategies. As demonstrated in this paper, an efficient object-space pixelation could improve the speed of computation by 1-2 orders of magnitude, whilst maintaining an excellent reconstruction for the target-region. This improvement is crucial for making the SPEM system a practical imaging tool for mouse brain studies. The proposed method also allows rapid computation of the first and second order statistics of reconstructed images using analytical approximations, which is the key for the evaluation of several analytical system performance indices for system design and optimization.
Keywords: Non-uniform object-space pixelation (NUOP); penalized maximum-likelihood; single-photon emission microscope (SPEM).
Figures
References
-
- Cherry SR. In vivo molecular and genomic imaging: New challenges for imaging physics. Phys. Med. Biol. 2004;49:R13–R48. - PubMed
-
- Peterson TE, Wilson DW, Barrett HH. Application of silicon strip detectors to small-animal imaging. Nucl. Instr. Methods. 2003;505:608–611.
-
- Accorsi R, Autiero M, Celentano L, Chmeissani M, Curion AS, Frallicciardi P, Laccetti P, Lanza RC, Lauria A, Maiorino M, Marotta M, Mettivier G, Montesi MC, Riccio P, Roberti G, Russo P. MediSPECT: Single photon emission computed tomography system for small field of view small animal imaging based on a cdte hybrid pixel detector. Nucl. Instr. Methods. 2007;571:44–47.
-
- Beekman FJ, Vastenhouw B. Design and simulation of a high-resolution stationary SPECT system for small animals. Phys. Med. Biol. 2004;49:4579–4592. - PubMed
Grants and funding
LinkOut - more resources
Full Text Sources
Research Materials