. 2017 Jan 7;7(3):562-572.
doi: 10.7150/thno.16895. eCollection 2017.

Tracking Perfluorocarbon Nanoemulsion Delivery by 19F MRI for Precise High Intensity Focused Ultrasound Tumor Ablation

Affiliations

Tracking Perfluorocarbon Nanoemulsion Delivery by 19F MRI for Precise High Intensity Focused Ultrasound Tumor Ablation

Soo Hyun Shin et al. Theranostics. .

Abstract

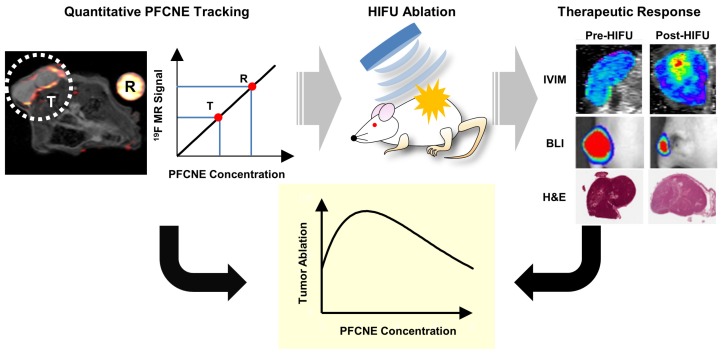
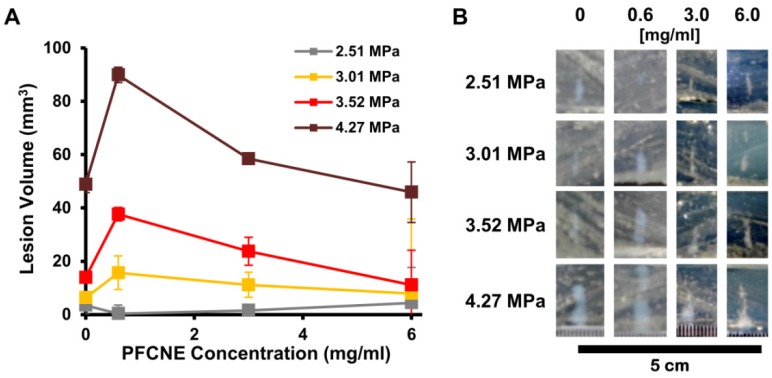
Perfluorocarbon nanoemulsions (PFCNEs) have recently been undergoing rigorous study to investigate their ability to improve the therapeutic efficacy of tumor ablation by high intensity focused ultrasound (HIFU). For precise control of PFCNE delivery and thermal ablation, their accumulation and distribution in a tumor should be quantitatively analyzed. Here, we used fluorine-19 (19F) magnetic resonance imaging (MRI) to quantitatively track PFCNE accumulation in a tumor, and analyzed how intra-tumoral PFCNE quantities affect the therapeutic efficacy of HIFU treatment. Ablation outcomes were assessed by intra-voxel incoherent motion analysis and bioluminescent imaging up to 14 days after the procedure. Assessment of PFCNE delivery and treatment outcomes showed that 2-3 mg/mL of PFCNE in a tumor produces the largest ablation volume under the same HIFU insonation conditions. Histology showed varying degrees of necrosis depending on the amount of PFCNE delivered. 19F MRI promises to be a valuable platform for precisely guiding PFCNE-enhanced HIFU ablation of tumors.

Keywords: 19F MRI; Diffusion MR; High Intensity Focused Ultrasound (HIFU); Perfluorocarbon nanoemulsion (PFCNE); Tumor Ablation.


Conflict of interest statement

Competing Interests: The authors have declared that no competing interest exists.

Figures

Figure 1
Figure 1
Schematic illustration showing the usage of 19F MRI for efficient and reproducible perfluorocarbon nanoemulsion (PFCNE)-enhanced high intensity focused ultrasound (HIFU) tumor ablation. Owing to the heterogeneous tumor microenvironment, the accumulation of PFCNE in a tumor can be highly variable, leading to unpredictable therapeutic outcomes after HIFU treatment. Using 19F MRI, the concentration of PFCNE in a tumor can be quantified via imaging along by using a reference containing a known concentration of PFCNE. HIFU treatment can be performed after the quantification process, followed by evaluation of therapeutic outcomes. Afterwards, the PFCNE concentration in a tumor, as measured by 19F MRI, can be correlated with therapeutic outcomes. This information will enable the prediction of the therapeutic outcomes at given concentrations of PFCNE, as well as the optimization of the parameters involved in PFCNE accumulation in a tumor (such as PFCNE formulation and delivery route) for efficient HIFU tumor ablation.
Figure 2
Figure 2
In vitro characterization of perfluorocarbon nanoemulsions (PFCNEs). Chemical structures of (A) perfluoro-15-crown-5-ether and (B) Lutrol F68. (C) Transmission electron microscopy image of PFCNE (scale bar = 800 nm for low magnification and 100 nm for the inset). (D) Size distribution of PFCNEs immediately after formulation. (E) Long term tracking of PFCNE size while subjected to 3 different temperatures for up to 3 weeks. (F) Serum stability of PFCNE incubated at 37˚C. (G) HCT116 cell viability after PFCNE treatment. (H) Correlation of fluorescence signal and 19F MR signal intensity of PFCNE. (I) Fluorescence image (top row) and 19F MR images (bottom row) of reference tubes with various PFCNE concentrations.
Figure 3
Figure 3
Ex vivo simulation of high intensity focused ultrasound (HIFU) ablation. (A) Volumes of lesions formed by HIFU of different peak-negative pressures in tissue phantoms with various perfluorocarbon nanoemulsion (PFCNE) concentrations. (B) Photographs of lesions formed in the phantoms.
Figure 4
Figure 4
In vivo 19F magnetic resonance imaging (MRI) and signal quantification. (A-D) 1H/19F merged images of mice injected with 50 μL (A), 100 μL (B), 200 μL (C), and 400 μL (D) of perfluorocarbon nanoemulsion (PFCNE). PFCNE is mostly accumulated in the tumor rim (arrowhead). (E) Quantification of PFCNE accumulated in tumor. A significant increase in accumulation is observed when the dosage increases from 100 μL to 200 μL. (F) Fluorescence images of excised tumors from mice injected with 50, 100, 200, and 400 μL of PFCNE (left to right). (G) Correlation of fluorescence intensity and 19F MR signal intensity from excised tumors (green: 50 μL; blue: 100 μL; yellow: 200 μL; red: 400 μL).
Figure 5
Figure 5
Intra-voxel incoherent motion (IVIM) analysis of ablated lesions. (A) Longitudinal Dt maps of mice before and after high intensity focused ultrasound (HIFU) treatment. Ablated lesions are marked by increased Dt values. (B) Dt values of lesions over time beginning immediately after HIFU treatment (day 0). The black line indicates the median Dt of tumors before HIFU treatment, and the dashed lines indicate the standard deviation. (C) Lesion volume changes over time beginning immediately after HIFU treatment (day 0) as a function of perfluorocarbon nanoemulsion (PFCNE) volume (*P < 0.05 vs. PFC-). (D) Correlation of the maximum lesion Dt increase and tumor PFCNE concentration. The dashed line indicates the trend of the data. (E) Correlation of lesion volume and PFCNE concentration in tumor, measured on day 7. The dashed line indicates the trend of the data.
Figure 6
Figure 6
Longitudinal bioluminescence imaging (BLI). (A) BLI of mice before and after high intensity focused ultrasound (HIFU) treatment. (B) BLI signal intensity measurements after HIFU treatment. (C) Comparison of BLI signal intensities of animal groups measured immediately after HIFU treatment (◆: P < 0.05 vs. control; ●: P < 0.05 vs. PFC-; ■: P < 0.05 vs. PFC50+). (D) Correlation of BLI signal reduction and PFCNE concentration in a tumor. The dashed line indicates the trend of the data.
Figure 7
Figure 7
Histology of tumors after high intensity focused ultrasound (HIFU) treatment. HIFU-ablated regions are clearly visible in low magnification (10×) overview (dashed lines). Higher magnification images (200×, scale bar: 100 μm) were acquired in the central zone (yellow box) and peripheral zone (white box) of ablated lesions. All groups show ballooning degeneration in the peripheral zone of the ablated lesions; the PFC50+ group additionally shows dilated blood vessels (green arrows). Different degrees of necrosis and histological features were observed in the central zone depending on the amount of PFCNE injection (PFC-: hemorrhage; PFC50+: scattered necrotic zones [white arrows]; PFC100+: dilated blood vessels [white arrowheads]; PFC200+: complete necrosis with few cell remnants; PFC400+: no significant changes observed).

References

    1. State of the technology. Charlottesville, VA, USA: Focused Ultrasound Foundation; http://www.fusfoundation.org/the-technology/state-of-the-technology.
    1. Lukka H, Waldron T, Chin J. et al. High-intensity focused ultrasound for prostate cancer: a systematic review. Clin Oncol. 2011;23:117–27. - PubMed
    1. Ringold S. FDA approves ultrasound fibroid therapy. JAMA. 2004;292:2826. - PubMed
    1. Tempany CM, McDannold NJ, Hynynen K. et al. Focused ultrasound surgery in oncology: overview and principles. Radiology. 2011;259:39–56. - PMC - PubMed
    1. Gedroyc WM, Anstee A. MR-guided focused ultrasound. Expert Rev Med Devices. 2007;4:539–47. - PubMed

Publication types