

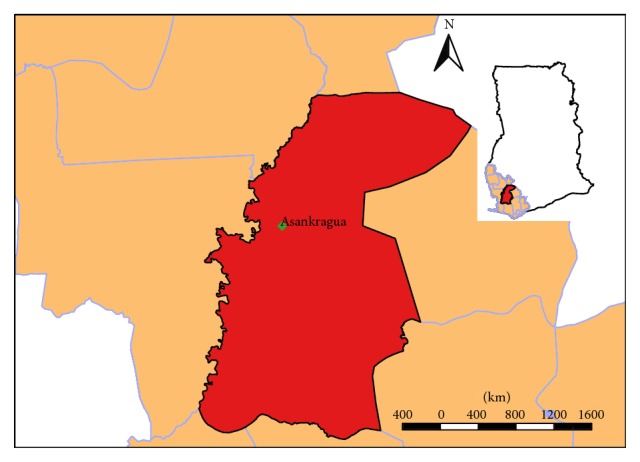
A Weather-Based Prediction Model of Malaria Prevalence in Amenfi West District, Ghana
- PMID: 28255497
- PMCID: PMC5307250
- DOI: 10.1155/2017/7820454
A Weather-Based Prediction Model of Malaria Prevalence in Amenfi West District, Ghana
Abstract
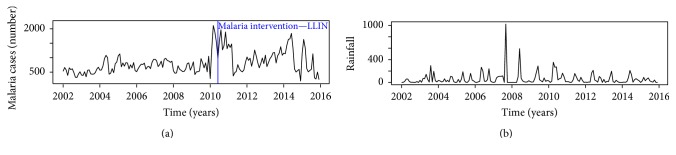
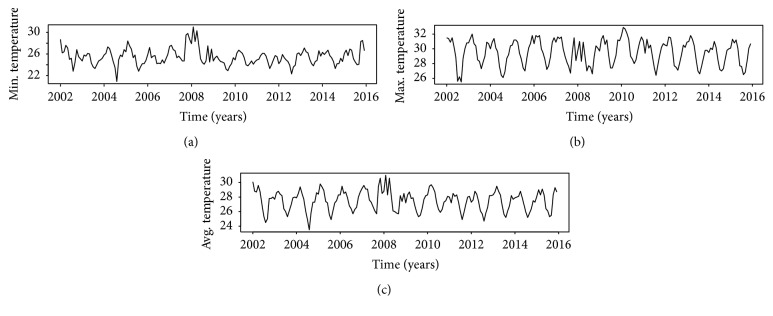
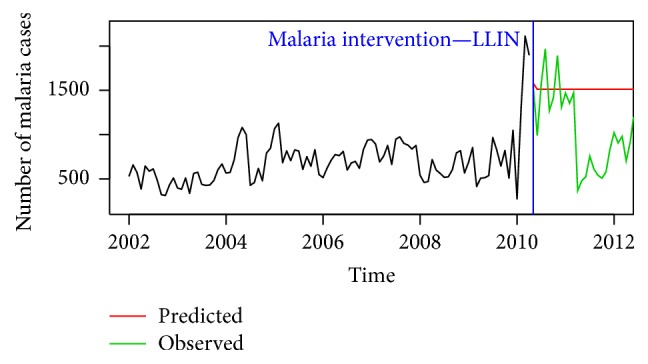
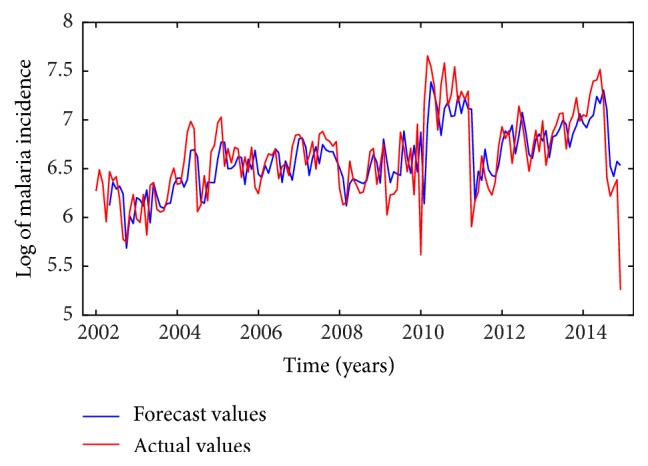
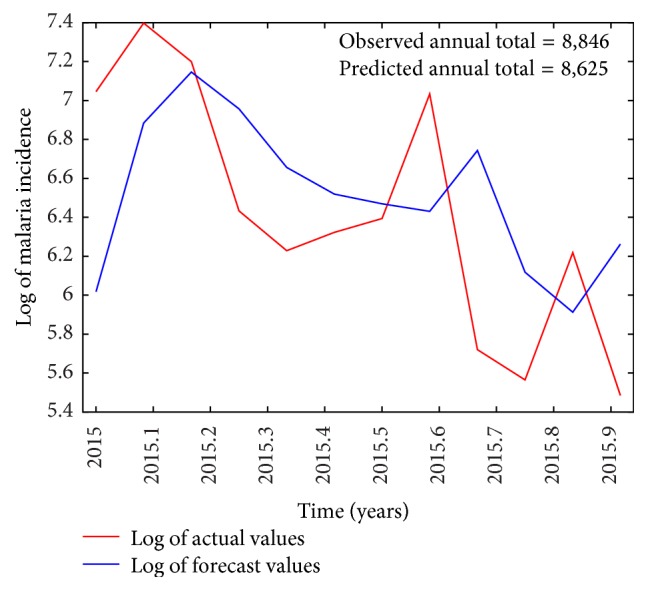
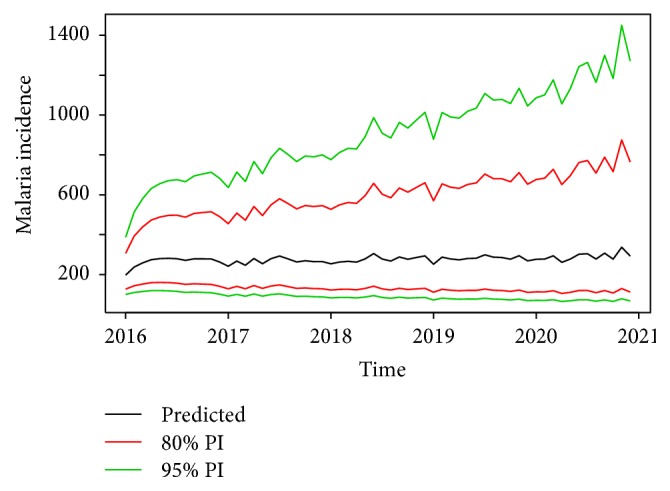
This study investigated the effects of climatic variables, particularly, rainfall and temperature, on malaria incidence using time series analysis. Our preliminary analysis revealed that malaria incidence in the study area decreased at about 0.35% annually. Also, the month of November recorded approximately 21% more malaria cases than the other months while September had a decreased effect of about 14%. The forecast model developed for this investigation indicated that mean minimum (P = 0.01928) and maximum (P = 0.00321) monthly temperatures lagged at three months were significant predictors of malaria incidence while rainfall was not. Diagnostic tests using Ljung-Box and ARCH-LM tests revealed that the model developed was adequate for forecasting. Forecast values for 2016 to 2020 generated by our model suggest a possible future decline in malaria incidence. This goes to suggest that intervention strategies put in place by some nongovernmental and governmental agencies to combat the disease are effective and thus should be encouraged and routinely monitored to yield more desirable outcomes.
Conflict of interest statement
The authors declare that there are no competing interests.
Figures
Similar articles
-
Developing a dengue prediction model based on climate in Tawau, Malaysia.Acta Trop. 2019 Sep;197:105055. doi: 10.1016/j.actatropica.2019.105055. Epub 2019 Jun 8. Acta Trop. 2019. PMID: 31185224
-
Malaria Risk Stratification and Modeling the Effect of Rainfall on Malaria Incidence in Eritrea.J Environ Public Health. 2019 Apr 1;2019:7314129. doi: 10.1155/2019/7314129. eCollection 2019. J Environ Public Health. 2019. PMID: 31061663 Free PMC article.
-
Climatic Variables and Malaria Morbidity in Mutale Local Municipality, South Africa: A 19-Year Data Analysis.Int J Environ Res Public Health. 2017 Nov 8;14(11):1360. doi: 10.3390/ijerph14111360. Int J Environ Res Public Health. 2017. PMID: 29117114 Free PMC article.
-
Rainfall Trends and Malaria Occurrences in Limpopo Province, South Africa.Int J Environ Res Public Health. 2019 Dec 17;16(24):5156. doi: 10.3390/ijerph16245156. Int J Environ Res Public Health. 2019. PMID: 31861127 Free PMC article.
-
Climatic variables and transmission of malaria: a 12-year data analysis in Shuchen County, China.Public Health Rep. 2003 Jan-Feb;118(1):65-71. doi: 10.1093/phr/118.1.65. Public Health Rep. 2003. PMID: 12604766 Free PMC article.
Cited by
-
Malaria patients in Nigeria: Data exploration approach.Data Brief. 2019 Dec 16;28:104997. doi: 10.1016/j.dib.2019.104997. eCollection 2020 Feb. Data Brief. 2019. PMID: 32226801 Free PMC article.
-
Spatio-temporal heterogeneity of malaria morbidity in Ghana: Analysis of routine health facility data.PLoS One. 2018 Jan 29;13(1):e0191707. doi: 10.1371/journal.pone.0191707. eCollection 2018. PLoS One. 2018. PMID: 29377908 Free PMC article.
-
Ten years of monitoring malaria trend and factors associated with malaria test positivity rates in Lower Moshi.Malar J. 2021 Apr 20;20(1):193. doi: 10.1186/s12936-021-03730-1. Malar J. 2021. PMID: 33879164 Free PMC article.
-
Generalized Linear Models to Forecast Malaria Incidence in Three Endemic Regions of Senegal.Int J Environ Res Public Health. 2023 Jul 5;20(13):6303. doi: 10.3390/ijerph20136303. Int J Environ Res Public Health. 2023. PMID: 37444150 Free PMC article.
-
Effects of rainfall, temperature and topography on malaria incidence in elimination targeted district of Ethiopia.Malar J. 2021 Feb 19;20(1):104. doi: 10.1186/s12936-021-03641-1. Malar J. 2021. PMID: 33608004 Free PMC article.
References
-
- Kiszewski A., Mellinger A., Spielman A., Malaney P., Sachs S. E., Sachs J. A global index representing the stability of malaria transmission. The American Journal of Tropical Medicine and Hygiene. 2004;70(5):486–498. - PubMed
-
- World Health Organization. Malaria Report in Ghana. 2009. http://www.who.int/malaria/publications/country-profiles/2009/mal2009_gh....
-
- Gakpey K., Baffoe-Wilmot A., Malm K., Dadzie S., Bart-Plange C. Strategies towards attainment of universal coverage of long lasting insecticide treated nets (LLINs) distribution: Experiences and lessons from Ghana. Parasites and Vectors. 2016;9(1, article 35) doi: 10.1186/s13071-016-1328-5. - DOI - PMC - PubMed
LinkOut - more resources
Full Text Sources
Other Literature Sources
