

Do All X-ray Structures of Protein-Ligand Complexes Represent Functional States? EPOR, a Case Study
- PMID: 28256220
- PMCID: PMC5340159
- DOI: 10.1016/j.bpj.2016.12.042
Do All X-ray Structures of Protein-Ligand Complexes Represent Functional States? EPOR, a Case Study
Abstract
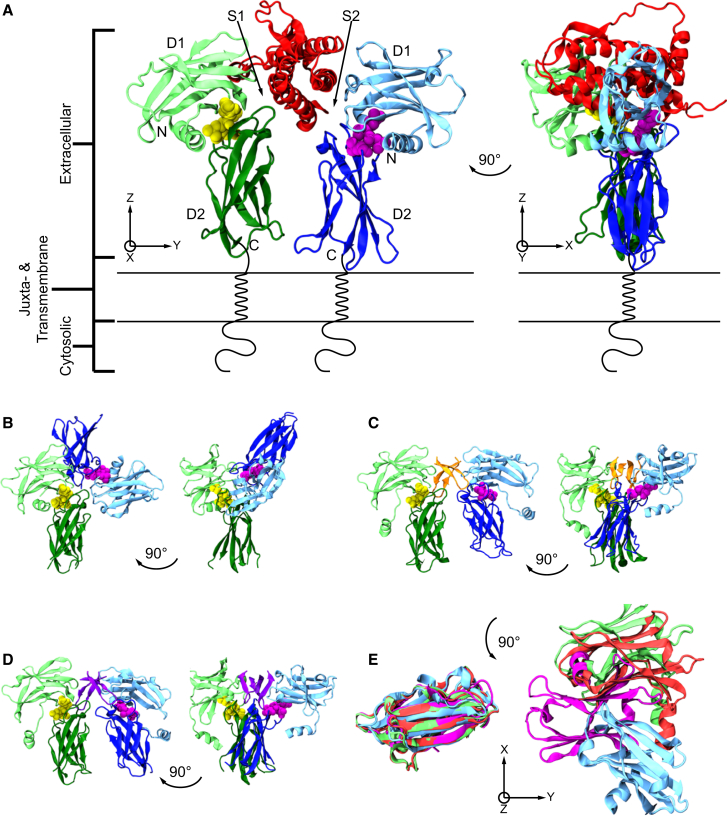
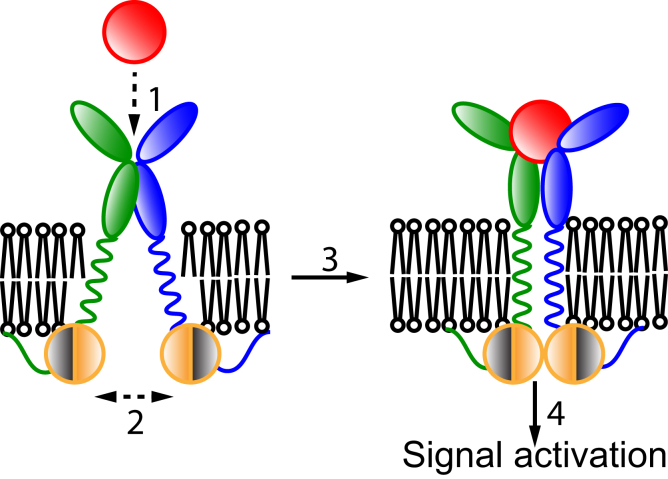
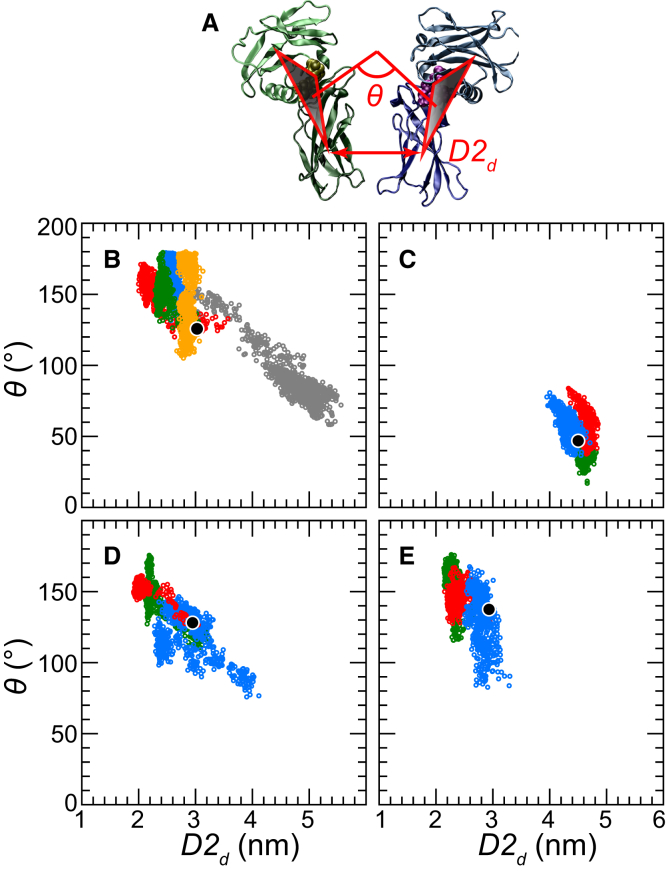
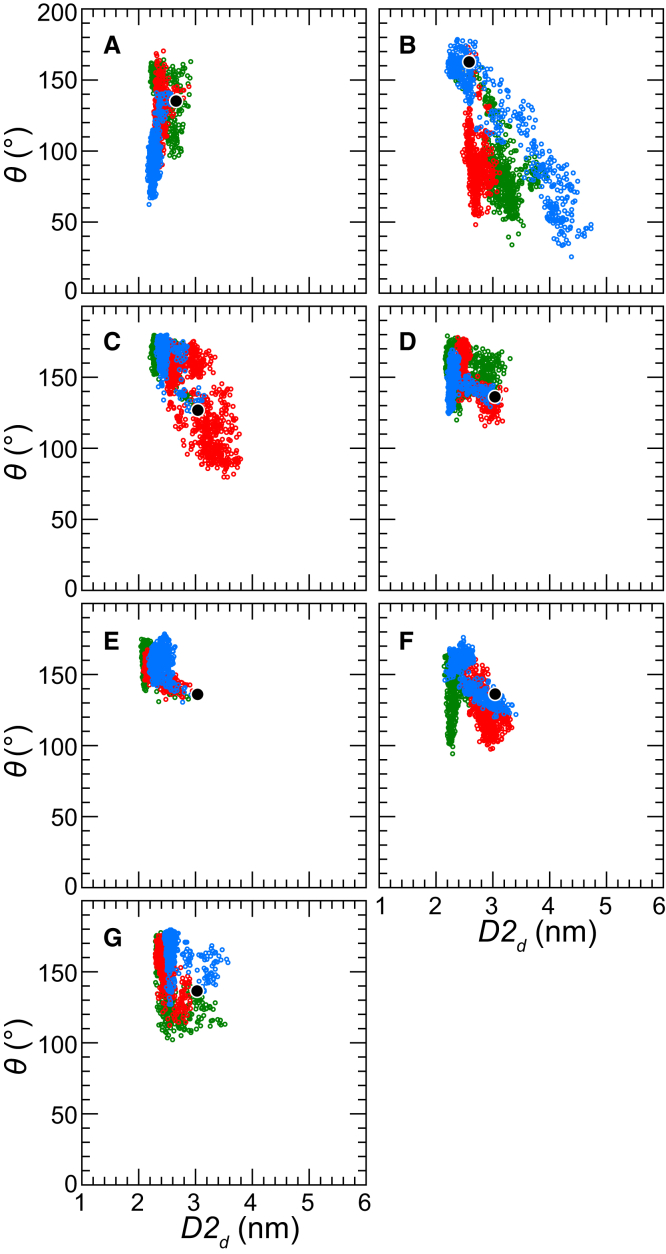
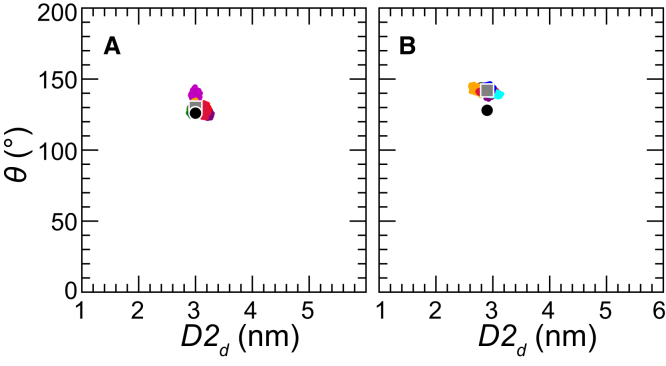
Based on differences between the x-ray crystal structures of ligand-bound and unbound forms, the activation of the erythropoietin receptor (EPOR) was initially proposed to involve a cross-action scissorlike motion. However, the validity of the motions involved in the scissorlike model has been recently challenged. Here, atomistic molecular dynamics simulations are used to examine the structure of the extracellular domain of the EPOR dimer in the presence and absence of erythropoietin and a series of agonistic or antagonistic mimetic peptides free in solution. The simulations suggest that in the absence of crystal packing effects, the EPOR chains in the different dimers adopt very similar conformations with no clear distinction between the agonist and antagonist-bound complexes. This questions whether the available x-ray crystal structures of EPOR truly represent active or inactive conformations. The study demonstrates the difficulty in using such structures to infer a mechanism of action, especially in the case of membrane receptors where just part of the structure has been considered in addition to potential confounding effects that arise from the comparison of structures in a crystal as opposed to a membrane environment. The work highlights the danger of assigning functional significance to small differences between structures of proteins bound to different ligands in a crystal environment without consideration of the effects of the crystal lattice and thermal motion.
Copyright © 2017 Biophysical Society. Published by Elsevier Inc. All rights reserved.
Figures
Similar articles
-
Crystallographic evidence for preformed dimers of erythropoietin receptor before ligand activation.Science. 1999 Feb 12;283(5404):987-90. doi: 10.1126/science.283.5404.987. Science. 1999. PMID: 9974392
-
Analysis of the Asymmetry of Activated EPO Receptor Enables Designing Small Molecule Agonists.Vitam Horm. 2017;105:19-37. doi: 10.1016/bs.vh.2017.03.004. Epub 2017 May 18. Vitam Horm. 2017. PMID: 28629518
-
Tuning cytokine receptor signaling by re-orienting dimer geometry with surrogate ligands.Cell. 2015 Mar 12;160(6):1196-208. doi: 10.1016/j.cell.2015.02.011. Epub 2015 Feb 26. Cell. 2015. PMID: 25728669 Free PMC article.
-
Revisiting the scissor-like mechanism of activation for the erythropoietin receptor.FEBS Lett. 2016 Sep;590(18):3083-8. doi: 10.1002/1873-3468.12340. Epub 2016 Aug 18. FEBS Lett. 2016. PMID: 27490140 Review.
-
Receptor dimerization in GH and erythropoietin action--it takes two to tango, but how?Endocrinology. 2002 Jan;143(1):2-10. doi: 10.1210/endo.143.1.8607. Endocrinology. 2002. PMID: 11751584 Review.
Cited by
-
Mapping Ryanodine Binding Sites in the Pore Cavity of Ryanodine Receptors.Biophys J. 2017 Apr 25;112(8):1645-1653. doi: 10.1016/j.bpj.2017.03.014. Biophys J. 2017. PMID: 28445755 Free PMC article.
-
Molecular basis of JAK2 activation in erythropoietin receptor and pathogenic JAK2 signaling.Sci Adv. 2024 Mar 8;10(10):eadl2097. doi: 10.1126/sciadv.adl2097. Epub 2024 Mar 8. Sci Adv. 2024. PMID: 38457493 Free PMC article.
-
EPO does not promote interaction between the erythropoietin and beta-common receptors.Sci Rep. 2018 Aug 20;8(1):12457. doi: 10.1038/s41598-018-29865-x. Sci Rep. 2018. PMID: 30127368 Free PMC article.
References
-
- Cunningham B.C., Ultsch M., Wells J.A. Dimerization of the extracellular domain of the human growth hormone receptor by a single hormone molecule. Science. 1991;254:821–825. - PubMed
-
- Ultsch M., de Vos A.M., Kossiakoff A.A. Crystals of the complex between human growth hormone and the extracellular domain of its receptor. J. Mol. Biol. 1991;222:865–868. - PubMed
-
- Livnah O., Stura E.A., Wilson I.A. Crystallographic evidence for preformed dimers of erythropoietin receptor before ligand activation. Science. 1999;283:987–990. - PubMed
-
- Livnah O., Stura E.A., Wilson I.A. Functional mimicry of a protein hormone by a peptide agonist: the EPO receptor complex at 2.8 Å. Science. 1996;273:464–471. - PubMed
-
- Livnah O., Johnson D.L., Wilson I.A. An antagonist peptide-EPO receptor complex suggests that receptor dimerization is not sufficient for activation. Nat. Struct. Biol. 1998;5:993–1004. - PubMed
MeSH terms
Substances
LinkOut - more resources
Full Text Sources
Other Literature Sources
